Dizzy HOLO🚀 Dizzy HOLO is an all-in-one professional trading suite designed for serious traders.
It combines Pivot Points, Opening Range Breakout (ORB), HOLO (High of Low / Low of High), Weekly Levels, SMA Thresholds, and Real-Time Alerts into a single lightweight indicator.
🔑 Key Features:
✅ Pivot Points (Fibonacci & Camarilla) – Automatic support & resistance with labels.
✅ Opening Range Breakout (ORB) – Custom session ORB with historical data and breakout alerts.
✅ HOLO Strategy – Daily High/Low, Highest H1 Open, Lowest H1 Close with dynamic buy/sell zones.
✅ Weekly Levels – Previous Week High/Low/Open/Close with extended dotted projections.
✅ SMA Threshold Zones – Dynamic SMA with gray zone filter and trend-based candle coloring.
✅ Multi-Timeframe Analysis – Auto-switching pivots & real-time confirmation.
✅ Smart Alerts – Pivot breakouts, ORB levels, HOLO crosses, and Weekly breaks.
🎯 Why Use Dizzy HOLO?
This indicator is built for breakout, reversal, and trend traders. It provides clear market structure, liquidity zones, and actionable alerts so you never miss important setups.
🛠️ Best Suited For:
Intraday scalpers
Swing traders
Breakout traders
HOLO strategy followers
Multi-timeframe traders
Orb

ORB + Session VWAP Pro (London & NY) — fixedORB + Session VWAP Pro (London & NY) — Listing copy (EN)
What it is
A clean, non-repainting intraday tool that fuses the classic Opening Range Breakout (ORB) with a session-anchored VWAP filter for London and New York. It highlights only the higher-quality breakouts (above/below session VWAP), adds an optional retest confirmation, and scores each signal with an intuitive Confidence metric (0–100).
Why it works
• ORB provides the day’s first actionable structure (range high/low).
• Session VWAP filters “cheap” breaks and favors flows aligned with session value.
• Optional retest reduces first-tick whipsaws.
• Confidence blends breakout depth (vs ATR), VWAP slope and band distance.
Key visuals
• LDN/NY OR High/Low (line break style) + optional OR boxes.
• Active Session VWAP (resets per signal window; falls back to daily VWAP outside).
• Optional VWAP bands (stdev or %).
• Session shading (London/NY windows).
• Signal markers (LDN BUY/SELL, NY BUY/SELL) fired with cooldown.
Signals
• London Long / Short: Break of LDN OR High/Low ± ATR buffer, aligned with VWAP side.
• NY Long / Short: Same logic during NY window.
• Retest (optional): Requires a tag back to the OR level ± tolerance before confirmation.
• Confidence: 0–100; gate via Min Confidence (default 55).
Inputs that matter
• Open Range Length (min): Default 15.
• London/NY times & timezones.
• ATR buffer & retest tolerance.
• Bands mode: Stdev (with lookback) or % (e.g., 1%).
• Signal cooldown: Avoids clutter on fast moves.
Non-repaint policy
• OR lines build within fixed time windows using the current bar’s timestamp.
• VWAP is cumulative within the session window; no lookahead.
• All ta.crossover/ta.crossunder are precomputed every bar (no conditional execution).
• Signals are based on live bar values, not future bars.
⸻
Quick start (examples)
1) EURUSD, London momentum
• Chart: 5m or 15m.
• OR: 15 min starting 08:00 Europe/London.
• Signals: Use defaults; keep ATR buffer = 0.2 and Retest = ON, Min Confidence ≥ 55.
• Play:
• BUY when price breaks LDN OR High + buffer and stays above VWAP; retest confirms.
• Trail behind VWAP or band #1; partials into band #2.
2) NAS100, New York breakout & run
• Chart: 5m.
• NY window: 09:30 America/New_York, OR = 15 min.
• Retest OFF on high momentum days; Min Confidence ≥ 60.
• Use band mode Stdev, bandLen=50, show ±1/±2.
• Momentum continuation: add on pullbacks that hold above VWAP after the breakout.
3) XAUUSD, London fake & VWAP fade
• Chart: 5m.
• Keep Retest ON; accept only shorts that break OR Low but retest fails back under VWAP.
• Confidence gate ≥ 50 to allow more mean-reversion setups.
⸻
Pro tips
• Adjust ATR buffer to the instrument: FX 0.15–0.25, indices 0.20–0.35, metals 0.20–0.30.
• Retest ON for choppy conditions; OFF for news momentum.
• Use VWAP bands: take partials at ±1; stretch targets at ±2/±3.
• Session timezones are explicit (London/New York). Ensure they match your instrument’s behavior.
• Pair with a higher-TF bias (e.g., 1H/4H trend) for directional filtering.
⸻
Alerts (ready to use)
• ORB+SVWAP — LDN Long, LDN Short, NY Long, NY Short
(Respect your cooldown; alerts fire only after confirmation and confidence gate.)
⸻
Known limits & notes
• Designed for intraday. On 1D+ charts, session windows compress.
• If your broker session differs from London/NY clocks on a holiday, adjust input times.
• Session-anchored VWAP uses the script’s signal window, not exchange sessions, by design.

ORB + Volume FilterI created this for testing purposes only. If this script works as expected I will add a better description.

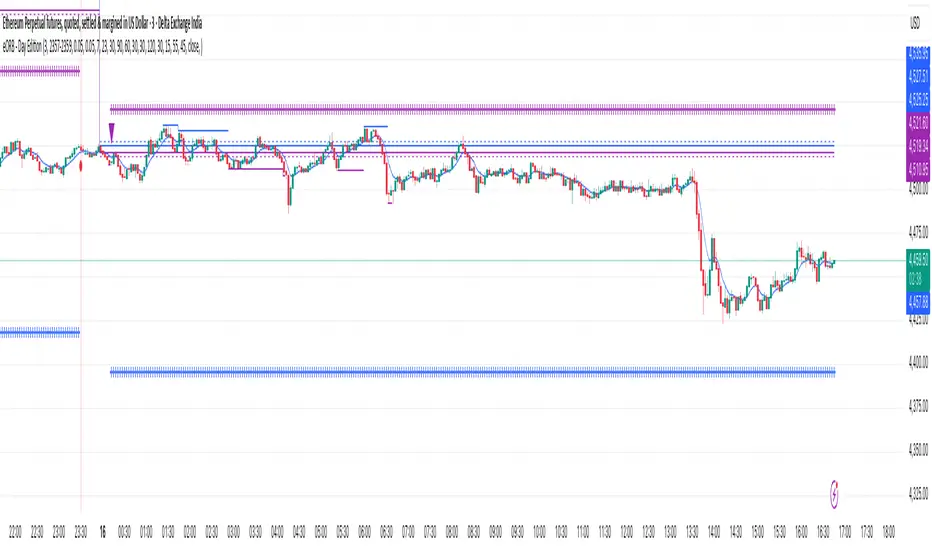
eORB - Day EditionThe eORB – Day Edition (Enhanced Opening Range Breakout) is a powerful intraday trading indicator designed for Algo Trading, Scalpers, Day Traders, and ORB-based strategies. It combines classic ORB logic with advanced filters, multiple exit strategies, and smart risk management tools. The default setup is optimised for a 3-minute ETHUSD chart.
Key Features:-
# Opening Range Breakout (ORB)
- Defines intraday high/low for the first X minutes.
- Automatically updates breakout levels.
- Optional buffer (%) for precision entries.
# Day & Session Filters
- Enable/disable trading on specific weekdays.
- Flexible session time configuration.
# EMA Crossover
- Option to trade based on EMA crossover with ORB levels.
# Breakout Candle Logic
- Detects breakout candle high/low for secondary confirmation.
# RSI Filter
- Confirms signals using RSI thresholds (customisable).
# Exit Strategies
- ORB High/Low Exit
- Buffer Exit
- Trailing Stop Loss (TSL) with activation, lock, and increments
- Target & Stoploss (fixed points)
- Universal Exit (UTC time-based) with background highlight
# Trade Sync Logic
- Prevents consecutive Buy → Buy or Sell → Sell without the opposite signal in between.
# Alerts Ready
- Buy, Sell, and Exit conditions are available for alerts.
- Compatible with TradingView alert system (popup, email, SMS, webhook).
How to Use:-
1. Add indicator to the chart.
2. Set ORB Time & Session (e.g., 3 min ORB at market open).
3. Enable/disable filters (EMA, RSI, Breakout candle).
4. Configure exits (TSL, Target, Stoploss, Universal Exit).
5. Add alerts for automation or notifications.
- This indicator is ideal for Crypto, Nifty, BankNifty, Index Futures, and Stocks, but it can be applied to any asset.
- The default settings are optimised for ETHUSD.
How it Works – eORB Day Edition:-
Step 1 – Define the Range
- At market open, the indicator records the Opening Range High & Low for the first X minutes (configurable by the user).
- This creates a price boundary (box) that acts as support and resistance for the rest of the session.
- Optional buffers can be added to make signals more reliable.
Step 2 – Generate the Signal
- When price (or EMA, if enabled) crosses above the Opening Range High, a Buy signal is generated.
- When price (or EMA) crosses below the Opening Range Low, a Sell signal is generated.
- Extra filters like RSI and Breakout Candle confirmation can be turned on to reduce false breakouts.
- Built-in sync logic ensures signals alternate properly (no double Buy or double Sell without the opposite in between).
Step 3 – Manage the Exit
- Trades can exit using multiple methods:
- Target (fixed profit in points)
- Stoploss (fixed risk in points)
- Trailing Stop-loss (TSL) that locks profit and trails as price moves further in your favour
- ORB/Buffer exit when price re-enters the range
- Universal Exit at a fixed UTC time to close all positions for the day
- Exits are visualised on the chart with shapes, labels, and optional background highlights.
In simple terms:-
Step 1: DEFINE
- Opening Range (first X minutes) → Marks High & Low → Creates breakout zone
Step 2: SIGNAL
- Price / EMA crosses High (+ Buffer) → BUY
- Price / EMA crosses Low (- Buffer) → SELL
- + Optional filters: RSI, Breakout Candle
Step 3: EXIT
- Target | Stoploss | Trailing Stoploss | Universal Exit
Important Note on Alert Setup
- When using the RSI filter, signals may fluctuate in some edge cases where RSI hovers near the Buy or Sell level.
- To avoid this, it is recommended to use “Once Per Bar Close” as the alert trigger, since signals confirm only after the bar closes (especially helpful when Breakout Candle High/Low Crossover is enabled).
- If you choose not to use RSI, you can safely use “Once Per Bar” alerts, even when the Breakout Candle High/Low Crossover option is enabled.
Disclaimer:-
- This tool is for educational and research purposes only.
- It does not guarantee profits. Always backtest and use proper risk management before live trading. The author is not responsible for financial losses.
Developer: @ikunalsingh
Built using AI + the best of human logic.
TradeX ORB SniperTradeX ORB Sniper — Multi-Range Opening Breakout Framework
This invite-only script is a structured Opening Range Breakout (ORB) tool designed to map price interaction with multiple predefined ranges. It is not a collection of generic settings — all versions and filters are coded in-house and connected through a shared logic engine.
Purpose & Core Design
The ORB Sniper provides four internally coded modes, each referencing a distinct opening range. Depending on market context, ranges may include:
Pre-market session range
5-minute opening range
15-minute opening range
Volume-adaptive range variations
Each mode ensures consistent logic across timeframes, allowing traders to analyze breakout dynamics in a rule-based framework.
Breakout Highlighting
When price closes above or below the active range, the script highlights that candle in gold/yellow (“Get Ready Candle”). This highlight is informational only, serving as a visual marker of when price has left the defined range.
Zone Projection & Box Mapping
To help visualize breakout dynamics, the script plots risk and reward boxes:
Risk Box — initial region mapped from the selected range
Reward Box — projected continuation area based on range displacement
These elements are configurable, giving traders flexibility in how the breakout context is displayed.
Custom Visual Inputs
Users can adjust all visual components directly from the settings panel:
ORB Mode — toggle between V1–V4 range types
Risk Box Color — customize the risk region’s display
Reward Box Color — adjust continuation box visuals
Get Ready Candle Color — select the breakout candle highlight color
Inputs in Status Line — optional summary display at the top of the chart
This ensures the framework is adaptable to any chart theme or personal preference.
Development Process
The ORB Sniper was first modeled in Python, where volume, volatility, and technical variations were looped through to refine range definitions. The most effective rules were then coded into Pine Script, creating a streamlined, repeatable breakout framework.
Disclaimer
This is an original, closed-source TradeX Labs tool. It references known concepts (opening ranges, volume dynamics) within a proprietary rule-based framework. It is intended for visual analysis only and does not provide trade signals or guarantee results. Default settings are for illustration; traders should adjust configuration to their instrument and timeframe.

ORB Breakouts with alerts"ORB Breakouts with Alerts" is a utility indicator that highlights an Opening Range Breakout (ORB) setup during a user-defined intraday time window. It allows traders to visualize price consolidation ranges and receive alerts when price breaks above or below the session high/low.
🔧 Features:
*Customizable session time (start and end), adjustable to local time using a timezone offset.
*Automatically plots:
*A shaded box around the session's high and low.
*Horizontal lines at session high and low levels.
*Optional "BUY"/"SELL" labels to mark breakout directions.
*Visual breakout signals when price crosses above or below the session range.
*Built-in alerts to notify when breakouts occur.
*Configurable styling options including box color, highlight color, and label placement.
⚙️ How It Works:
*During the defined time range, the script tracks the highest high and lowest low.
*After the session ends:
*A box is drawn to represent the opening range.
*Breakouts above the high or below the low trigger visual markers and optional alerts.
*Alerts are limited to one per direction per day to reduce noise.
⚠️ This indicator is a technical analysis tool only and does not provide financial advice or trade recommendations. Always use with proper risk management and in conjunction with your trading plan.

Script_Algo - ORB Strategy with Filters🔍 Core Concept: This strategy combines three powerful technical analysis tools: Range Breakout, the SuperTrend indicator, and a volume filter. Additionally, it features precise customization of the number of candles used to construct the breakout range, enabling optimized performance for specific assets.
🎯 How It Works:
The strategy defines a trading range at the beginning of the trading session based on a selected number of candles.
It waits for a breakout above the upper or below the lower boundary of this range, requiring a candle close.
It filters signals using the SuperTrend indicator for trend confirmation.
It utilizes trading volume to filter out false breakouts.
⚡ Strategy Features
📈 Entry Points:
Long: Candle close above the upper range boundary + SuperTrend confirmation
Short: Candle close below the lower range boundary + SuperTrend confirmation
🛡️ Risk Management:
Stop-Loss: Set at the opposite range boundary.
Take-Profit: Calculated based on a risk/reward ratio (3:1 by default).
Position Size: 10 contracts (configurable).
⚠️ IMPORTANT SETTINGS
🕐 Time Parameters:
Set the correct time and time zone!
❕ATTENTION: The strategy works ONLY with correct time settings! Set the time corresponding to your location and trading session.
📊 This strategy is optimized for trading TESLA stock!
Parameters are tailored to TESLA's volatility, and trading volumes are adequate for signal filtering. Trading time corresponds to the American session.
📈 If you look at the backtesting results, you can see that the strategy could potentially have generated about 70 percent profit on Tesla stock over six months on 5m timeframe. However, this does not guarantee that results will be repeated in the future; remain vigilant.
⚠️ For other assets, the following is required:
Testing and parameter optimization
Adjustment of time intervals and the number of candles forming the range
Calibration of stop-loss and take-profit levels
⚠️ Limitations and Drawbacks
🔗 Automation Constraints:
❌ Cannot be directly connected via Webhook to CFD brokers!
Additional IT solutions are required for automation, thus only manual trading based on signals is possible.
📉 Risk Management:
Do not risk more than 2-3% of your account per trade.
Test on historical data before live use.
Start with a demo account.
💪 Strategy Advantages
✅ Combined approach – multiple signal filters
✅ Clear entry and exit rules
✅ Visual signals on the chart
✅ Volume-based false breakout filtering
✅ Automatic position management
🎯 Usage Recommendations
Always test the strategy on historical data.
Start with small trading volumes.
Ensure time settings are correct.
Adapt parameters to current market volatility.
Use only for stocks – futures and Forex require adaptation.
📚 Suitable Timeframes - M1-M15
Only highly liquid stocks
🍀 I wish all subscribers good luck in trading and steady profits!
📈 May your charts move in the right direction!
⚠️ Remember: Trading involves risk. Do not invest money you cannot afford to lose!

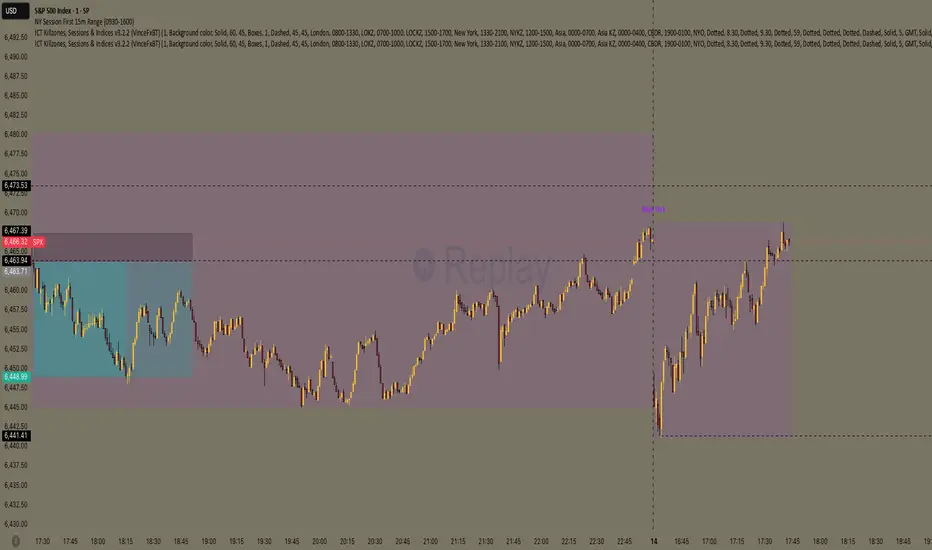
NY Session First 15m Range ORB Strategy first 15m high&low NY session
let you know the high and low of first 15m and the first candle is sitck out of the line you can ride on the wave to make moeny no bul OANDA:XAUUSD SP:SPX
Professional ORB Strategy - BUY & Sell signal- Ganesh SelvarayarORB 15 mins strategy buy and sell signal, with point system for your target

ORB Range Indicator with Fibonacci Targets
This script plots the Opening Range (ORB) high and low based on a configurable time window (5–45 minutes from the U.S. session open at 9:30 AM EST).
Once the ORB window closes, the indicator draws horizontal lines marking:
ORB High and Low
The size of the range in price and %
Fibonacci-based price targets above and below the range (0.382, 0.618, 1.000, 1.618, 2.000)
You can control:
Which Fibonacci levels to display
Whether to show long targets, short targets, or both
All drawings are automatically cleared at the start of each trading day.
Ideal for breakout traders using ORB and Fibonacci extensions for target planning.

Sniper Mini VWAPThis script plots dynamic, session-based VWAPs for key intraday timeframes:
1H (green), 4H (orange), 8H (purple), and Daily (red).
Each VWAP resets at the start of its own session, giving traders a real-time view of price relative to average volume-weighted value. These lines often act as intraday support, resistance, or liquidity magnets — great for scalping, fade setups, and sniper-style entries.
You can toggle each VWAP on or off for a cleaner chart.
This version does not use anchored VWAPs — it’s designed for traders who need fast feedback as price develops within active sessions.

DP_ORB Entry & Exit IndicatorDisclaimer:
This indicator is for educational purposes only. It does not constitute financial advice. Always do your own research and manage your risk. Also, I cannot take full credit for 'ORB' as its a well known strategy amongst many traders, but I do need to give a special shout out to @TheBigDaddyMax for putting me on to this.
DP_ORB Entry & Exit Indicator
Description:
The DP_ORB Entry & Exit Indicator is a powerful tool designed for traders who utilize the Opening Range Breakout (ORB) strategy on the NYSE session. This indicator visually identifies the initial volatility window of the trading day, by marking the 15m High, and 15m Low into a ORB Box, & then tracks breakout opportunities, and provides clear, dynamic trade management levels—all directly on your chart.
Key Features:
Automatic Opening Range (ORB) Box:
Identifies and plots the high and low of the user-defined opening range (default 9:30–9:45 NYSE) for visual reference and strategy foundation.
Breakout Entry Signals:
Automatically detects and marks long or short breakout entries when price closes above or below the ORB range, with additional momentum confirmation.
Dynamic Stop Loss:
Stop loss is intelligently set to the previous bar’s low for long trades (or high for shorts), adapting to market structure at entry.
Take Profit Targets:
Up to three fully adjustable take-profit levels are plotted, calculated as percentages from entry, supporting progressive trade management.
Visual Trade Management:
Entry, stop loss, and take profit levels are displayed as extending dashed lines from entry point to the current bar, with labels always shown just to the right of price for clarity on all timeframes.
Automatic Reset and Cleanup:
Visuals and logic reset daily and upon exit, ensuring a clean, uncluttered chart experience.
How to Use:
Set your preferred opening range time and take profit levels in the settings.
Wait for a breakout and confirmation during the NYSE session.
Use the on-chart lines and labels to manage your trade according to your risk and strategy plan.
Best For:
Day traders and scalpers seeking a disciplined, visual, and fully-automated approach to opening range breakout trading.

RTH Standard Deviation+RTH Standard Deviation+ Indicator
Overview
The RTH Standard Deviation+ (RTH SD+) indicator is a versatile tool designed for traders to visualize key price levels based on the Regular Trading Hours (RTH) session.
It calculates and displays the high, low, equilibrium (midpoint), and standard deviation-based levels derived from the RTH session's price range.
This indicator is ideal for day traders and swing traders looking to identify potential support, resistance, and breakout zones.
Features
Customizable Session Window: Define the RTH session based on your preferred time window and timezone.
Key Price Levels: Displays high, low, equilibrium, 25%/75% quartile levels, and standard deviation levels (±0.5, ±1.0, ±1.33, ±1.66, ±2.0, and optional extended levels up to ±4.0).
Visual Elements: Includes horizontal lines, labels, boxes, and vertical lines to highlight key levels and session boundaries.
Flexible Styling: Customize line styles, colors, thicknesses, and visibility for all elements.
Extended Levels: Optional display of additional standard deviation levels (±2.25, ±2.33, ±2.5, ±2.66, ±2.75, ±3.0, ±3.25, ±3.33, ±3.5, ±3.66, ±3.75, ±4.0).
Deviation Boxes: Visualize specific standard deviation ranges (±0.1, ±1.33/1.66, ±2.33/2.66, ±3.33/3.66) with customizable colors.
Inputs
Session Window: Set the RTH session time (default: 06:00–09:00).
Timezone: Select the appropriate timezone (default: UTC-4).
Label Offset: Adjust the horizontal offset for price level labels (default: 5 bars).
Line Offset: Set the length of horizontal lines extending from the session end (default: 20 bars).
Show SD Levels: Toggle visibility of standard deviation lines (±0.5, ±1.0, ±1.33, ±1.66, ±2.0).
Show SD Labels: Enable or disable labels for standard deviation levels.
Show SD Boxes: Display shaded boxes for specific standard deviation ranges (e.g., ±1.33/1.66).
Show ±0.1 Dev Boxes: Highlight smaller deviation ranges (±0.1) with boxes.
Vertical Line: Toggle a vertical line at the session end, with customizable color, style, and thickness.
High/Low, Equilibrium, 25%/75%, ±0.1 Dev, ±1.33/1.66: Toggle visibility and customize colors, styles, and thicknesses for these levels.
Extended Levels: Enable additional standard deviation levels (e.g., ±2.25, ±2.5, etc.) for advanced analysis.
How It Works
Session Tracking: The indicator identifies the user-defined RTH session based on the specified time window and timezone.
It tracks the high, low, and equilibrium (midpoint) of the session's price action.
Price Range Calculation: At the session's end, the indicator calculates the price range (high - low) and uses it to compute standard deviation levels relative to the high, low, or equilibrium.
Level Visualization:
High/Low Lines: Display the session's high and low prices as horizontal lines, extended beyond the session end.
Equilibrium Line: Shows the midpoint of the session range.
Quartile Lines: Plots 25% and 75% levels within the session range.
Standard Deviation Lines: Displays levels at ±0.5, ±1.0, ±1.33, ±1.66, and ±2.0 standard deviations, with optional extended levels up to ±4.0.
Deviation Boxes: Shaded boxes highlight specific ranges (e.g., ±1.33/1.66) for quick reference.
±0.1 Deviation Lines/Boxes: Optional smaller deviation levels for precise analysis.
Dynamic Updates: During the session, high and low lines update in real-time. At session end, all levels are finalized and extended forward for post-session analysis.
Clearing Mechanism: When a new session begins, previous drawings are cleared to avoid clutter.
Usage
Add to Chart: Apply the indicator to your TradingView chart via the Pine Editor or Indicator menu.
Configure Settings:
Adjust the session window and timezone to match your market (e.g., 09:30–16:00 UTC-4 for US equities RTH).
Customize visibility, colors, styles, and thicknesses to suit your chart preferences.
Enable extended levels for deeper analysis or disable them for simplicity.
Interpret Levels:
High/Low: Act as potential support/resistance or breakout levels.
Equilibrium: Represents the session's midpoint, often a pivot point.
25%/75% Quartiles: Indicate intermediate levels within the session range.
Standard Deviation Levels: Highlight statistically significant price zones for potential reversals or breakouts.
Boxes: Emphasize key zones for quick visual reference.
Trading Application: Use levels to identify entry/exit points, set stop-losses, or gauge market volatility.
For example, ±1.0 standard deviation levels often act as strong support/resistance, while ±2.0 levels may indicate overextension.
Notes
Ensure the session window aligns with the market’s trading hours for accurate calculations.
The indicator is designed for intraday and post-session analysis but can be adapted for other timeframes.
Use in conjunction with other technical analysis tools for comprehensive decision-making.
Extended levels (±2.25 and beyond) are disabled by default to reduce chart clutter but can be enabled for specific strategies.
TradingView House Rules Compliance
This indicator contains no copyrighted material and adheres to TradingView’s Pine Script guidelines.
This indicator was approved and created with @TIMELESS1_

15-Min ORB Indicator with Breakout Targets **What this indicator does:**
The 15-Min ORB (Opening Range Breakout) Indicator helps traders spot breakout trades by automatically detecting the high and low of the first 15 minutes after a session opens. It then monitors for breakouts above or below this range and plots dynamic take-profit levels based on your chosen multipliers.
**How it works:**
You set the start time for your session (hour and minute) in the settings.
The indicator marks the high and low during the first 15 minutes after your chosen open time, drawing lines on the chart and, if enabled, labels for these levels.
If price breaks above the 15-min high, a potential long breakout is identified; if it breaks below the low, a potential short breakout is detected.
Upon a breakout, the script calculates the distance from the entry (breakout) to the opposite side of the 15-min range and uses your input multipliers to project two take-profit levels (TP1/TP2).
All lines and labels (for the range and targets) can be individually toggled on or off in the settings.
Both the 15-min range and the targets can be styled (color, line style, label position).
**How to use it:**
Add the indicator to your chart.
Set the session start hour and minute to match your instrument’s open (e.g., 9:30 for US stocks or futures).
Use the settings to customize which levels and labels are shown, their appearance, and the target expansion multiples.
When price breaks out above or below the opening range, the script will plot TP1 and TP2 lines at your chosen risk/reward multiples, and label them if desired.
You can use the visual levels for trade entries, profit taking, or alerts.
**What makes it unique and useful:** >
Unlike many basic ORB indicators, this script not only marks the opening range but also tracks breakouts, auto-plots your profit targets based on range expansion, and gives you full control over display (styles, toggles, and label positions).
The TP targets are dynamic and can be set to any multiples, adapting to your risk/reward plan and breakout style.
Everything is customizable for your own session times, instrument, or trading approach.
**Typical uses:**
Intraday traders looking for clear breakout setups around the session open.
Automated R-multiple target planning for both long and short trades.
Visualizing volatility and measuring early price expansion.

GeeksDoByte 15m & 30m ORB + Prev Day High/LowCME_MINI:NQ1!
How It Works
Opening Ranges
At 9:30 ET, the script begins tracking the high & low.
It uses two fixed sessions:
15 min from 09:30 to 09:45
30 min from 09:30 to 10:00
On the very first bar of each session it initializes the range, then continuously updates the high/low on each new intraday bar.
Dashed lines are drawn when the session opens and extended horizontally across subsequent bars.
Previous Day’s Levels
Independently, it fetches yesterday’s high and low via a daily security call.
These historic levels are plotted as simple horizontal lines for daily context.
How to Use
Breakout Entries
A close above the 15 min ORB high can signal an early breakout; a further push above the 30 min ORB high confirms extended momentum.
Conversely, breaks below the respective lows can indicate short setups.
Support & Resistance
Yesterday’s high/low often act as magnet levels. If price is near the previous high when the opening ranges break, you get a confluence zone worth watching.
Trade Management
Combine the two opening-range levels to tier your stops or scale in.
For example, you might place an initial stop below the 15 min low and a wider stop below the 30 min low.

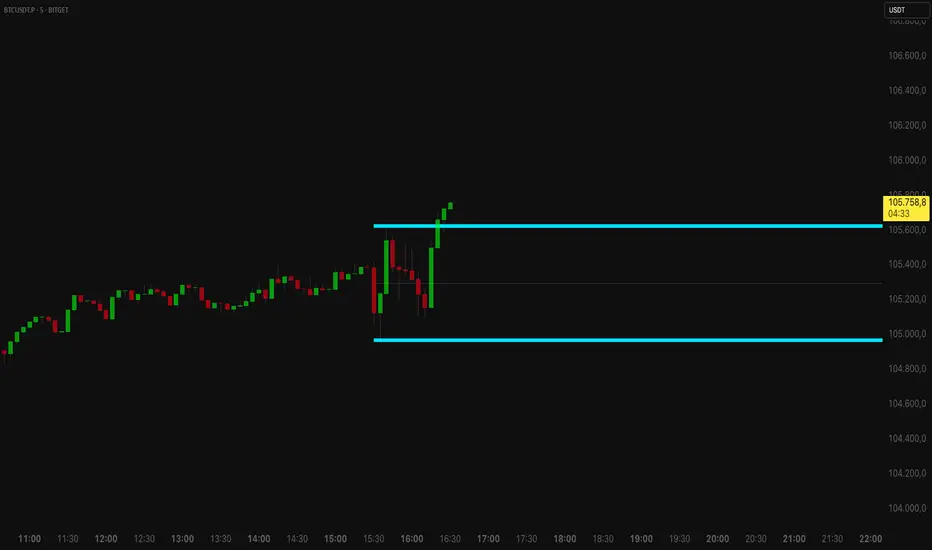
Open Range Breakout (ORB) with Alerts
🚀 ChartsAlgo – Open Range Breakout (ORB) with Alerts
The Open Range Breakout (ORB) Indicator by ChartsAlg is designed for intraday traders looking to capitalize on price movements after the market’s opening range. This tool is especially effective for futures (MNQ, MES) and high-volatility stocks or crypto where initial volatility sets the tone for the session.
This indicator identifies a user-defined opening range window, plots the high/low lines of that range, and visually alerts users when price breaks out above or below the range — with options to customize breakout repetitions, background fill, and alerts.
💡 What is an Open Range Breakout (ORB)?
The opening range represents the high and low established during the first few minutes of the trading session — usually 15 or 30 minutes. Many intraday strategies are based on the idea that breaking out of this initial range often signals strong momentum and trend continuation.
Traders often enter:
Long when price breaks above the range high.
Short when price breaks below the range low.
⚙️ How It Works
You define a session window (e.g., 09:30–09:45 EST).
The indicator tracks the high and low during this time.
Once the session ends, the high and low become your range breakout levels.
The indicator then:
Plots lines for visual clarity
Optionally fills background between the range
Triggers breakout signals if price crosses the levels
Provides alerts when breakouts occur
🛠️ Settings Breakdown
🔹 Session Settings
Range Session: Set your preferred window (e.g., 0930–0945). Can be premarket, first 30 mins, or any custom time.
Time zone: Use "America/New York" for EST (default) or change to "GMT+0" for international traders.
🔹 Breakout Settings
Bullish Breakout Signals: Number of allowed breakout alerts above the range.
Bearish Breakout Signals: Number of allowed breakout alerts below the range.
This prevents repeated alerts once breakout has been confirmed.
🔹 Display Settings
Show Background Fill: Fills area between high/low of the range for easier visual analysis.
Show Breakout Signals: Triangle markers plotted on the chart when breakouts happen.
Only Show Today’s Range: Keeps the chart clean by showing only the most current day’s range.
🔹 Color Settings
Range High/Low Line Colors: Choose any color for clarity.
Range Fill Color: Customize the highlight area for your chart style.
📊 Chart Features
Range High/Low Lines: Automatically plotted after range session ends.
Visual Fill Box: Optional background shading between the opening range.
Triangle Breakout Markers: Appear at the breakout candle.
Alerts: Can be used with TradingView’s alert system to notify you of breakouts in real-time.
🔔 Alerts
Two alert conditions are built in:
Bullish Breakout: Triggers when price breaks above the high of the range.
Bearish Breakout: Triggers when price breaks below the low of the range.
Example Alert Message:
📈 “Bullish Breakout above Open Range on AAPL!”
To activate:
Click “🔔 Alerts” on TradingView.
Set condition to this script.
Choose “ORB Breakout Up” or “ORB Breakout Down”.
Choose alert frequency and notification method.
⚠️ DISCLAIMER
ChartsAlgo tools are for informational and educational purposes only.
They are not financial advice or signals. Past performance does not guarantee future results. Use at your own risk and always implement solid risk management.
By using this indicator, you agree that you are solely responsible for any trades or decisions made based on the information provided.

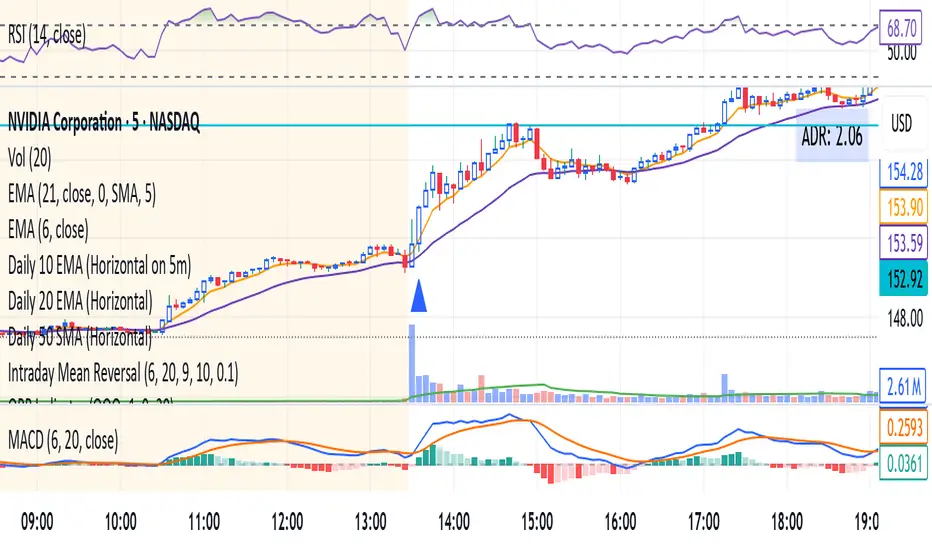
ORB IndicatorORB – Opening Range Breakout Strength (Applies to First 2 Bars Only)
The ORB (Opening Range Breakout) indicator is a momentum-based tool designed to highlight potential long trade opportunities during the first two candles of the regular trading session. It’s built to detect early strength by filtering for clean bullish price action and relative outperformance against a benchmark index.
🔍 Signal Criteria
A blue triangle is plotted at the close of the candle if the following conditions are met:
The candle is bullish (close > open)
The body makes up at least 60% of the total candle range
The candle occurs during the first or second bar after session start (default: 9:30 AM)
The candle shows greater range strength (in %) than a benchmark symbol (e.g., QQQ or SPY), scaled by a configurable multiplier
⚙️ Customizable Settings
Benchmark Ticker: Choose any symbol (default: NASDAQ:QQQ)
Range Multiplier: Adjust the strength threshold relative to the benchmark’s range
Session Start Time: Set the hour and minute to match your market’s open
📈 Features
Visual signal: blue triangle below the bar
Alert-ready: Get notified instantly when a valid ORB setup appears
Executes only at bar close to ensure confirmed signal
Simple Sessions & LevelsWhat this indicator does:
This script marks out two essential types of price levels for intraday and swing traders:
The high and low of a customizable 15-minute opening range after the market/session open.
The previous day’s high, midpoint (“halfback”), and low.
How it works:
The script lets you set the session start time (hour and minute) to match your market.
It then calculates the high and low of the first 15 minutes after the session opens and plots those as solid lines.
It also plots the prior day’s high, halfback (midpoint), and low on your chart for easy reference.
Each line and each label can be toggled on or off independently in the settings for maximum customization.
Colors for each level are also fully customizable.
How to use it:
Add the script to your chart.
Set the session start hour and minute to match the open of the market or instrument you trade.
Choose which levels and labels you want displayed by using the toggles in the settings.
The indicator will automatically draw the session range and prior day levels for you.
Use these lines as reference for key support, resistance, and potential trade entry/exit points.
What makes it unique and useful:
This tool combines a flexible session opening range with classic daily reference levels in one package. You have complete control over which levels and labels are shown, making it adaptable for any trading style. It’s especially useful for day traders who want to quickly identify volatility windows and the most important price levels from the previous session.

Opening Range Breakout (15 mins Range)Take the guesswork out of your trading with the Opening Range Breakout Pro script. This tool automatically marks the high and low of the first 15 minutes of the NYSE session, then highlights the first candle to break out above or below this range—removing ambiguity from your trade entries.
The opening range is one of the most powerful concepts in day trading. By identifying the price range set during the market’s first minutes, you gain a clear framework for your trades. When price breaks out above the range, it often signals a strong bullish move; a break below signals bearish momentum. This script visually marks these moments, so you can react quickly and confidently.
Why use Opening Range Breakout Pro?
• Defined Entry and Exit Points: The script gives you clear, objective breakout levels—no more guessing when to enter a trade.
• Removes Emotional Trading: With visual cues for breakouts, you can follow a systematic approach and avoid hesitation or FOMO.
• Backtested, Time-Tested Strategy: The opening range breakout has been used by professional traders for decades to capture early trends and maximize profit potential.
• High Reward Potential: By capitalizing on the volatility and momentum of the opening session, traders often catch the best moves of the day.
• Easy to Use: Just add to your chart—no configuration needed. The script works on any NYSE stock, on a 5-minute chart.
How it works:
• Draws the opening 15-minute high and low as orange lines.
• Labels the range prices for quick reference.
• Marks the first candle to close above the range with an orange ▲, and the first to close below with an orange ▼.
Take control of your trading day, remove uncertainty, and trade with confidence—just like the pros.

Worldwide Sessions and Open Range BreakoutThis script shows when the various normal market hours for each of the major worldwide markets (Asia, New York, and London). It also draws a line on the opening range for each of these market sessions. The opening range defaults to the first 15 minutes of the session, but this can be customized.
This script does automatically handle the session times regardless of your time zone or what time frame you are on. No need to set anything! This probably can't handle non-normal trading days, such as partial days.
This script is made for futures, but would likely work for other markets, like Forex.

15Min Opening Range & Midline (UTC+2) This TradingView script draws the 15-minute Opening Range of the day based on a user-defined start time and plots the high, low, and midline of this range. It works by capturing the high and low of the first 15 minutes of the session, and then extending them for the rest of the trading day. The midline is calculated as the average of the high and low values.
Key Features:
User-configurable start time: Define the hour and minute for when the opening range should start based on your local time zone.
Line customization: Choose the color and line style (solid, dashed, dotted) for the high, low, and midline.
Easy-to-read visual representation: The high and low lines extend across the chart from the range start, with the midline placed in the center.
Dynamic updates: The indicator resets at the start of each new trading day and updates the opening range lines accordingly.
Perfect for:
Traders looking to monitor the initial market range during the first 15 minutes of trading.
Identifying key support and resistance levels based on early price action.
Providing a midline to assess market bias and potential breakouts.
Notes:
The indicator calculates everything based on the local time zone you define and automatically adjusts to your desired start time.
It will not redraw lines; once drawn, they remain on the chart until the next session.
NY Opening Range Breakout - MA StopCore Concept
This strategy trades breakouts from the New York opening range (9:30-9:45 AM NY time) on intraday timeframes, designed for scalping and day trading.
Setup Requirements
Timeframe: Works on any timeframe under 15 minutes (1m, 2m, 3m, 5m, 10m)
Session: New York market hours
Range Period: 9:30-9:45 AM NY time (15-minute opening range)
Entry Rules
Long Entries:
Wait for a candle to close above the opening range high
Enter long on the next candle (before 12:00 PM NY time)
Must be above moving average if using MA-based take profit
Short Entries:
Wait for a candle to close below the opening range low
Enter short on the next candle (before 12:00 PM NY time)
Must be below moving average if using MA-based take profit
Risk Management
Stop Loss:
Long trades: Opening range low
Short trades: Opening range high
Take Profit Options:
Fixed Risk Reward: 1.5x the range size (customizable ratio)
Moving Average: Exit when price crosses back through MA
Both: Whichever comes first
Key Features
Trade Direction Options:
Long Only
Short Only
Both directions
Moving Average Filter:
Prevents entries that would immediately hit stop loss
Uses EMA/SMA/WMA/VWMA with customizable length
Acts as dynamic support/resistance
Time Restrictions:
No entries after 12:00 PM NY time (customizable cutoff)
One trade per direction per day
Daily reset of all variables
Visual Elements
Red/green lines showing opening range
Purple line for moving average
Entry and breakout signals with shapes
Take profit and stop loss levels plotted
Information table with current status
Strategy Logic Flow
Morning: Capture 9:30-9:45 range high/low
Wait: Monitor for breakout (previous candle close outside range)
Filter: Check MA condition if using MA-based exits
Enter: Trade on next candle after breakout
Manage: Exit at fixed TP, MA cross, or stop loss
Reset: Start fresh next trading day
This is a momentum-based breakout strategy that capitalizes on early market volatility while using the opening range as natural support/resistance levels.

Opening Range Breakout Detector📈 Opening Range Breakout Detector (TF-Independent)
Tracks breakouts with precision. No matter the chart, no matter the timeframe.
This indicator monitors whether price breaks above or below the Opening Range across multiple key durations — 1m, 5m, 10m, 15m, 30m, 45m, and 60m — using 1-minute data under the hood, while you can work on higher timeframe charts (daily, etc.).
Highlights:
✅ Status table shows which ORs broke UP or DOWN
⏱ Control which timeframes to track
🖼 Customizable table position, size and colors
Crafted by @FunkyQuokka
