NormInvTargetSeekerNormInvTargetSeeker
The NormInvTargetSeeker is a trading tool designed to aid traders in identifying and capitalizing on Distribution and Accumulation zones, highlighting specific price levels that could serve as targets for future price movements. Although the indicator itself is not multi-timeframe, an effective trading strategy might involve signal validation across multiple timeframes.
🔶 USAGE
The indicator identifies Distribution and Accumulation zones, providing potential targets for future price moves.
Traders are encouraged to use these zones as profit targets or potential reversal points.
Confluence Zones
These zones are identified as regions where various factors or levels converge, signaling an increased probability of price reaction.
They can be used to reinforce signals or identify levels where price might encounter significant resistance or support.
🔹 Trading Strategy
First, identify a signal on your primary trading timeframe.
Manually check higher timeframes to ensure the signal aligns with them.
Use the identified zones, whether Distribution or Accumulation, as target zones for your trades.
🔶 Order Blocks
The NormInvTargetSeeker identifies "Order Blocks" by examining a specified number of consecutive candles with a specific condition: the current candle must completely engulf the previous candle. This means that both the high and low of the current candle are higher and lower, respectively, than the high and low of the previous candle, signifying a dominant move in the direction of the current candle.
🔹 Trading Strategy
Target Confirmation: Order Blocks can serve to confirm target points, providing additional validation for identified levels.
Market Insight: They offer crucial insights into whether "big hands" or institutional players are positioned as buyers or sellers in the market.
Traders can use Order Blocks as a means to validate targets or key price levels, observing if the price reacts significantly upon reaching these blocks.
They can also provide insights into the general market direction or underlying market strength by identifying where the major market players are placing their orders.
🔶 SETTINGS
The indicator allows users to adjust various parameters to customize the display and logic of the tool to fit their needs.
🔹 Display Settings
Users can customize the colors and displays of various zones and labels to match their preferences.
🔶 LICENSE AND CREDITS
This work is licensed under Attribution-NonCommercial-ShareAlike 4.0 International (CC BY-NC-SA 4.0). More information here: creativecommons.org
This indicator utilizes a TypeScript implementation of the Normal Inverse function as a reference, which can be found here : github.com
Special thanks to the authors of the referenced code for providing a foundation upon which this indicator was built.
🔶 UPDATES
Current Version: 1.0.0
For future updates, please check the comment section.
🔶 CONTACT
For any questions or suggestions, please feel free to contact @RickSimpson on TradingView.
Orderblocks

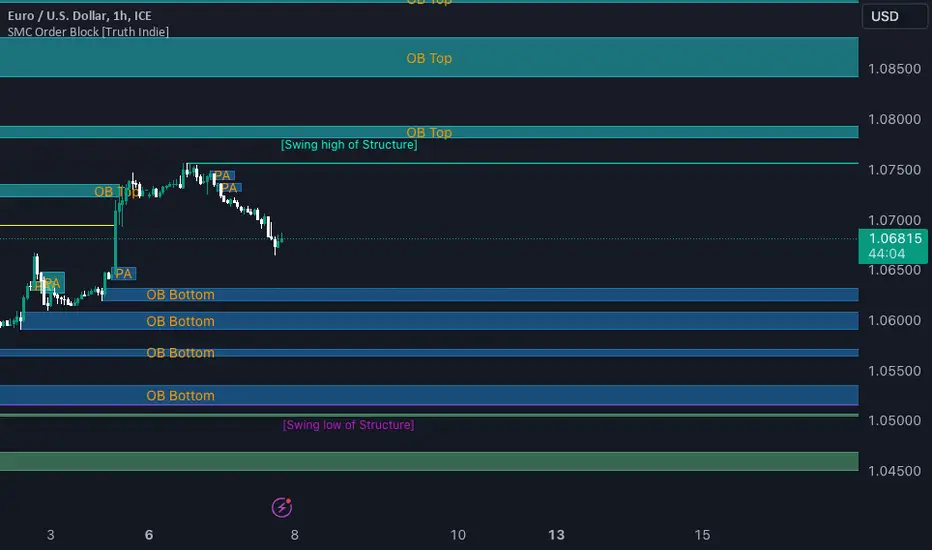
SMC Order Block [Truth Indie]Smart Money Concept (SMC)
For me, SMC is a trading philosophy that stems from those with knowledge and understanding of the structure of the Smart Money group's trading system. It is developed through the observation of price behavior.
SMC is related to the Smart Money group or those entities that can influence the market, such as financial institutions, banks, or funds. Market movements are often driven by market fundamentals or economics. The Smart Money group possesses extensive research data for analyzing the market's fundamentals and has the ability to steer the market in various directions based on market and economic fundamentals at a given time.
The SMC concept is adapted from the ICT concept, and it was developed and shared by The Inner Circle Trader.
I have been studying and trying to understand SMC for some time, and I have many questions I would like to explore. The challenge lies in the fact that different sources of knowledge on this topic often have varying teachings, and my proficiency in the English language is limited. As a result, I haven't had the opportunity to study from the primary source, The Inner Circle Trader.
This indicator was created for the purpose of researching Market Structure and Order Blocks, which are integral parts of the SMC Concept.
The fundamental principle for identifying Order Blocks is as follows:
1.Locate swings that create candlestick imbalances.
2.An imbalance refers to a candlestick that is larger than the preceding one and contains a Fair Value Gap (FVG).
This indicator categorizes Order Blocks into four types, and you are encouraged to customize them to suit your preferences.
OB Type1
1.The closing price of candle has an opposite direction to the candle .
2.Candle has a wick longer than its body, by at least 1 times or more (adjustable).
3.Candle has a wick longer than candle , by at least 2 times or more (adjustable).
4.There is a Fair Value Gap (FVG) between the wicks of candle and .
OB Type1_HTF
-This condition is the same as OB Type1, but it involves analyzing 6 candles instead. This means looking at a larger time frame, twice as big as the original one.
OB Type2
1.The closing price of candle has the opposite direction to candle .
2.Candle has a body larger than its wick by at least 1 times or more (adjustable).
3.Candle has a body larger than candle by at least 2 times or more (adjustable).
4.There is a Fair Value Gap (FVG) between the wicks of candle and .
OB Type2_HTF means observing a larger time frame, specifically twice as big as the previous one.
OB Type3
1.The closing price of candle has the same direction as candle .
2.Candle has a wick longer than its body, by at least 1 times or more (adjustable).
3.Candle has a wick longer than candle , by at least 2 times or more (adjustable).
4.There is a Fair Value Gap (FVG) between the wicks of candle and .
OB Type3_HTF means observing a larger time frame, specifically twice as big as the previous one.
OB Type4
1.The closing price of candle has the same direction as candle .
2.Candle has a body larger than its wick by at least 1 times or more (adjustable).
3.Candle has a body larger than candle by at least 2 times or more (adjustable).
4.There is a Fair Value Gap (FVG) between the wicks of candle and .
OB Type4_HTF is an indicator that involves looking at a larger time frame, specifically twice as big as the original one.
Order Block Setting
1.Click to activate the OB search in different Types.
2.Adjust the body of the candle .
3.Adjust the strength of the candle or the Imbalance candle.
4.You can change the name of OB.
5.Adjust the font size and color.
6.Adjust the color of the OB BOX and History BOX.
7.Adjust the font of OB HTF.
1.It refers to the value of W for a specific candle.
2.It refers to the value of Im for a specific candle.
3.It refers to the values of W and Im in the HTF.
4.For OB Type1 and Type3, a higher W value will search for candles with a larger wick and a smaller body. When the W value is lower, it will search for candles with a smaller wick and a larger body, moving from low to high.
5.For OB Type2 and Type4, a lower W value will search for candles with a smaller wick and a larger body. When the W value is higher, it will search for candles with a larger wick and a smaller body, moving from high to low.
Market Structure
Comprising the process of breaking the price structure, resulting in BOS (Breakout of Structure) or CHoCH (Change of Character High), and creating new High or Low based on the price structure.
1.When the market forms a price structure with High and Low, when the price moves to disrupt the structure in either direction, it will lead to BOS or CHoCH, resulting in a new High or Low. You can adjust the method of breaking the structure using the close, high, or low.
2.When you break the price structure, a High or Low will be formed on one side, and it will lead to an Inducement Swing. When the price moves and collides, it will create a price range of High and Low. You can adjust the method of breaking the structure using the close, high, or low.
3.There is an option for testing Fibonacci (Fibo). Its function is similar to the Inducement Swing. You can adjust the Fibonacci settings.
Premium & Discount Zone
1.The Premium & Discount Zone will appear based on the current price structure. It helps you see the price zones you are interested in.
2.You can adjust the %Premium & Discount as needed.
3.The OB (Order Block) will be displayed when a price structure of High and Low forms within the Premium & Discount Zone. The OB in this indicator is not a recommendation to buy or sell. You need to research and test various conditions before making trading decisions.
Everyone's trading strategies are different, and it comes down to backtesting and selecting the strategy that suits your individual needs. Hopefully, this indicator will assist the TradingView community of traders in their trading endeavors.
Order Block v1Hello Traders :)
I am Only Fibonacci.
While coding this indicator, I examined many concepts and decided to blend them.
I took the method shared by most traders and added different perspectives and options.
First of all, you can choose how many order block regions you want to see on the screen.
Note: The levels displayed on the screen are the sum of bears and bulls.
You can also choose whichever you want to see, bearish or bullish.
You can specify the precision of pivot points.
Whether you want to select a zone with a body or a zone with a wick, you can see this in the settings.
You can extend the regions infinitely with the right extension option.
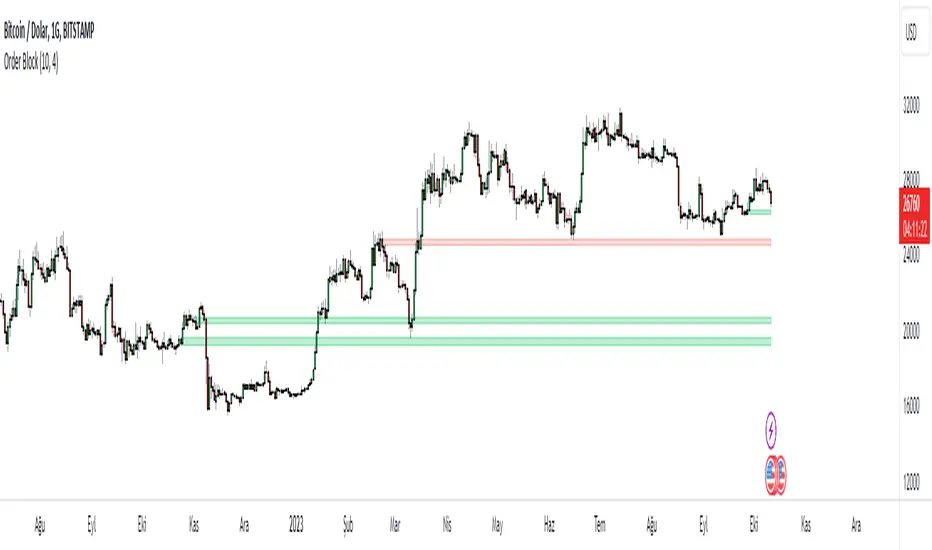
OrderBlock_TradingHubAn order block refers to a specific area on chart that represents a significant level of support or resistance where institutional traders have placed large orders. By identifying order blocks, traders can gain insights into the intentions and actions of the smart money participants.
Typically, the order block is represented by the last bullish (bearish) candle before a downtrend (uptrend) initiate. Whereas this indicator is quite different from the existing order block detection tools. It categorizes order blocks into different types (Main order blocks, Unmitigated shadow order blocks and Single candle order blocks), checking the following criteria based on TradingHUB-3 technical method:
1) Take out liquidity
2) Cause imbalance
3) Not to be inside-bar
How it works:
This indicator identifies 3 types of order blocks through the following procedure:
1) Main Order Blocks (Extreme, Decisional, and SMT(smart money trap)):
• Check that the candle is not inside bar.
• Check that the candle has taken out the liquidity beyond the previous candle's high/low.
• Check that the candle has created an imbalance (FVG) after; if not: the order block will be transferred to the first following candle that created imbalance. We check up to three following candles to find any imbalance.
2) Unmitigated Shadow Order Blocks:
• Check that the candle has taken out the liquidity beyond the previous candle's high/low.
• Check that the price has not touched the shadow so far.
3) Single Candle Order Blocks (SCOB):
• Check that the candle is not inside bar.
• Check that the candle has taken out the liquidity beyond the previous candle's high/low.
• Check confirmation:
- If the candle is closed higher/lower than the previous candle high/low, it is confirmed as a SCOB; otherwise:
- Move forward up to a specified number (determined by the user) to find a confirmation candle. A confirmation is a candle that closed higher/lower than the SCOB and its following candles high/low. The SCOB's following candles, and the confirmation candle should not take out the SCOB's liquidity again.
How to use it:
• This indicator can be used in all time frames.
• If the liquidity is taken out in an uptrend (downtrend) market structure, when the price meets the order blocks, we can go to lower timeframes and look for a trigger to enter the long (short) trade.
• It is essential for smart money traders to diagnose the market structure accurately. The "Structure_TradingHub " indicator is recommended for its ability to analyze the market structure effectively.
Indicator options:
• Show/Hide mitigated order Blocks: By this option, the user can choose whether to delete the touched order blocks or trimmed them.
• Show/Hide the unmitigated shadows. They are displayed by dashed lines.
• Show/Hide single candle order blocks: They are displayed by two lines placed above and below the candle.
• Changing the color and style of uptrend and downtrend order blocks.

World Class SMC [WinWorld]This indicator uses valid pullbacks in order to draw market structure with strict accordance to TradingHub strategy.
Features
Our indicator uses a number of price concepts, such as:
IDM
BoS & ChoCh ( also their sweeps )
Automatic resolving of ChoCh-IDM and IDM-BoS conflicts
Orderblocks (IDM, Extreme)
True Fair Value Gaps (FVG)
True PDH/PDL
SCOB pattern
One of the core features is the ability to choose a time point, from which the market structure will be drawn. This feature alone allows you to test your most desired hypotheses about the market movements within a few clicks, so no more guesses and "what if"s, because you get the opportunity to test everything yourself and right now.
Settings
Let's review the settings themselves:
Extended Structure: allows you to choose between drawing market structure for a whole timeline or from specific time point only;
Build OB by sweeps: allows you to only draw orderblocks from candle, which took liquidity from previous candle by sweep;
Structure colours & text: allows you to customise visuals representations of market structure elements on your chart;
Structure visuals: allows you to choose which elements of market structure you want / don't want to see on your chart;
Show trend: allows you to choose the way market structure trend will be displayed on your chart: divider or background colouring ;
Alerts for each and every event , whether it is a new BoS, ChoCh, orderblock and etc.
Usage Examples
IDM Orderblock ( OB-IDM )
Basic demonstration
When price reaches OB-IDM, you will be able to receive an alert. After that, check if the candle, that reached OB-IDM, closed inside or above ( bearish scenario )/ below ( bullish scenario ) OB-IDM's boundaries. If conditions above were met, go on LTF and look for an entry.
Extreme Orderblock ( OB-EXT )
Basic demonstration
Similar to OB-IDM situation: When price reaches OB-EXT, you will be able to receive an alert. After that, check if the candle, that reached OB-EXT, closed inside or above ( bearish scenario )/ below ( bullish scenario ) OB-EXT's boundaries. If conditions above were met, go on LTF and look for an entry.
Sweep PDH/PDL
Basic demonstration
* PDH — Previous Day High
* PDL — Previous Day Low
When you received PDH sweep alert and current trend is bearish, go on LTF to find entry point. ( bullish scenario: PDL sweep and current trend is bullish )
Sweep ChoCh
Basic demonstration
If you get alert of sweeped ChoCh, it usually means that price grabbed the liquidity from extremum points and is ready to continue going with the trend. Go on LTF to find an entry.

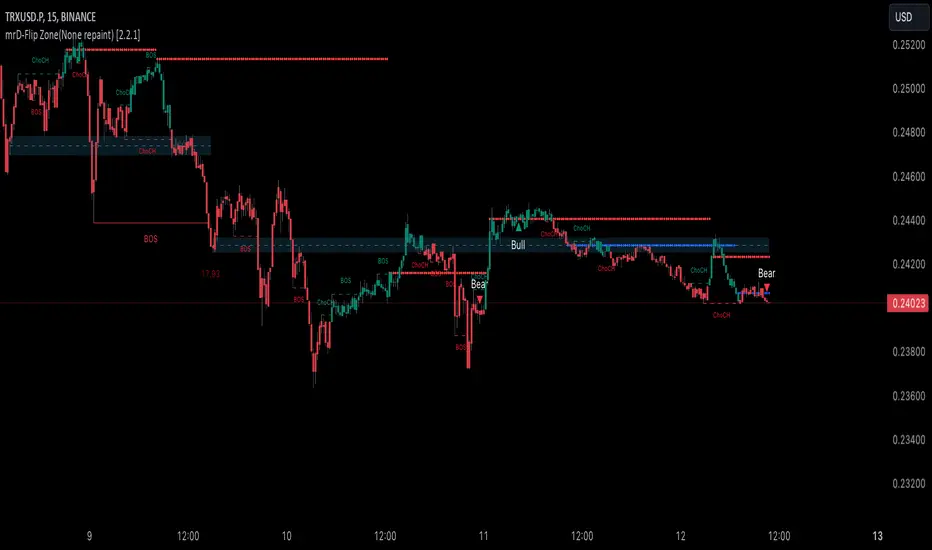
mrD-Flip Zone(None repaint) [1.0]This indicator provides Flips Zones, to easily observe price action and the user can evaluate reversal zones.
This indicator also includes warnings when flip zones appear.
🔶 SETTINGS
- Current-Timeframe: Hide/Show Flips Zones in the current time frame.
- High-Timeframe: Hide/Show Flips Zones in the High time frame.
- Current Timeframe (color): Color Display Flips Zones in the current time frame.
- High Timeframe (color): Color Display Flips Zones in the current time frame.
🔶 The logic is described below:
The main characteristic that this indicator has is that it is possible to identify zones where prices can react.
The second feature that shows the best use of this indicator is that it shows the flips area of the larger timeframe in the current timeframe.
This indicator also acts as support and resistance levels.
This script is based on the function of Pivot High Low.
- New Pivot Low is identify
- New Pivot High is to identify
- New Pivot Low lower previous Pivot Low
- Upper Line of the Flips Zone is the high-price previous Pivot Low
- Lower Line of the Flips Zone is the low-price new Pivot Low
=>Flips box will be marked on the chart in the current time frame and the Flips box in the high time frame
*Special feature: the Flips box order shows different time frames.
🔶 USAGE
The Flips Zones are displayed by the script to provide can price reversal zones.
At Flips Zones, prices can reverse or continue the trend.
The Flips Zones are displayed by the script to provide price can reversal zones.
Once the Flips Zone is formed, the price action could retest. Can expect a price reversal or continue the trend.
The Flip Zones of the higher timeframe are displayed in the current timeframe according to the user's settings.
If the Flip Zones on the current timeframe and the Flip Zones on the higher timeframe overlap, Price can retest and reverse the trend quickly.
The trend can be determined by looking at the price position relative to the flips zone box. Price breaking out of flip zones is a sign of a downtrend, while price breaking above supply is a sign of an uptrend.
Note: This indicator is Non-repaint.
This indicator is great to use in confluence with other indicators or with various candlestick patterns.
Remember, don't make decisions based only on the one-time frame. Check the overall trend of the stock and look at Flip Zone in the high time frame.
🔶General disclaimer:
Trading stocks, futures, forex, options, ETFs, cryptocurrency, or any other financial instrument has huge potential rewards and risks.
You must be aware of the risks and willing to accept them to invest in stocks, futures, forex, options, ETFs, or cryptocurrencies.
Don't trade with money you can't afford to lose.
This is not an offer or an offer to Buy/Sell stocks, futures, Forex, options, ETFs, cryptocurrencies, or any other financial instrument.
Do not represent that any account will or is likely to achieve profit or loss of any kind.
The past performance of any trading system or method is not necessarily indicative of future results.
My Scripts/Indicators/Ideas/Algos/Systems are only for educational purposes!
OrderBlock [kyleAlgo]The principle of this indicator
ATR (Average True Range) Setting: The code uses ATR to help calculate the Supertrend indicator.
Supertrend Trend Direction: Identify bullish and bearish trends with the Supertrend method.
Order Block Recognition: This part of the code recognizes and creates order blocks, visualizing them as boxes on the chart. If the number of blocks exceeds the maximum limit, old blocks will be deleted.
Function to prevent overlapping: check whether the new order block overlaps with the existing order block through the isOverlapping function.
Order block color setting: The code sets the color according to whether the block is bullish or bearish, and whether it breaks above or below. Afterwards the color of the existing order blocks will be updated.
Sensitivity settings: Through the input settings of factor and atrPeriod, the sensitivity of Supertrend and the detection of order blocks can be affected.
Visualization: Use TradingView's box.new function to draw and visualize order blocks on the chart.
Practicality:
Support and Resistance Levels: Order blocks may represent areas of support and resistance in the market. By visualizing these areas, traders can better understand when price reversals are likely to occur.
Trading Signals: Traders may be able to identify trading signals based on the color changes of blocks and price breakouts. For example, if the price breaks above a bullish block, this could be a signal to buy.
Risk Management: By using ATR to adjust the sensitivity of Supertrend, the symbol helps traders to adjust their strategies according to market volatility. This can be used as a risk management tool to help identify stop loss and take profit points.
Multi-timeframe analysis: Although the code itself does not implement multi-timeframe analysis directly, it can be done by applying this indicator on different timeframes. This helps to analyze the market from different angles.
Flexibility and Customization: Through sensitivity settings, traders can customize the indicator according to their needs and trading style.
Reduced screen clutter: By removing overlapping order blocks and limiting the maximum number of order blocks, this code helps reduce clutter on charts, allowing traders to analyze the market more clearly.
Overall, this "Pine Script" can be a powerful analytical tool for trend traders and those looking to improve their trading decisions by visualizing key market areas. It can be used alone or combined with other indicators and trading systems for enhanced functionality.

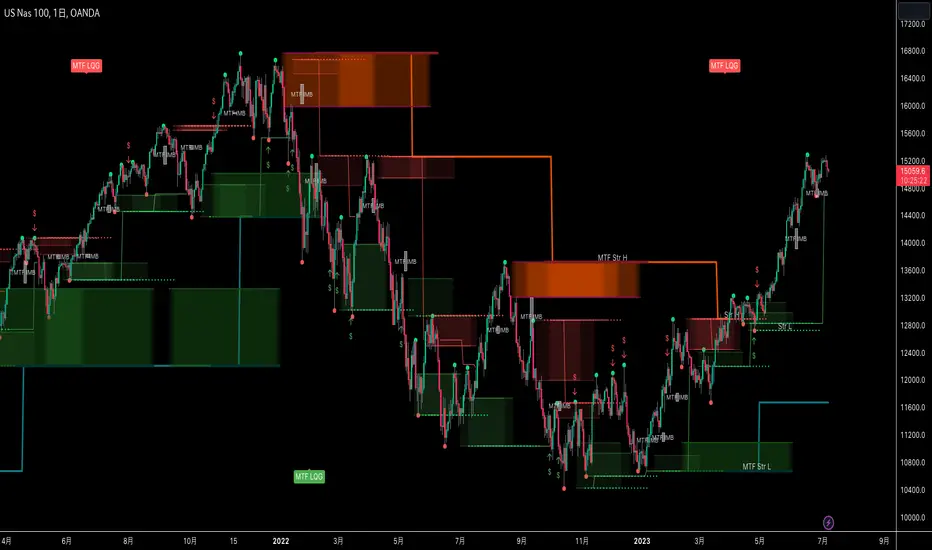
MTF Smart Money ConceptsOverview
This indicator displays major elements of Smart Money Concepts and price action trading with multi-timeframes(MTF) and layered market structures with color visualization.
What is Smart Money Concepts?
Smart Money Concepts(SMC) is one of the methodologies to interpret how financial market moves and to analyze it and execute trades, focusing on liquidity and order flow of financial institutions.
Smart money means the funds invested by large financial institutions such as banks, institutional traders/investors, market makers, hedge funds etc. contrary to retail traders/investors' money.
It is important to note that there is no proof or evidence that those institutions move the market as described in Smart Money Concepts.
Personally speaking, it is one of the interpretation of the market and another angle to view the market just like other technical analysis methodologies such as Elliott Wave Principle, Gann Theory, Wyckoff Method and even traditional price action trading.
Importance of MTF Analysis
MTF analysis(a.k.a Topdown analysis) is the foundation to technically analyze charts and the most fundamental skill in trading because lower timeframes are always influenced by upper timeframes where large financial institutions operate.
How to use
This indicator is designed to help traders analyze how the market moves in terms of SMC and price action with multi-timeframes and color visualization of the market structures, which makes this indicator unique and different from other indicators.
There is two key settings that you can use based on your trading style.
1.Upper timeframe selection
You have two options to determine upper timeframe; Auto mode and Manual mode.
When Auto mode selected, upper timeframe will be determined based on chart timeframe as follows.
Chart timeframe => Upper timeframe
1M=>15M
5M/15M=>1H
30M/1H=>4H
4H=>D
D=>W
W=>M
If you select Manual mode, you can fix an upper timeframe.
2.High/low settings
This affects all other settings of the indicator and most importantly designs the market structure.
This is the key setting to determine how you view the market as price action trading is all about highs and lows and story of how highs and lows have been created with the market structure.
You can specify left bars and right bars to identify swing highs/lows and these highs/lows become the basis to design the market structure and determine how SMC elements are displayed.
Example:
Left bar&right bar: 10
You can see bigger wave(magenta line) in the market structure(stepped line).
(Magenta line is a drawn object by manual)
Left bar&right bar: 4
With this setting, you can see smaller wave in the market structure.
Since market moves like wave as there is a lot of wave theories in financial investment/trading industry such as Elliott wave, Wolf wave etc., users can define market structure with this setting depending on what degree of wave they aim to trade.
Functions:
MTF Order Block
Concept
Order block is a block of orders where buying orders and selling orders are accumulated. Order blocks are created when the institutions move the market up and down, temporality placing orders in an opposite direction to the way they want to move, in order to match their own orders with counter-orders.
Visualization by the indicator
The indicator displays both chart timeframe's order blocks and upper timeframe's order blocks(MTF).
You can also select from two options how to display order blocks;
1. Show all order blocks
2. Show strong order blocks only
Note: Strong order blocks mean order blocks created at strong highs/lows. See also strong high/low below.
Alerts can be set when prices reach strong order blocks.
MTF Fair Value Gap(FVG)/Imbalance
Concept
Fair Value Gap(FVG)(Imbalance) is a void generated among three consecutive candlesticks.
FVG(s) is created when the market moves so rapidly generating buy side or sell side order imbalances.
FVG(s) is characterized by price action that prices tend to come back to the area where FVG(s) exists, filling in the space among the candlesticks.
Visualization by the indicator
The indicator displays both chart timeframe's FVG and upper timeframe's FVG.
MTF Liquidity Grab
Concept
Liquidity grab is price action to sweep liquidity for the institutions to move the market.
This price action often happens because the size of their orders is so huge and they need a bunch of counter-orders to match their orders. This is why prices sometimes come to areas where liquidity rest and swipe them before the market goes up/down.
Liquidity visualization
Where does liquidity rest?
The answer is above highs(buy side liquidity) and below lows(sell side liquidity).
Among all highs and lows, swing highs and lows are where liquidity is accumulated the most because swing highs and lows can be created only by the institutions, therefore massive liquidity is indicated.
Visualization by the indicator
The indicator displays liquidity dots so that users can easily identify where liquidity rests and liquidity grab of both a chart timeframe and an upper timeframe.
Alerts can be set when liquidity grab happens.
MTF Strong High/Low
Concept
Strong high/low literally means strong highs and lows among all highs and lows including swing highs and lows.
There is a few different definitions of strong high/low in price action trading and the definition in this indicator is as follows.
Strong high
A high that that breaks higher low or lower low
Strong low
A low that breaks lower high or higher high
Visualization by the indicator
The indicator displays strong highs and lows of both a chart timeframe and an upper timeframe.
MTF Market Structure Visualization
Concept
Market structure is a series of price movement with highs and lows which outlines the way the market directs. It is a basis to see trend occurrence, trend reversal and sideways and analyzing the market structures in multi-timeframes is the most fundamental technical skill in trading/investment.
Visualization by the indicator
The indicator displays market structures of both a chart timeframe and an upper timeframe and provide color visualization depending on bullish and bearish market structures.
The definition of bullish and bearish market structure is as follows.
Bullish market structure
When a price breaks a Lower High or Higher High
Bearish market structure
When a price breaks a Higher Low or Lower Low
Settings
All the functions above, colors and line settings are parameterized and can be turned on/off depending on users’ needs.
———————————————————————————
概要
Smart Money Concepts(SMC)およびプライスアクショントレードにおける重要な要素をマルチタイムフレームで表示することのできるインジケーターです。
相場構造(Market structure)をマルチタイムフレームで表示し、相場構造の強弱を色で可視化することができます。
Smart Money Concepts(スマートマネーコンセプト)とは?
Smart Money Concepts(以下SMC) は金融市場がどのように動くかを解釈し、分析し、取引を執行するための相場理論の一つであり、Liquidity(リクイディティ)および機関投資家のオーダーフロー(注文の流れ)に焦点を置いていることが特徴です。
Smart Money(スマートマネー)とは、銀行や機関投資家、マーケットメーカー、ヘッジファンドといった金融機関が動かす資金を意味し、個人投資家の資金と対をなす概念です。
重要な点は、実際に上記の金融機関がSmart Money Conceptsで語られているような相場の動かし方をしているかどうかを証明する明確なエビデンスはないということです。
個人的には、エリオット波動理論やギャン理論、ワイコフ理論、伝統的なプライスアクショントレーディングの方法論と同様に、マーケットの動きを解釈するための一つの方法論であり、マーケットの動きを別の角度から見る枠組みと捉えています。
マルチタイムフレーム(MTF)分析の重要性
MTF分析はチャートをテクニカルに分析する上での基礎であり、トレードにおいて最も重要なスキルです。なぜなら下位のタイムフレームは上記のような金融機関が資金運用を行う上位のタイムフレームの影響を常に受けるためです。
使い方
このインジケーターは、SMCまたはプライスアクショントレードの観点から、トレーダーがマーケットをマルチタイムフレームで分析することを支援するために開発しています。
相場構造(Market structure/マーケットストラクチャー)を方向性に応じて色で可視化することができるため、視覚的に相場の構造を判断できることがこのインジケータのユニークな点であり、他のインジケーターと異なる点です。
ユーザーのトレードスタイルに応じて、以下の二つの設定を行うことができます。
1.上位足の決定方法
ユーザーは上位足のタイムフレームを決定するにあたり、AutoモードとManualモードを選択することができます。
Autoモードを選択した場合、上位足はチャートのタイムフレームに応じて以下のように決定されます。
チャートタイムフレーム => 上位足タイムフレーム
1M=>15M
5M/15M=>1H
30M/1H=>4H
4H=>D
D=>W
W=>M
Manualモードを選択すると上位足のタイムフレームを固定することができます。
2.High/low(高値/安値) 設定
当設定はインジケーターの他の全ての機能に影響し、また最も重要である相場構造の定義に影響します。
当設定はユーザーがマーケットをどのように見るか(=どの程度の粒度)を決定する重要な設定です。なぜならプライスアクショントレードは、高値、安値とそれらが相場構造をどのように構築してきたかの一連の流れを分析することが全てだからです。
ユーザーは相場構造を決定付けるスイングハイ·スイングローを特定するためのバーの本数を設定することができます。ここで設定した内容が、相場構造を定義し、以下で説明するSMCの要素の表示を決定することになります。
例:
Left bar&right bar(左右のバーの数): 10
この場合、ステップラインで示した相場構造の中に大きな波(マゼンタの波)を見ることができます。
(マゼンタのラインは手動で描いたオブジェクト)
Left bar&right bar: 4
この設定では、上記に比べて小さい波を描いていることが確認できます。
相場理論の中にエリオット波動理論やウォルフ波動といった数多くの波動理論があることからわかるように、相場は波として動きます。どの粒度の波を狙うかというトレーダーのスタイルに応じて、設定を変更することができます。
機能
MTFオーダーブロック
コンセプト
オーダーブロックとは買い注文と売り注文が一連となって蓄積されたオーダー(注文)のブロックのことです。
オーダーブロックは機関投資家が相場を動かす際に、本来意図する方向とは一時的に逆に動かすことで、彼ら自身の注文をマッチングさせるための反対注文を発生させることで形成されます。
インジケーターによる表示
インジケーターはチャートタイムフレームのオーダーブロックと上位足のオーダーブロックの両方を表示することができます。
また、オーダーブロックの表示オプションとして、
1.全てのオーダーブロックを表示
2.Strong(ストロング)オーダーブロックのみを表示
を選択することが可能です。
注: StrongオーダーブロックはStrong High/Lowで形成されるオーダーブロックを指します。(下記参照)
また、オーダーブロック到達でのアラート設定も可能です。
MTFフェアーバリューギャップ(FVG)/インバランス
コンセプト
フェアーバリューギャップ(FVG)/インバランスとは連続する3つのローソク足の間に形成される溝(Gap)のことです。
フェアーバリューギャップはマーケットが非常に早く動いたことにより、買いオーダーと売りオーダーの需給バランスが崩れることによって発生します。
フェアーバリューギャップには、価格がフェアーバリューギャップが発生したエリアまで戻ってくる傾向があるという特徴が存在します。
インジケーターによる表示
インジケーターはチャートタイムフレームのフェアーバリューギャップと上位足のフェアーバリューギャップの両方を表示することができます。
MTF Liquidity Grab(リクイディティ·グラブ)
コンセプト
Liquidity(リクイディティ)とはマネー、つまり注文です。
Liquidity Grab(リクイディティ·グラブ)とは、機関投資家がマーケットを動かす際にLiquidityを取得するプライスアクションのことを指します。
このプライスアクションは、機関投資家が処理する注文サイズが非常に大きいため、自身の注文を出す際に大量の反対注文を必要とすることからしばしば発生します。
これが、価格がLiquidity(注文)の集まっているエリアに接近し、それら注文をスワイプ(狩り取る)した後に上昇·下落する理由です。
Liquidityの可視化
一般的にLiquidityは高値の上(buy side liquidity)、安値の下(sell side liquidity)に存在します。
全ての高値·安値の中で、スイングハイ·ローがliquidityが最も蓄積されているエリアということができます。なぜならスイングハイ·ローは機関投資家の注文によってのみ形成されるからです。
インジケーターによる表示
ユーザーがLiquidityポイントを簡単に識別できるようにLiquidityをドット表示することが可能です。またチャートタイムフレームと上位足の両方のLiquidity Grabを表示することができます。
Liquidity Grab発生時にアラートも設定可能です。
MTF Strong High/Low(ストロングハイ·ロー)
コンセプト
Strong high/lowは文字通り、強い高値·安値のことを指します。
トレーダーの間でいくつかの異なる定義が存在しますが、当インジケーターでの定義は以下の通りです。
Strong high
Higher low(ハイアーロー) または Lower low(ロワーロー)をブレイクした高値
Strong low
Lower higher (ロワーハイ) または Higher High(ハイアーハイ)をブレイクした安値
インジケーターによる表示
チャートタイムフレーム、上位足のStrong High/Lowを表示することが可能です。
相場構造可視化
コンセプト
相場構造(Market structure/マーケットストラクチャー)とは、相場の流れを成り立たせる高値と安値を元にした一連の値動きです。建物における骨組みに該当します。
トレンドの発生、転換、レンジを見極めるための基礎であり、マルチタイムフレームで相場構造を分析することは、投資·トレードにおいて最も重要なテクニカルスキルです。
インジケーターによる表示
チャートタイムフレームと上位足タイムフレーム両方の相場構造を表示することができます。
また、相場構造が強気の状態か弱気の状態かを色で可視化するため、上位足含めた相場の流れを視覚的に判断することが可能です。
相場構造の強弱の定義は以下の通りです。
強気の相場構造(Bullish market structure)
価格がLower HighまたはHigher Highをブレイクしたとき
弱気の相場構造(Bearish market structure)
価格がHigher LowまたはLower Lowをブレイクしたとき
設定
上記の全ての機能は色やライン設定含めパラメーターで設定が可能です。またユーザの必要に応じて表示·非表示を切り替えることができます。
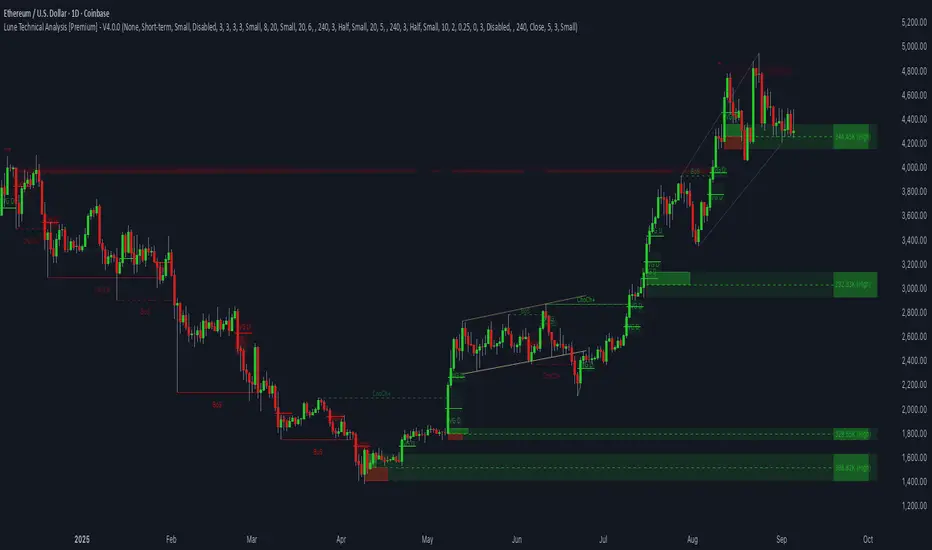
Lune Technical Analysis Premium⬛️ Overview
Lune Technical Analysis is a state-of-the-art TradingView indicator, meticulously designed to provide real-time market insights. Distinguished by its non-repainting features that operate in real-time, this tool brings enhanced accuracy and timeliness to your market analysis.
🟦 Features
Lune Technical Analysis equips traders with an array of innovative features:
🔹 Candle Coloring: The Candle Coloring feature introduces an innovative approach to visualizing market sentiment by coloring chart candles. It is devised to streamline your market analysis, offering a readily digestible snapshot of market trends. For example, if you aim to gauge the predominant market sentiment promptly, enable this feature for instant candle color-coding in accordance with prevailing bullish or bearish market structures. Though it currently supports only Market Structure-based Candle Coloring, its settings can be manipulated for enabling or disabling this feature. This feature operates by applying predefined algorithms that interpret market sentiment, coloring the candles accordingly.
🔹 Chart Pattern Detection: This sophisticated tool automatically detects and illustrates common chart patterns on your chart, simplifying the process of pattern identification. It identifies a range of patterns such as Head & Shoulders, Inverted Head & Shoulders, Ascending/Descending Wedges, Broadening Wedges, various Triangles, and Double Tops/Bottoms, enhancing your confluence detection in the market. For example, upon detecting a Double Top pattern, you could anticipate a potential price reversal due to this bearish signal. The sensitivity of this tool can be customized according to your trading style, with lower settings for short-term changes and higher for long-term. This feature leverages predefined formulas and price action analysis to identify these patterns.
🔹 Trendlines: With the Automatic Trendline Drawing tool, your technical analysis becomes significantly more efficient and precise. This feature is engineered to identify upward and downward Trendlines, aiding in locating potential pivots, and market support/resistance. For instance, if the price consistently rebounds off a Trendline, it may continue to do so, serving as a support/resistance level. However, a break through the Trendline could signal potential volatility and trend change. This feature's sensitivity to price changes can be adjusted to either short or long-term. It works by tracing Trendlines based on price action and wick formations to detect potential pivots.
🔹 Liquidity Bubbles: Liquidity Bubbles is an advanced tool that pinpoints key liquidity areas and large positions in real-time. This feature significantly contributes to effective trading strategy formulation by highlighting potential entry and exit points. It operates in real-time, ensuring zero repaint or lag, and supports two modes: Enhanced Bubbles and Basic Bubbles. For instance, the detection of multiple bullish Liquidity Bubbles during a ranging market could suggest an upward price movement due to dominant bullish volume. This feature's settings include thresholds for insignificant bubble filtering and a mode selection feature. Liquidity Bubbles operates by applying a proprietary formula to volume data, determining general volume direction and potential positions.
🔹 Market Structure: The Market Structure tool identifies key market structures such as Break of Structures (BoS) and Change of Character (ChoCh), thereby enhancing your ability to read market trends and sentiment. This smart money concept gives you a unique insight into short-term and long-term market trends. For instance, the appearance of a bullish Break of Structure and Change of Character after a predominantly bearish market sentiment could suggest a new bullish trend. This feature allows users to select which Market Structures to display and calculates these structures based on the market's high and low points.
🔹 Order Blocks: Order Blocks provide a visual representation of areas where large market participants are likely to place orders. These zones, where significant buying or selling activity has occurred in the past, offer insightful data for future price movements. The Order Blocks feature operates in real-time, providing real-time Order Blocks without any lag. For instance, if the price enters a large Order Block with predominantly bullish volume, an upward price movement can be anticipated. However, if the price breaks through the block, it could suggest the block's invalidation and a likely continued price fall. You can configure the settings to enable an additional Order Block, customize timeframes, overlap functions, and apply a quality filter. This feature calculates Order Blocks using the volume and candle size data.
🔹 Supply/Demand Zones: This real-time tool identifies crucial supply and demand zones, revealing potential price reaction points. These zones, where supply (selling pressure) and demand (buying pressure) have historically impacted price significantly, provide traders with insights into potential areas of strong support (demand) and resistance (supply). For example, if the price enters a large supply zone, a price rejection could be anticipated due to historical selling pressure at this zone. The settings enable users to add an additional Supply/Demand Zone, customize the timeframe, and apply a quality filter. This feature identifies common Supply/Demand Zones patterns based on volume and the size of the zone and displays them on the chart.
🔹 Fair Value Gaps: The Fair Value Gaps tool is designed to identify potential price correction zones or "gaps". These areas, where the market price sharply deviated from the fair value, suggest potential price adjustments in the future. For instance, the formation of a bullish Fair Value Gap could indicate a future price drop to fill this gap, potentially followed by an upward movement if the gap was of fair value. The settings allow users to enable additional Fair Value Gaps, customize the timeframe, and apply a quality filter. This feature measures large market gaps based on the size of the gap and its volume.
These features and tools collectively offer a comprehensive solution for traders to understand and navigate the financial markets. It's important to remember that they are designed to assist in making informed trading decisions and should be used as part of a balanced trading strategy.
🟧 Usage
Lune Technical Analysis's unique feature set can be leveraged both individually and synergistically. It is important to understand each feature and experiment with different configurations to best suit your unique trading needs.
🔸 Example #1: The following example demonstrates how the Order Block and Liquidity Bubbles feature can be used together to enhance your market analysis.
Order Blocks work in real-time to identify key order zones based on price action. These zones are often crucial for predicting price fluctuations. Meanwhile, Liquidity Bubbles act as real-time visual cues that detect significant market positions, facilitating an understanding of market accumulation, distribution, and trapped positions.
In this instance, at point 1, a bearish Basic and Enhanced Liquidity Bubble is visible within a crucial Order Block. The combination of these indicators augments the bearish sentiment, leading to a potential price decrease. Similarly, at point 2, the conjunction of two bullish Basic Liquidity Bubbles within an Order Block strengthens the bullish sentiment, culminating in a subsequent price increase.
🔸 Example #2: The following example demonstrates how Supply and Demand Zones can be used to detect strong and quality supports and resistance.
Supply and Demand Zones operate in real-time, detecting crucial zones based on price action and volume. This feature is invaluable for predicting potential price reaction points.
At point 1, the price enters a Supply Zone, a historical hotspot for selling activity, which usually leads to a price rejection and consequent decrease. At point 2, a Demand Zone indicating a bullish sentiment suggests a potential reversal when the price touches this level.
🔸 Example #3: The following example demonstrates how the Chart Pattern Detection feature is able to detect chart patterns to help enhance your trades.
Chart Pattern Detection employs formulas and price action analysis to identify common chart patterns as they form. Here, it successfully detects a 'Head and Shoulders' pattern, a conventionally bearish pattern, indicating a potential price drop.
🟥 Conclusion
Lune Technical Analysis stands as an exceptional blend of real-time insights into market activity. Its real-time, non-repainting features offer traders a more precise and timely approach to market analysis, promoting improved decision making in ever-changing market conditions.
🔻 Access
You can see the Author's instructions below to get instant access to this indicator & our Premium Suite.
🔻 Disclaimer
Lune Technical Analysis is a tool for aiding in market analysis and is not a guarantee of future market performance or individual trading success. We strongly recommend that users combine our tool with their trading strategies and do their due diligence before making any trading decisions.
Remember, past performance is not indicative of future results. Please trade responsibly.
Volume Profile Bar-Magnified Order Blocks [MyTradingCoder]Introducing "Volume Profile Bar-Magnified Order Blocks", an innovative and unique trading indicator designed to provide traders with a comprehensive understanding of market dynamics. This tool takes the concept of identifying order blocks on your chart and elevates it by integrating a detailed volume profile within each order block zone.
Unlike standard order block indicators, Volume Profile Bar-Magnified Order Blocks pulls data from lower timeframe bars and assigns it to various segments of the order block. By providing this volume profile inside the order block, the indicator supplies a deeper, multi-dimensional view of market activity that can enhance your trading decisions.
Crucially, users have the ability to fine-tune the detection of order blocks. This is made possible through a single input setting called "Tuning". This integer value allows you to control the significance and frequency of the order blocks. Higher numbers will produce more significant order blocks, though they will appear less frequently. Lower numbers, on the other hand, will yield less significant order blocks, but they will occur more often. This enables you to adjust the sensitivity of the indicator according to your specific trading strategy and style.
Key Settings:
Number of Segments: Customize the level of detail in your volume profile by selecting the number of segments you want inside each order block.
Tuning: Adjust the sensitivity of order block detection to align with your trading strategy. Higher values produce more significant but less frequent order blocks, while lower values yield less significant but more frequent order blocks.
Color Inputs: Personalize the look of your chart by selecting the colors for various elements of the indicator. This ensures a seamless integration with your current chart aesthetics and improves visual clarity.
Here is a s creenshot that beautifully demonstrates the power of this indicator. You'll see how the price rejects perfectly off the highest volume segment in an order block, showcasing the indicator's potential for pinpointing high-impact price levels.
While Volume Profile Bar-Magnified Order Blocks offers many unique features, it should be used in conjunction with other indicators and forms of analysis for a complete trading strategy. As with all tools, it does not guarantee profitable trades but is intended to give traders more information to base their decisions on. Use it to complement your existing analysis and enhance your understanding of market behavior.
Experience a new level of clarity in your trading with Volume Profile Bar-Magnified Order Blocks - an indicator that goes beyond the surface to help you navigate the markets more effectively.

Volume Tick Analysis and Order Blocks [Tcs] | ALGOThe indicator has been developed to provide the most complete vision possible of liquidity areas, highly traded past price levels, and how volume tick analysis affects price action.
It helps to draw on all the areas that generate a price move, or market inefficiency.
The indicator has different features:
- ORDER BLOCKS : The indicator draws different kinds of order blocks on the chart.
• Real valuable order blocks - where the price reaction is more probable. It's define by a calculation of the quantity tick volume exchanged between bulls and bears on a price level, which can create a candle event, such as engulfing candles. For this motivation the order blocks plotted will be a real valuable area.
The threshold can be adjusted based on the strategy's needs, in particular this set up has been added to adapt the strategy on different kind of asset. For Cryptocurrency for example the best threshold are between 0.5 and 1. The lower the value, the fewer order blocks will be plotted, but they will be more valuable. It's possible to show the volume exchanged, the percentage, and who controlled the valuable area, bulls or bears, on these order blocks.
For a better visualization, the order block will change color (more transparent) after it will be violated for the first time, and it will be deleted once the price will break trough it.
All order blocks can be extend
GENERAL OB VISUALIZATION
EXAMPLE OF TRADES ON OB
It's also possible to plot the footprint of past and invalidated order blocks on the chart, which can help to draw lines for future valuable areas.
• Secondary order blocks are less valuable order blocks where the probability of a price reaction is less. Usually, they work for small retracements and are more useful for scalpers. the concept is the same as Primary order blocks but without a too restricted calculation of tick volume exchanged
• LIQUIDITY GRABS: Liquidity grabs are plotted on candles that try to invalidate an order block, but high volumes move them to the opposite direction. They happen when opposite players try to move the market in the opposite direction. They are calculated only on primary order blocks.
A good entry usually is when a liquidity grab appear, the price come in the liquidity grab area to fry liquidity and price close again in the liquidity grab area.
• VOLUME VSA: All candles with high and above-average volume are plotted on the chart for both bull and bear volume. It highlights more than average volume, high volume, and extreme volume with different colors. This can help to spot good entries or detect beginning/end of a trend. For example abnormal high volume at the end of a big price movement, in the same direction, can define the end of a trend. If same situation of abnormal high volume, but in the opposite direction of the trend, could define the beginning of a market inversion.
• FAIR VALUE GAPS: It highlights all the inefficiencies of market moves, which can be used as retracement or price return areas. Here, they can be adjusted based on how effective they are adjusting the volume threshold. Bulls and bears FVG are defined in different colors. More effective FVG are plotted in less transparent colors, and you will find three levels of effectiveness.
Both OB and FVG will change color once the price retraces on them, and they will be removed when they are invalidated.
Please note that this indicator is for educational purposes only and should not be used for trading without further testing and analysis.

Market Dynamics Pro [ChartPrime]ChartPrime Market Dynamics Pro is designed to cater to those traders who are more interested in market structures, price action and fundermentals. Analysing volume, key levels in the market, market phases and multi-timeframe can help a trader build a clearer and more actionable view of the market. ChartPrime performs analysis on data in a unique way therefore attempting to give insights into the market otherwise unseen.
Major Features:
Order blocks: The ChartPrime order blocks provide sleek and clear levels in the market where the price might find support and resistance. It is important to note this data isn't availible currently therefore these are derived from data outside of order books. Order blocks are segmented into 4 sections reflecting the volume at a given levels. Low, Medium, High and very high based on relevant and dynamic averages. This allows a trader to identify how significant a level is in the market in a simpler method. Bearish order blocks have a red color bias and bullish order blocks have a green color bias allowing a trader to identify what type of order block it is. The order blocks also dynamically show the remaining volume at that given level.
Pattern Detection: ChartPrime leverages unique pattern identification methods providing earlier and cleaner chart formations. Patterns are commonly used in trading to assess whether bulls or bears are performing optimally in a market or losing strength. ChartPrime identifies; Ascending wedges, descending wedges, symmetrical Triangles, H&S, iH&S, broadening wedges and double tops/bottoms. Patterns often have associated theory behind them for entries and targets that we suggest a trader covers before using this feature. ChartPrime also allow for the user to adjust where a pattern is drawn from. In pattern theory there are 2 main approaches to drawing a formation; from candle body and candle wick. ChartPrime allows for this to be adjusted by a user and also allow for alerts to be set on these patterns.
MTF SR: Taking into account multi timeframes when trading is a key idea. Having ideas of the larger market moves can provide deeper context when trading. ChartPrime Market Dynamics Pro allows for 3 varying SR plots from 3 varying user desired timeframes. These are graded via pivot analysis and grid analysis. This rank is on a 1-10 scale with 1 being the highest rank and 10 is the lowest.
Market Stucutures : These labels are commonly found and used by the Smart Money community. They denote a break of stucture and a chance of character. BOS are labelled when the price breaks a lower low or higher high (in the trending markets) and a CoC occurs when price breaks a trending market pivot. These break a market into clearer breakouts of price action and can help a trader deduce relevant moves. The indicator allows for the user to adjust the detection length of these structures.
Premium and Discount Zones: Premium and Discount zones are underpinned by a simple piece of logic. A premium zone is taken from a higher swing point and the discount from a lower swing point. Although a very generic approach this can show areas in the market that could see a reaction. An asset being in a discount zone implies the price is undervalued. An asset being in a premium zone implies the asset is overpriced or overextended. These are excellent when used in confluence with other SR methods. These naturally will have a delay as they are derived from swing points in a market but still are extremely relevant levels.
Fair Value Gaps: These are gaps in the market where price has seen a highly volatile move and they are assumed to act as magnets in the market. The price may come back and visit these 'gaps' after the move has occured. These are a common technique now used by traders and added to this toolkit for convinience.
Settings:
Order Blocks: Select the scale of the order blocks displayed
BoS/CoC: Toggle these on/off and adjust the lookback on these market structures
Premium/Discount Zones: Toggle on/off and adjust lookback
Enable FVG: Toggle on/off FVGs
Swing Levels: Enable basic swing levels in market
MTF Support/Resistance: Enable and select the relevant timeframe to obtain MTF SR levels on your chart. Up to 3 timeframes at a time.
Predictive Ranges: Toggle on/off
Trend Lines Detection: Toggle on/off trendlines
Wedge Detection: Adjust how patterns are detected; whether from wick or candle body
Toggles provided for relevant patterns.
Example usecases:
ChartPrime order blocks give a deeper insight into market support and resistance levels. Looking for order blocks labelled with High can indicate this level being a significant support or resistance in the market. Adding in further confluences here can assist further in deciding where the price may see a reaction. Take the screenshot below:
Adding in confluences from other timeframes can also help give a broader view. Using the multi time frame graded frame support and resistance levels we can use these to further assist us in finding significant levels in the market.
ChartPrime also provides breaker blocks. These are still significant levels in the market despite being "broken" prior. These too can be used in a classical manor and act as relevant areas in the market. These are particularly effective when used in confluence with Premium and discount zones. We can see in the example below price sees a strong reaction and bounces at these levels.
Market Dynamics Pro provides a comprehensive toolkit of unique features and mixes in the classical concepts allowing for a cleaner charting experience.
All content and indicators provided by ChartPrime are purely for informational & educational purposes only. Past performance does not guarantee future results.
Script a pagamento

SME Backtesting [TFO]This strategy script is an extension of my Smart Money Essentials (SME) indicator and aims to provide a simplified means of backtesting complex trade models that incorporate a variety of Smart Money Concepts.
Among other things, Smart Money Essentials contains logic for:
- Market structure
- Fair Value Gaps
- Order Blocks
- Breaker Blocks
- Optimal Trade Entries
- HTF Market Structure
The Confluence section can then be utilized to build and test trade models from any combination of the included factors. As a basic example, we could test a strategy that only utilizes market structure. With Manual Exit turned off, we would simply be flipping long on bullish market structure shifts, and reversing short on bearish market structure shifts for the duration of the user-defined session.
As one might expect, such a simple strategy isn't expected to produce very reliable results by itself. However, we could build on these ideas by adding extra layers of Confluence, like looking for entries where Market Structure aligns with Order Block interactions. We could also turn on Manual Exit with a 40 tick stop loss and 80 tick profit target (10 points and 20 points, respectively, for ES futures), for more defined exit criteria.
One could expand on these ideas by adding factors like Fair Value Gaps, HTF Market Structure, etc. Any of the core pieces of SME can be used to build and backtest strategies that would otherwise be extremely tedious to do by hand, and as the SME indicator grows, so too will this backtesting script. Ultimately, the purpose of this is to make Smart Money Concepts more objective and easily testable so that users may better understand where these concepts may perform best.

ICT Concepts [LuxAlgo]The ICT Concepts indicator regroups core concepts highlighted by trader and educator "The Inner Circle Trader" (ICT) into an all-in-one toolkit. Features include Market Structure (MSS & BOS), Order Blocks, Imbalances, Buyside/Sellside Liquidity, Displacements, ICT Killzones, and New Week/Day Opening Gaps.
🔶 SETTINGS
🔹 Mode
When Present is selected, only data of the latest 500 bars are used/visualized, except for NWOG/NDOG
🔹 Market Structure
Enable/disable Market Structure.
Length: will set the lookback period/sensitivity.
In Present Mode only the latest Market Structure trend will be shown, while in Historical Mode, previous trends will be shown as well:
You can toggle MSS/BOS separately and change the colors:
🔹 Displacement
Enable/disable Displacement.
🔹 Volume Imbalance
Enable/disable Volume Imbalance.
# Visible VI's: sets the amount of visible Volume Imbalances (max 100), color setting is placed at the side.
🔹 Order Blocks
Enable/disable Order Blocks.
Swing Lookback: Lookback period used for the detection of the swing points used to create order blocks.
Show Last Bullish OB: Number of the most recent bullish order/breaker blocks to display on the chart.
Show Last Bearish OB: Number of the most recent bearish order/breaker blocks to display on the chart.
Color settings.
Show Historical Polarity Changes: Allows users to see labels indicating where a swing high/low previously occurred within a breaker block.
Use Candle Body: Allows users to use candle bodies as order block areas instead of the full candle range.
Change in Order Blocks style:
🔹 Liquidity
Enable/disable Liquidity.
Margin: sets the sensitivity, 2 points are fairly equal when:
'point 1' < 'point 2' + (10 bar Average True Range / (10 / margin)) and
'point 1' > 'point 2' - (10 bar Average True Range / (10 / margin))
# Visible Liq. boxes: sets the amount of visible Liquidity boxes (max 50), this amount is for Sellside and Buyside boxes separately.
Colour settings.
Change in Liquidity style:
🔹 Fair Value Gaps
Enable/disable FVG's.
Balance Price Range: this is the overlap of latest bullish and bearish Fair Value Gaps.
By disabling Balance Price Range only FVGs will be shown.
Options: Choose whether you wish to see FVG or Implied Fair Value Gaps (this will impact Balance Price Range as well)
# Visible FVG's: sets the amount of visible FVG's (max 20, in the same direction).
Color settings.
Change in FVG style:
🔹 NWOG/NDOG
Enable/disable NWOG; color settings; amount of NWOG shown (max 50).
Enable/disable NDOG ; color settings; amount of NDOG shown (max 50).
🔹 Fibonacci
This tool connects the 2 most recent bullish/bearish (if applicable) features of your choice, provided they are enabled.
3 examples (FVG, BPR, OB):
Extend lines -> Enabled (example OB):
🔹 Killzones
Enable/disable all or the ones you need.
Time settings are coded in the corresponding time zones.
🔶 USAGE
By default, the indicator displays each feature relevant to the most recent price variations in order to avoid clutter on the chart & to provide a very similar experience to how a user would contruct ICT Concepts by hand.
Users can use the historical mode in the settings to see historical market structure/imbalances. The ICT Concepts indicator has various use cases, below we outline many examples of how a trader could find usage of the features together.
In the above image we can see price took out Sellside liquidity, filled two bearish FVGs, a market structure shift, which then led to a clean retest of a bullish FVG as a clean setup to target the order block above.
Price then fills the OB which creates a breaker level as seen in yellow.
Broken OBs can be useful for a trader using the ICT Concepts indicator as it marks a level where orders have now been filled, indicating a solidified level that has proved itself as an area of liquidity. In the image above we can see a trade setup using a broken bearish OB as a potential entry level.
We can see the New Week Opening Gap (NWOG) above was an optimal level to target considering price may tend to fill / react off of these levels according to ICT.
In the next image above, we have another example of various use cases where the ICT Concepts indicator hypothetically allow traders to find key levels & find optimal entry points using market structure.
In the image above we can see a bearish Market Structure Shift (MSS) is confirmed, indicating a potential trade setup for targeting the Balanced Price Range imbalance (BPR) below with a stop loss above the buyside liquidity.
Although what we are demonstrating here is a hindsight example, it shows the potential usage this toolkit gives you for creating trading plans based on ICT Concepts.
Same chart but playing out the history further we can see directly after price came down to the Sellside liquidity & swept below it...
Then by enabling IFVGs in the settings, we can see the IFVG retests alongside the Sellside & Buyside liquidity acting in confluence.
Which allows us to see a great bullish structure in the market with various key levels for potential entries.
Here we can see a potential bullish setup as price has taken out a previous Sellside liquidity zone and is now retesting a NWOG + Volume Imbalance.
Users also have the option to display Fibonacci retracements based on market structure, order blocks, and imbalance areas, which can help place limit/stop orders more effectively as well as finding optimal points of interest beyond what the primary ICT Concepts features can generate for a trader.
In the above image we can see the Fibonacci extension was selected to be based on the NWOG giving us some upside levels above the buyside liquidity.
🔶 DETAILS
Each feature within the ICT Concepts indicator is described in the sub sections below.
🔹 Market Structure
Market structure labels are constructed from price breaking a prior swing point. This allows a user to determine the current market trend based on the price action.
There are two types of Market Structure labels included:
Market Structure Shift (MSS)
Break Of Structure (BOS)
A MSS occurs when price breaks a swing low in an uptrend or a swing high in a downtrend, highlighting a potential reversal. This is often labeled as "CHoCH", but ICT specifies it as MSS.
On the other hand, BOS labels occur when price breaks a swing high in an uptrend or a swing low in a downtrend. The occurrence of these particular swing points is caused by retracements (inducements) that highlights liquidity hunting in lower timeframes.
🔹 Order Blocks
More significant market participants (institutions) with the ability of placing large orders in the market will generally place a sequence of individual trades spread out in time. This is referred as executing what is called a "meta-order".
Order blocks highlight the area where potential meta-orders are executed. Bullish order blocks are located near local bottoms in an uptrend while bearish order blocks are located near local tops in a downtrend.
When price mitigates (breaks out) an order block, a breaker block is confirmed. We can eventually expect price to trade back to this breaker block offering a new trade opportunity.
🔹 Buyside & Sellside Liquidity
Buyside / Sellside liquidity levels highlight price levels where market participants might place limit/stop orders.
Buyside liquidity levels will regroup the stoploss orders of short traders as well as limit orders of long traders, while Sellside liquidity levels will regroup the stoploss orders of long traders as well as limit orders of short traders.
These levels can play different roles. More informed market participants might view these levels as source of liquidity, and once liquidity over a specific level is reduced it will be found in another area.
🔹 Imbalances
Imbalances highlight disparities between the bid/ask, these can also be defined as inefficiencies, which would suggest that not all available information is reflected by the price and would as such provide potential trading opportunities.
It is common for price to "rebalance" and seek to come back to a previous imbalance area.
ICT highlights multiple imbalance formations:
Fair Value Gaps: A three candle formation where the candle shadows adjacent to the central candle do not overlap, this highlights a gap area.
Implied Fair Value Gaps: Unlike the fair value gap the implied fair value gap has candle shadows adjacent to the central candle overlapping. The gap area is constructed from the average between the respective shadow and the nearest extremity of their candle body.
Balanced Price Range: Balanced price ranges occur when a fair value gap overlaps a previous fair value gap, with the overlapping area resulting in the imbalance area.
Volume Imbalance: Volume imbalances highlight gaps between the opening price and closing price with existing trading activity (the low/high overlap the previous high/low).
Opening Gap: Unlike volume imbalances opening gaps highlight areas with no trading activity. The low/high does not reach previous high/low, highlighting a "void" area.
🔹 Displacement
Displacements are scenarios where price forms successive candles of the same sentiment (bullish/bearish) with large bodies and short shadows.
These can more technically be identified by positive auto correlation (a close to open change is more likely to be followed by a change of the same sign) as well as volatility clustering (large changes are followed by large changes).
Displacements can be the cause for the formation of imbalances as well as market structure, these can be caused by the full execution of a meta order.
🔹 Kill Zones
Killzones represent different time intervals that aims at offering optimal trade entries. Killzones include:
- New York Killzone (7:9 ET)
- London Open Killzone (2:5 ET)
- London Close Killzone (10:12 ET)
- Asian Killzone (20:00 ET)
🔶 Conclusion & Supplementary Material
This script aims to emulate how a trader would draw each of the covered features on their chart in the most precise representation to how it's actually taught by ICT directly.
There are many parallels between ICT Concepts and Smart Money Concepts that we released in 2022 which has a more general & simpler usage:
ICT Concepts, however, is more specifically aligned toward the community's interpretation of how to analyze price 'based on ICT', rather than displaying features to have a more classic interpretation for a technical analyst.

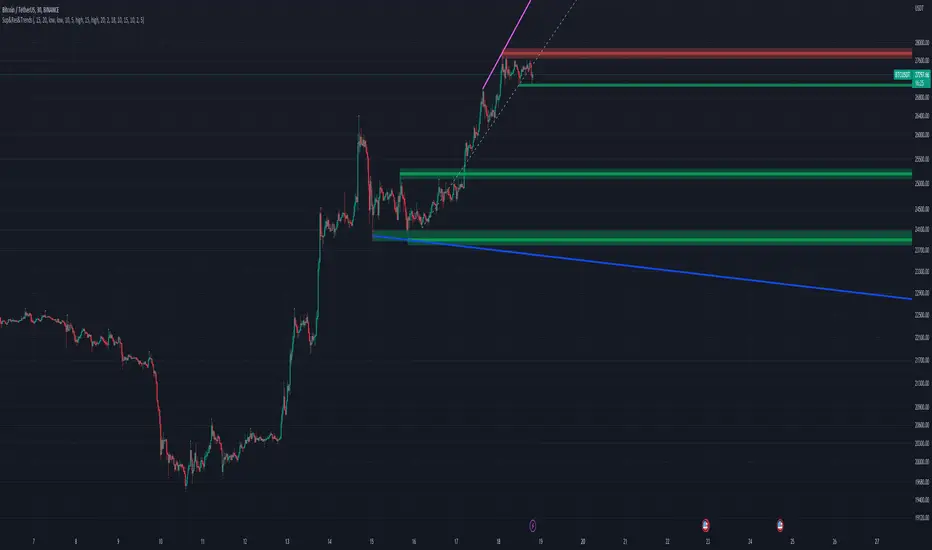
support and resistance on multi timeframe [parsimaj] Description:
support and resistance and trendline on two timeframes by your choice
This indicator is capable of showing you the current and higher timeframe support and resistance by your strategy choice (two timeframes alongside each other). It also helps you to monitor the trend direction in short and long term by trend lines . You can change the depth of every levels and trend lines from the panel. Use this indicator in all markets because it follows the basic principles of levels but is unique in changing second timeframe by your choice.
_its smart , if the levels are too close together ,it will choose the deeper ones for you.
How it works:
By default, there is no higher timeframe and you can select your desire higher timeframe from the panel. Higher timelines will be displayed thicker and your current levels would be thin lines. (Levels that are higher than the current price will be red and those that are lower will be green). The number of levels to display is also by your choice, the default is 4 levels for each timeframe.
We have two types of trend lines , long terms as trend 1 (blue below and purple above trend line )- short term as trend 2(dashed ones).
Bouncing on levels and breaking trend line are the best triggers for entry and exit points.
Setting:
First, choose your higher timeframe then the depth of levels for each time (current and higher), The deeper it is, the more precise the lines. After that you can set the depth of trend lines by your choice. Trend 1 is the longer term So put it deeper and then set the short trend line (dashed ones) if you want to change it.
We have put the settings in the best mode, but you can also change it according to your strategy and inform us about the results.
This indicator has been obtained with hours of effort and codding , hope you enjoy
Order Blocks GenieThe purpose of this Genie Algorithm Indicator is to identify Zones of institutional interest , including Order Blocks , while marking the Full Range Zones as well, with powerful smart tracking algorithm to mark and remove the appropriate levels to take for entries.
Order Blocks can be observed at the beginning of a strong, aggressive move, leaving behind a zone to be revisited later for "balance" the market. Therefore, these are interesting levels to place Limit/Market orders (Sell the Peaks or Buy the Valleys).
A Bullish Order Block is the last Bearish candle of a downtrend before a sequence of Bullish candles (thus forming a "Valley"). While a Bearish Order Block is the last Bullish candle of an uptrend before a sequence of Bearish candles (thus forming a "Peak").
Prices of the levels could be printed on the Price Scale, as well as many detailed configurations of what activates these Peak/Valleys (Zones) such as a Breakout, Close, Hard Close or Full Close. See the Tooltips in the Settings for all details of each option.
The strategy is to take the Untested Levels as long as the chart is maintaining the trend (ladder), preferably going with the trend for a higher win rate (or against it for a quick scalp). Be mindful of the breaking of a ladder or building of a new one. A ladder breaks with a hard close of a candle across the closest two levels; a ladder builds by not breaking back down across the levels it has tested. Strong ladders will have a few untested levels and come back to wick them but still retain the structure of the laddering direction (trending with Lower Lows + Lower High or Higher Lows + Higher Highs).
------------
Definitions:
1st Zone: The zone between the start of the initial candle of the Full Range (backside edge) to the 50% of Full Range Line (Average, aka. Equilibrium).
2nd Zone: The zone between 50% of Full Range Line (Average, aka. Equilibrium) to the 50% of Order Block (final candle left behind in the range before the aggressive move out).
Full Zone: 1st + 2nd Zones together.
Line: placed first at 50% of Full Range, and in specific cases gets moved to the 50% of Order Block.
Rules (in order):
- Wick Line: Mark Line Tested (light color)
- Close Beyond the Zone: Invalidate Full Zone (Remove Full Zone + Remove Line)
- Hard Close anywhere inside the Zone: Invalidate Full Zone (Remove Full Zone + Remove Line)
- Close inside 2nd Zone: Invalidate Full Zone (Remove Full Zone + Remove Line)
- Close inside 1st Zone: Shrink 1st Zone + Keep 2nd Zone + Move Line to 50% of Order Block
- Wick inside (or beyond) 2nd Zone before shrinking: Shrink 1st Zone + Keep 2nd Zone + Move Line to 50% of Order Block

Order Blocks & Breaker Blocks [LuxAlgo]The Order Blocks & Breaker Blocks indicator detects order blocks that can be turned into breaker blocks on the chart automatically once mitigated.
Users can determine the amount of bullish and bearish order/breaker blocks that display on their chart from within the settings menu.
🔶 SETTINGS
Swing Lookback: Lookback period used for the detection of the swing points used to create order blocks.
Show Last Bullish OB: Number of the most recent bullish order/breaker blocks to display on the chart.
Show Last Bearish OB: Number of the most recent bearish order/breaker blocks to display on the chart.
Use Candle Body: Allows users to use candle bodies as order block areas instead of the full candle range.
🔹 Style
Show Historical Polarity Changes: Allows users to see labels indicating where a swing high/low previously occurred within a breaker block.
🔶 USAGE
We have published several scripts covering the detection of order blocks previously, however, the concept of breaker blocks was not yet introduced.
When price mitigates an order block, a breaker block is confirmed. We can eventually expect price to trade back to this breaker block offering a new trade opportunity.
We can see that this is similar to a change in polarity, where a support becomes a resistance after a breakout and vice versa.
This script highlights regular order blocks as solid extended areas on the chart and breaker blocks as dashed lines with dual-colored areas. The color change and dashed line starts at the location where the order block was mitigated.
Using a higher "Swing Lookback" setting will return longer term order/breaker blocks on the chart.
Users can optionally enable "Historical Polarity Changes" labels within the settings menu to see where breaker blocks might have provided an effective trade setup previously.
The "Historical Polarity Changes" setting is disabled by default & is most effective using replay mode as the labels are backpainted.
The order blocks & breaker blocks themselves can be used in real-time as they are detected based on the swing length & previous breaker blocks being mitigated.

Simple ICT Order Blocks and Fair Value Gaps by Gowtham KannakajeThis scripts identifies ICT Order Block and ICT Fair Value Gaps
Fair Value Gap:
- Fair Value Gap toggle is off by default
- Users can choose to color the bars having Fair Value Gaps or can select to define the Fair Value Gap using boxes.
- Bar color and box colors can be customized
Order Blocks:
- Order Block box and candle color toggle is on by default
- Users can choose to color the Order Block candles or can select to define the Order Blocks using boxes.
- Bar color and box colors can be customized for bullish and bearish Order Block separately
Note:
- Order Blocks are considered valid only if the candle forming the Fair Value Gap closes away from the Order Block.
- Since Trading View limits the number of boxes to 500, it is advised to use the Color Candle option to identify the Order Blocks or Fair Value Gaps which are very old.
New concept Definitions:
Naked OB : An order block whose immediate next candle forms a Fair Value Gap. Here, the Order Block high or low contributes to the formation of Fair Value Gap.
Covered OB : An order block whose immediate next candle doesn't form a Fair Value Gap. Here, the Order Block high or low doesn't contribute to the formation of Fair Value Gap. Instead it will have other candles in between the Order Block and Fair Value Gap.
Disclaimer: The usage of this indicator might or might not contribute to your profits and losses and the author is not responsible for the same.
Happy Trading.

PATIThis indicator is part of our educational suite focused on teaching price structure, momentum, and mean reversion trading strategies for intraday trading. Our team has selected this set of tools and metrics, which define our trading style and serve as the foundation for our teaching, to be included in this indicator. We are displaying each component in a way we believe is helpful to their understanding which also provides a clean, comprehensive look.
This indicator is for Intraday Trading
Our Traders most commonly use this indicator on the 1,3 or 5 minute chart.
Components of this Indicator:
Multiple VWAP Levels: monthly, weekly, standard (anchored to the right of price)
Dynamically Anchored VWAP Cloud (trend tool)
13 EMA (trend tool)
Structural Orderblocks
Multi-Timeframe Fair Value Gap detection
Key Daily Price Levels (anchored to the right of price)
Customizable Opening Range (anchored to the right of price)
15 minute “Golden Zone” (shows the .5-.618 zone of the previous 15m candle)
ADR (Average Daily Range)
A4R (Average 4hr Range)
These tools are used in conjunction with the education we provide to help our users determine their optimal trade plan to utilize their edge.
Specific Functionalities and Uses:
Monthly-VWAP & Weekly-VWAP (M-VWAP/W-VWAP):
VWAP = “Volume Weighted Average Price”
These levels provide probable zones where price may mean revert and risk should be taken off/ put on. We have anchored these to the right-hand side of your chart by default to minimize the noise on your chart.
Average Daily Range (ADR): The Average Daily Range is a technical indicator used to measure the volatility of an asset. It displays how much an instrument can move on average during a given day. The significance is that each market has a unique range that is likely to be covered on any given day.
Average 4hr Range (A4R): The Average 4hr Range is a technical indicator used to measure the volatility of an asset twice in a single session. It displays how much an instrument can move on average during a session and is measured twice in a day. Calculating a smaller volatility range may seem strange at first but can be a huge advantage by analyzing the volatility of the intraday action, giving you average price targets based on more recent market data.
Tip: When used in conjunction with key support and resistance levels, ADR & A4R can be a huge edge to traders to determine where to push/pull risk.
Opening Range: The open often establishes the trend and sentiment for the day, but there is also statistical significance to the open that is overlooked. Statistically, on average, the open is near the high or low of the day and offers plenty of opportunities to build trading strategies. The chart below provides some potential trades that could be taken once the opening range has been established.
Dynamically Anchored VWAP Cloud: Our dynamically anchored VWAP cloud tracks the most recent impulsive move and re-anchors to show you potential bounce points in a trend. We re-anchor at each structural shift to give the most probable targets for buyers/sellers to defend their positions to continue the current trend push.
By utilizing the re-anchoring at each significant structural inflection point, we can establish a much less lagging trend following technique.
We have also included the feature to substitute this cloud for a 34/55 EMA cloud for the traders already familiar with that system.
The chart below provides potential trades that could be taken using the VWAP cloud system.
FVGS (Fair Value Gaps/ Imbalances): These areas represent potential buy/sell side liquidity imbalances where price is pushed aggressively, sweeping the orderbook and will likely return to “fix” the structure before continuing. Below is an example of 3 possible trade paths we look for inside these structural imbalances.
Structural Orderblocks:
These areas are based on structural pivots that have been pushed out of with aggression determined by subsequent structural breaks to confirm their validity. Because of this, when price returns to these areas we can anticipate this area to be defended.
The blue boxes track Orderblocks. These highlight instances of past participation which create areas likely to be defended again when retested.
Swing High/Low/Previous:
We use swing high and lows as points of short-term support and resistance, a break of these levels can signify a shift in market sentiment.
-The dashed green line shows the previous structural swing high or low pivot point.
-The solid green lines show the high and low in our current trading structure.
Note: Displaying the previous swing can provide us with context of the current market trend, and will assist us make better decisions.
15 Minute Golden Zone:
Displayed as a gray box, it tracks the .5-.618 of the previous 15m candle and gives us an area where we look for short-term resistance/support on smaller time frame price action. This area can be viewed as an equilibrium of the current range. If the price can hold this area, it can show a likely support area for continuation.
13 EMA:
This is the choice length ema of our traders, they use this ema to confirm (short-term) trend direction and reference it for a common bounce point for re-entries. Our traders consider this as a crucial point to speculate reversals and break of short-term trends.
Note: Typically in a trend we see the price hold to one side of this ema, by looking for this characteristic, it brings confidence to staying in trades.
Please check the Author Instructions Below for how to gain access to our indicators.
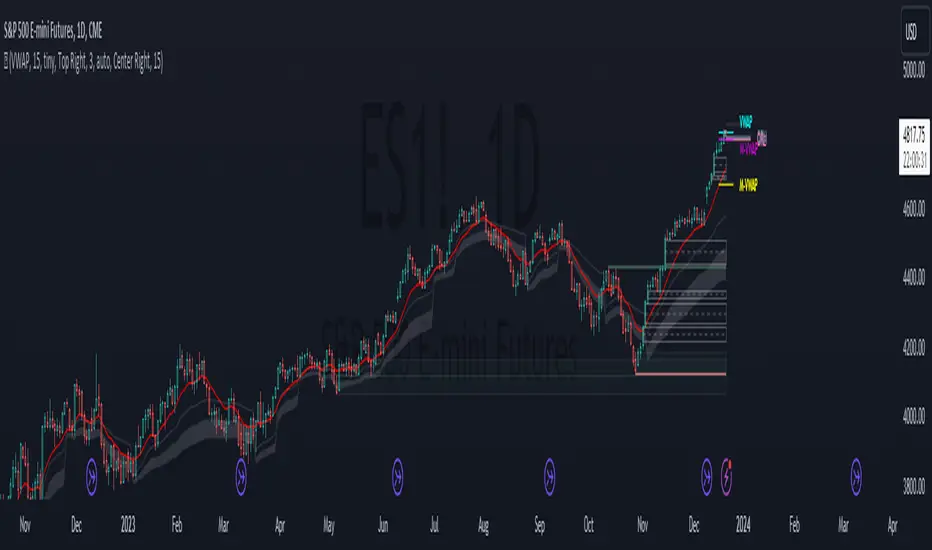
Smart Money Essentials [TFO]This indicator utilizes “Smart Money Concepts” like liquidity, order blocks, premium & discount, and more to analyze price action.
What’s included in the initial release:
Market Structure
Liquidity
Displacement
Order Blocks
Premium / Discount
Confluence Table
Alerts
Market structure logic objectively identifies whether the current trend is bullish or bearish, based on swing highs and lows. Liquidity levels offer insight into major pivots where we can assume many traders may place their stop loss, which can also serve as areas where “Smart Money” may be accumulating or distributing positions.
Displacement adds to this by spotting rapid price movement, often accompanied by imbalances where price may come back to before continuing in the direction of the displacement. These can be filtered based on whether the imbalance is accompanied by a Break of Structure (BOS) or Market Structure Shift (MSS), which may give additional insight into the draw on liquidity.
Order blocks (OB’s) are detected and treated as areas that may offer support for price in an uptrend or resistance in a downtrend. Premium and discount zones are essentially fitted by an “auto-fib” retracement that looks at recent liquidity levels, and optionally offers areas to look for an Optimal Trade Entry (OTE) where price retraces between 62-79% of the preceding displacement leg.
The confluence table provides an organized place to visualize and identify where any of the above concepts may be present at or around the same time. We can implement a threshold where, if the number of selected factors meets or exceeds this threshold, we can potentially identify bullish and bearish opportunities where multiple layers of confluence are overlapping.
And of course, alerts are built in for all significant events related to the above concepts, for example: runs on liquidity, BOS and MSS, rejections from OB and OTE, etc.
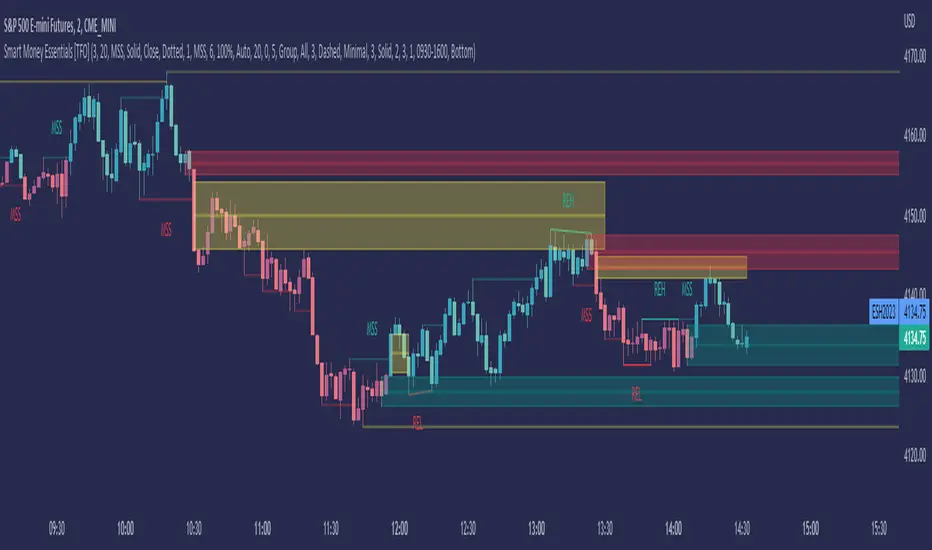
ASE Supply & Demand█ Introduction
ASE Supply & Demand is a multi-timeframe Supply and Demand zone indicator based on the Order Block concept. Order Blocks are a price action concept defined as a basing candle followed by a breakout candle (as seen in the chart below). A basing candle typically shows a slowing down in price action, foreshadowing a reversal and initial institutional activity. The breakout candle then confirms institutional activity with a displacement candle in the opposite direction of the basing candle. Additionally, there is an advanced feature called “Potentials,” which allows us to see price action forming S&D zones beforehand & trapped positions live through the same Order Block concept.
█ Supply and Demand Zones
The Supply & Demand zones are plotted on 8 timeframes (5m, 15m, 30m, 1hr, 2hr, 3hr, 4hr, D). In addition, there are custom settings that allow the trader to filter for the most significant zones and to cohere to their trading style:
Range Multiplier
Filters the creation of a zone based on the basing candle of Supply/Demand(0-5)
The size of the basing candle must be smaller than 0-5 times the True Range Index to create Supply/Demand.
If the basing candle range is smaller than the True Range Index, this can foreshadow the potential of institutional activity as price slows down, and a potential reversal might occur.
True Range Index
The number of bars to calculate the True Range in Range S+D mode.
Displacement Sensitivity
Filters the creation of a zone based on the displacement from the base (0-20)
Calculated by taking the breakout range (as seen in the chart below) divided by the range of the basing candle
0 = less significant, more zones
20 = more significant, fewer zones
Zone Strength Filter %
Filter out current zones based on how strong they are (0-100)
Calculated by the amount of fill within a zone. By changing the Zone Strength Filter, you can display zones that have not breached the filter % you select. For example, if you choose 80% Zone Strength, that means it will only show zones that are 20% filled or less; in other words, zones that have 80% or more yet to be filled.
0 = All Zones
100 = Completely unused zones
With these advanced filters and plotting on multiple timeframes, we have created the best Supply and Demand Indicator . In addition, these filters help to eliminate insignificant zones and noise in the market, leaving us a clean chart.
█ Potentials
Potentials foreshadow the possibility of a Supply or Demand Zone forming, the possibility of a Trapped concept, and it works great as targets or influence in our trades.
Potentials are calculated by the same Order Block concept, which allows us to see Supply & Demand/Order Blocks forming in real-time.
When a potential is triggered and holds, the line turns solid. If it continues to hold, it has the potential of forming a Supply/Demand zone based on the trader's Zone Filters. If the price pulls back and fails to hold, it will go back to dotted. Inferring it used the potential as liquidity and is potentially trapping market participants at that potential.
█ How To Use:
Supply and Demand Zones are the ‘Where’ to our trade but not the ‘Why.’ This means that the zones are our POI (Point of Interest) and ‘Where’ we want to be looking for a trade. It is not our ‘Why’ because we do not enter just because we are in a zone. This is because we expect pivots or reversals inside our Supply & Demand zones, and this rarely happens quickly.
What we want to look for in our zones is a solid base for our reversals. Simply put, we want to see new demand forming at our Demand Zones and new supply forming at our Supply Zones. This can be achieved by observing the ‘Potentials’ feature which allows us to see new Order Blocks or ‘Base Candles’ forming. With a trained eye, the ‘Potentials’ feature is highly effective in addition to its ‘Trapped’ logic which can offer entries on their own. The "Trapped" label on potentials shows potential trapped buyers or sellers after we reach that level. Observing and understanding how price action facilitates, especially around the zones, is crucial to its usability. In addition, other strategies or indicators can be used in confluence to support bounces out of demand and rejections out of supply.
Ultimately once we find a viable entry, we want to see a complete cycle. For example, if we caught a bounce out of demand with new demand forming, we would want to see the cycle complete and us reach the next supply or manufacture new supply. The ‘Potentials’ feature is the easiest way to gather multiple targets and at the same time offers stop loss management.
█ Settings:
Enable Supply/Demand/ Zones and Potential Liquidity
STF S&D Zones - Enables 5 minute and 15 minute timeframe for zones
LTF S&D Zones - Enables 30 minute and 1 hour timeframe for zones
HTF S&D Zones - Enables 2 hour, 3 hour, and 4 hour timeframe for zones
Daily S&D Zones - Enables Daily timeframe for zones
Enable Potentials
Supply Demand Zone Models
Range - Filters zones based on the range of candles before supply/demand
Displacement - Filters zones based on the displacement of the breakout candle
Range + Displacement - Filters zones based on the displacement of breakout candle and range of the candles before supply/demand
Supply Demand Zone Filters (see “Supply and Demand Zones” section for usage)
Range Multiplier
True Range Index
Displacement Sensitivity
Zone Strength Filter %
Deletion Conditions
Confirmed - Deletes zone upon time-frame close above supply or below demand
On Break - Deletes zone upon break above the top of supply or break below bottom of demand
On Tap - Deletes zone upon the touch of supply or demand
Other Settings
Price Labels - Turns on Zone Price Levels
Supply/Demand Color Input - Customize color of zones to your liking
Supply Demand Border Width - Change the border width of zones (0 would be completely borderless zones)
Supply Demand Transparency - Change transparency of zones (0 is completely solid zones, 100 is completely transparent)
Transparency Input - "Normal" Transparency stays at the level that's set; "Decrease with price" as price moves through, the zones become more transparent
Default Color - Changes color of any text/labels (default is gray)
Text size - Change size of text on labels
Bagang Pivot Zones | Supply & Demand, Support & ResistanceBagang Pivot Zones detects imbalances from classic reversal and momentum price actions.
Imbalances create pivot zones, a.k.a Supply & Demand / Support & Resistance / Orderblock zones.
Use Cases
1. Traders using Supply & Demand theory can quickly pinpoint imbalance zones created by BUY-to-SELL and SELL-to-BUY candles.
2. Trend Following traders can systematically catch and follow a trend based on pivot zones analysis.
3. Breakout traders can easily target pivot zones’ breakout and breakdown.
4. Take the guesswork out of risk management: manage stop-loss precisely behind pivot zones.
5. Analyze contrary pivot zones to set realistic profit targets.
Objectivity
By only comparing OHLC values to identify notable price actions, Bagang Pivot Zones avoids derived calculations with subjective parameters.
Chart Issue
If the chart zooms out after adding an indicator, right-click the price scale and toggle "Scale price chart only” on.

Order Block Detector [LuxAlgo]This script makes use of high-volume activity as an indicator of the presence of market participants accumulating orders in specific areas on a lower timeframe by detecting volume peaks to form order blocks.
Mitigated order blocks are automatically hidden from the chart, also allowing users to be able to select two different mitigation methods "wick" and "close".
Additionally, users can be alerted for the creation and mitigation of bullish/bearish order blocks.
Settings
Volume Pivot Length: Lookback of the pivot function used to detect volume peaks, lower values will detect order blocks more frequently.
Bullish OB: Determines the number of most recent unmitigated bullish order blocks to display on the chart.
Bearish OB: Determines the number of most recent unmitigated bullish order blocks to display on the chart.
Bearish OB: Determines the number of most recent unmitigated bullish order blocks to display on the chart.
Average Line Style: Line style of the average order block level.
Average Line Width: Line width of the average order block level.
Mitigation Methods: Method used to determine how an order block is mitigated. "Wick" will mitigate order blocks if the candle wick goes outside of the order block and "Close" will mitigate order blocks if the closing price goes outside of the order block.
Usage
It is common for more significant market participants to execute orders incrementally in order to avoid overwhelming the market and cause significant price movements. This practice allows the orders to be executed more efficiently and effectively, reducing the impact on the market and minimizing the potential for price volatility.
Order blocks are price areas where these orders are executed incrementally and are commonly used as areas of support/resistance for traders.
Bearish order blocks occur during a downtrend, while bullish order blocks occur in an uptrend. Bullish order blocks range from the price low to the median price, while bearish order blocks range from the median price to the price high. The median price is used as an equilibrium point.
Users can highlight the bars where an order block was detected from the style settings by toggling on the 'Bull OB' or 'Bear OB' selections.
Note that in order to confirm a peak Volume Pivot Length bars are needed, as such note that order blocks are shown retrospectively.
