A-Share Broad-Based ETF Dual-Core Timing System1. Strategy Overview
The "A-Share Broad-Based ETF Dual-Core Timing System" is a quantitative trading strategy tailored for the Chinese A-share market (specifically for broad-based ETFs like CSI 300, CSI 500, STAR 50). Recognizing the market's characteristic of "short bulls, long bears, and sharp bottoms," this strategy employs a "Left-Side Latency + Right-Side Full Position" dual-core driver. It aims to safely bottom-fish during the late stages of a bear market and maximize profits during the main ascending waves of a bull market.
2. Core Logic
A. Left-Side Latency (Rebound/Bottom Fishing)
Capital Allocation: Defaults to 50% position.
Philosophy: "Buy when others fear." Seeks opportunities in extreme panic or momentum divergence.
Entry Signals (Triggered by any of the following):
Extreme Panic: RSI Oversold (<30) + Price below Bollinger Lower Band + Bullish Candle Close (Avoid catching falling knives).
Oversold Bias: Price deviates more than 15% from the 60-day MA (Life Line), betting on mean reversion.
MACD Bullish Divergence: Price makes a new low while MACD histogram does not, accompanied by strengthening momentum.
B. Right-Side Full Position (Trend Following)
Capital Allocation: Aggressively scales up to Full Position (~99%) upon signal trigger.
Philosophy: "Follow the trend." Strike heavily once the trend is confirmed.
Entry Signals (All must be met):
Upward Trend: MACD Golden Cross + Price above 20-day MA.
Breakout Confirmation: CCI indicator breaks above 100, confirming a main ascending wave.
Volume Support: Volume MACD Golden Cross, ensuring price increase is backed by volume.
C. Smart Risk Control
Bear Market Exhaustion Exit: In a bearish trend (MA20 < MA60), the strategy does not "hold and hope." It immediately liquidates left-side positions upon signs of rebound exhaustion (breaking below MA20, touching MA60 resistance, or RSI failure).
ATR Trailing Stop: Uses Average True Range (ATR) to calculate a dynamic stop-profit line that rises with the price to lock in profits.
Hard Stop Loss: Forces a stop-loss if the left-side bottom fishing fails and losses exceed a set ATR multiple, preventing deep drawdowns.
3. Recommendations
Target Assets: High liquidity broad-based ETFs such as CSI 300 ETF (510300), CSI 500 ETF (510500), ChiNext ETF (159915), STAR 50 ETF (588000).
Timeframe: Daily Chart.
Indicatori e strategie


Xbirch_Turtle_ Crypto_CalcМодернизированная стратегия Черепах.
Вход/выход по каналу Дончиана, стопы по величине ATR, возможность выбора лонг/шорт/всё. Имеется пирамидинг - добавление по +0,5ATR от первого бая, не более 4х входов. Модернизированный стоп - по ATR от первого бая.
Не финансовый совет.
A modernized Turtle strategy.
Entry/exit based on the Donchian Channel, stops based on the ATR value, and the ability to choose long/short/all options. Pyramiding is available – adding +0.5 ATR from the first buy, with a maximum of four entries. The modernized stop is based on the ATR value from the first buy.
This is not financial advice.

extradestrategy.limited.editiom 2026cocok untuk btc usd tidak di perjual belikan harap tidak menggunakan sembarangan

The Engulfing Liquidity Signal with Adjustable Trailing StopEngulfing Liquidity Signal with Adjustable Trailing Stop
This strategy is designed to enter long trades based on the Engulfing Liquidity Signal combined with a Trailing Stop. The strategy uses custom volume analysis and price action to detect potential market opportunities. The Trailing Stop is adjustable, allowing traders to customize the distance at which the stop will trail the price.
Key Features:
Engulfing Liquidity Signal: The strategy enters a trade when the market shows signs of strong liquidity and price action, typically when there is a strong reversal signal (bullish engulfing) accompanied by higher volume.
Trailing Stop: A dynamic exit strategy that locks in profits by trailing the stop level behind the highest price achieved since the trade entry. This prevents the position from being closed prematurely while still protecting profits if the market reverses.
Customizable Trailing Stop: Users can adjust the trailing stop percentage via the settings. This allows for greater flexibility in how closely the stop will trail the price.
No Fixed Take Profit: The strategy uses only the trailing stop, ensuring that profits are maximized based on price action without a fixed profit target.
How the Strategy Works:
Buy Signal (LongC):
The strategy triggers a buy signal when a bullish engulfing pattern occurs, and the liquidity conditions align (i.e., the volume is increasing and price action shows signs of a potential reversal).
The strategy enters a long position when the signal conditions are met.
Trailing Stop Logic:
Once the trade is initiated, a trailing stop is applied. The stop level follows the highest price achieved since entry, trailing the price based on a user-defined percentage.
The stop level adjusts upward as the price increases, locking in profits. If the price reverses and hits the trailing stop, the trade is closed.
The trailing stop is dynamic, meaning it moves only in the direction of profit, but it will not move lower once it has been set.
Sell Signal (ShortC):
The position will also be closed if a sell signal (ShortC) is generated. This ensures that the strategy exits the trade when a potential reversal is detected in the market.
No Fixed Take Profit:
The strategy does not use a fixed take profit level. Instead, the profit is managed entirely by the trailing stop, which ensures that positions remain open as long as the market is moving in favor of the trade, allowing the position to capture the maximum possible profit.
Settings:
Trailing Stop Percentage: The user can adjust the trailing stop distance by setting a percentage value between 10% and 100%. This controls how tightly or loosely the trailing stop will follow the price.
Benefits:
Maximized Profits: By using a trailing stop, the strategy aims to capture as much profit as possible without prematurely exiting trades.
Customizable: The adjustable trailing stop allows traders to tailor the strategy to their risk tolerance and market conditions.
Simple & Effective: The strategy is straightforward, relying on price action and volume signals, making it easy to understand and implement.
Ideal Use Case:
This strategy is suitable for traders who prefer to let their profits run and manage risk with a trailing stop. It is particularly useful in trending markets where the price continues to move in one direction for an extended period. By using a trailing stop, the strategy allows you to stay in the market and capture large moves while protecting profits.
This strategy provides an excellent combination of automated trade management with a Trailing Stop and Engulfing Liquidity Signal, making it a solid choice for traders seeking to automate their trades with customizable risk management.

Gold Smart Scalper V3 - Clean ChartOverview
The Gold Smart Scalper V3 is a trend-following momentum strategy specifically optimized for XAU/USD (Gold). It focuses on catching "value pullbacks" within a strong trend, avoiding the noise of sideways markets. Unlike many scalpers that use lagging indicators for exits, this version uses fixed ATR-based targets to lock in profits during high-volatility moves common in Gold.
Core Methodology
The strategy operates on three layers of confirmation:
Macro Trend (HTF Filter): Uses a 50-period EMA to ensure trades are only taken in the direction of the higher-timeframe momentum.
The Value Zone: Instead of "chasing" green or red candles, the script waits for a pullback to the space between the 9 EMA and 21 EMA. This ensures a better risk-to-reward entry point.
The Trigger: A trade is only executed when price confirms the resumption of the trend by crossing back over the signal EMA after the pullback.
Key Features
Fixed Profit Targets: Replaced dynamic trailing stops with fixed Take Profit (TP) and Stop Loss (SL) levels based on ATR, ensuring exits aren't "hunted" by Gold's signature volatility spikes.
C lean Chart Interface : All moving average plots are hidden. The only visuals provided are the active TP/SL levels when a trade is live, keeping your workspace clutter-free.
Single-Trade Logic: The script includes a "One Trade Per Cross" gate, preventing the strategy from over-trading or "stacking" positions during choppy price action.
Settings & OptimizationATR Multipliers :
Stop Loss (SL): Default $2.0 \times ATR$. Protects against standard market noise.Take Profit (TP): Default $3.0 \times ATR$. Designed for a high Risk/Reward profile.Timeframe Recommendation: Optimized for 15m and 1H for swing scalping, or 5m for aggressive scalping.Instrument: Specifically tuned for Gold (XAU/USD), but applicable to other high-volatility pairs like GBP/JPY or NASDAQ.
Disclaimer
This script is for educational and backtesting purposes only. Past performance does not guarantee future results. Always practice proper risk management.

UT Bot + Hull MA Close-Cross Confirm (Strategy)UT Bot + Hull MA Close-Cross Confirm (Strategy)
This strategy combines the classic UT Bot ATR trailing stop with a Hull Moving Average (HMA) close-cross confirmation to reduce false signals and improve trade quality.
The system works in two stages:
UT Bot Signal Detection
A volatility-adjusted ATR trailing stop identifies potential trend shifts using a 1-period EMA crossover. This provides early buy and sell signals based on momentum and volatility.
Hull MA Close-Cross Confirmation
UT Bot signals are only confirmed once price closes across the Hull Moving Average. If a UT signal occurs on the wrong side of the Hull MA, the strategy waits until a valid close-cross occurs before triggering an entry. This confirmation step helps filter chop and late-trend reversals.
Key Features
Non-repainting logic (uses bar-close confirmation)
Futures-friendly design (fixed contracts, point-based TP/SL)
Supports Long, Short, or Both directions
Built-in Take Profit & Stop Loss
Configurable Hull MA type (HMA / EHMA / THMA)
Optional Heikin Ashi signal source
Clean Buy/Sell alerts for automation and webhook execution
Trade Logic Summary
Long Entry:
UT Bot buy signal + confirmed close above Hull MA
Short Entry:
UT Bot sell signal + confirmed close below Hull MA
Exit:
Fixed Take Profit or Stop Loss (user-defined in points)
Alerts & Automation
The strategy includes dedicated Buy Alert and Sell Alert conditions designed for webhook automation (e.g., trade logging, execution engines, or external dashboards). Alerts trigger only on confirmed bar closes, matching backtest behavior.
Intended Use
This strategy is designed for futures markets (e.g., MNQ, ES, GC) and performs best on intraday timeframes. Session filters, risk rules, and trade management can be handled externally if desired.
Disclaimer
This script is provided for educational and research purposes only and is not financial advice. Always test thoroughly and use proper risk management.

Trend Dip-BuyerThis strategy is a simplified, high-probability Dip Buying System designed for active growth stocks. Instead of chasing breakouts at the top, it waits for the stock to take a "breather" (pullback) within an uptrend and buys the discount.
It combines a classic Trend Filter (50 EMA) with a sensitive Momentum Oscillator (RSI 2) to pinpoint the exact moment a pullback is likely to reverse back up.
How It Works:
1. The Trend Filter (50 EMA)
The strategy ONLY trades Long.
It requires the price to be above the 50-period Exponential Moving Average (EMA) (Blue Line). This ensures you are trading with the momentum of the market, not against it.
2. The Dip Signal (RSI 2)
It uses a fast 2-period RSI.
When RSI(2) drops below 50, it signals that the stock is temporarily "oversold" or resting. This is your cue that a discount entry is available.
3. Dynamic Exits
Profit Taking: The primary target is dynamic. The strategy looks to exit when RSI(2) spikes above 70, allowing you to capture the bulk of the momentum swing. (A fixed ATR target option is also included).
Safety: A 3x ATR Stop Loss protects the trade from sudden reversals.
✅ Simple Entry Checklist
Before taking a trade, ensure all 3 boxes are checked:
Trend Check: Is the current price ABOVE the Blue Line (50 EMA)?
Dip Check: Is the RSI (2) value BELOW 50?
Time Check: Is it past 12:00 PM? (Recommended for cleaner trends, but optional).
👉 If YES to all: Enter Long on the next candle open.
Best Settings (Customizable):
RSI Threshold: Default is 50 (Balanced). Lower to 30 for fewer, higher-quality trades.
Exit Method: "RSI > 70" is recommended for maximizing wins in strong trends.
Time Filter: "Trade > 12pm" is enabled by default to avoid morning volatility.

RSI Strategy with Auto Tuner (PF)# RSI Auto‑Tuner Strategy — How To Use
This document explains **how to use** the RSI Auto‑Tuner strategy. It intentionally avoids math and implementation details. Follow this as an operating guide.
---
## 1. What This Tool Is For
This strategy helps you:
* Discover **which RSI length works best** on a given ticker and timeframe
* Measure performance using **Profit Factor (PF)**
* Improve RSI performance on noisy markets by **transforming price first**
The auto‑tuner is a **research tool**, not a live trading signal generator.
---
## 2. Two Modes You Must Treat Differently
### Research Mode
Used to explore and discover parameters.
* Auto‑Tune: **ON**
* Parameters are allowed to change
* Results may look very good
* Overfitting risk is real
### Trading Mode
Used for forward testing or live trading.
* Auto‑Tune: **OFF**
* Parameters are fixed
* Behavior is stable and repeatable
* This is the only acceptable mode for live use
**Never trade live with Auto‑Tune enabled.**
---
## 3. Manual Mode (Trading Mode)
Use this after parameters are finalized.
Steps:
1. Set **Auto‑Tune = OFF**
2. Choose:
* Source (raw price or transformed price)
* RSI Length (manual, default 14)
* Oversold / Overbought levels
3. The strategy will:
* Enter long when RSI crosses up through Oversold
* Enter short when RSI crosses down through Overbought
* Flip positions on opposite signals
This mode is predictable and safe for forward testing.
---
## 4. Auto‑Tune Mode (Research Mode)
Use this to find optimal RSI lengths.
Steps:
1. Set **Auto‑Tune = ON**
2. Configure the search range:
* Minimum Length (default 5)
* Maximum Length (default 14)
* Step Size (default 1)
3. The strategy will:
* Internally simulate trades for each RSI length
* Track gross profit, gross loss, and trades
* Select the length with the highest Profit Factor
4. The best length is applied automatically
Auto‑Tune evaluates historical data only.
---
## 5. Using a Transform on Price (Critical)
RSI does **not** have to run on raw price.
You can significantly improve results by:
* Applying a **price transform** first
* Feeding the transformed series into the RSI Source input
Examples of transforms:
* Moving averages
* Low‑pass filters
* Butterworth filters
* Any smoother or denoiser
Why this works:
* Busy, wicky markets cause RSI to whipsaw
* Transforms remove micro‑noise
* RSI responds to structure instead of chaos
* Profit Factor often increases dramatically
Best practice:
* Auto‑tune on raw price
* Auto‑tune on transformed price
* Compare PF, trade count, and stability
---
## 6. Reading the Status Label
At the last bar, the on‑chart label shows:
* Whether Auto‑Tune is ON or OFF
* Whether candidates were built successfully
* Number of RSI lengths tested
* Best RSI length found
* Profit Factor and trade count
If Auto‑Tune is OFF, the label shows the manual length.
---
## 7. Recommended Workflow
1. Choose ticker and timeframe
2. Enable Auto‑Tune on **raw price**
3. Record best RSI length and PF
4. Enable Auto‑Tune on **transformed price**
5. Compare results
6. Lock parameters
7. Disable Auto‑Tune
8. Forward test
---
## 8. Warnings and Discipline
* High PF with few trades is unreliable
* Transforms can hide execution costs
* Always validate on a different period
* Auto‑Tune is a **lens**, not an edge
Treat this tool as a research microscope, not an autopilot.

Prop ES EMA Cross during Single/Dual Trading SessionEMA crossover strategy for ES futures optimized for prop firm rules.
Choose long-only, short-only, or both directions.
Customizable short and long EMA lengths.
Enter trades during one or two configurable sessions specified in New York time.
Fixed TP/SL in ticks with forced close by 4:59 PM NY time.

EMA 1 & SALMA Intersection StrategyTrading Strategy: EMA 1 & SALMA Crossover System
This strategy is a Trend-Following system that focuses on the direct interaction between the price (represented by EMA 1) and a smoothed trendline (SALMA). Instead of relying on the color changes of the indicator, it uses mechanical crossover signals to enter and exit trades.
1. Indicators Used
EMA 1 (Exponential Moving Average): Since the period is 1, it effectively represents the Current Price. It reacts instantly to every market move.
SALMA v3.0 (Smoothed Adaptive Lattice Moving Average): A double-smoothed moving average that acts as the "Base Line" or "Trend Support/Resistance."
RSI (Relative Strength Index): Used as a Momentum Filter to ensure we don't trade against the market's strength.
2. Buy (Long) Entry Rules
You enter a Long position when the following conditions are met:
The Crossover: The EMA 1 (Price) crosses ABOVE the SALMA line. This indicates that the short-term momentum is shifting higher than the average trend.
The Filter (RSI): The RSI must be above 50. This confirms that the buyers are in control and the upward move has enough strength.
3. Sell (Short) Entry Rules
You enter a Short position when the following conditions are met:
The Crossunder: The EMA 1 (Price) crosses BELOW the SALMA line. This indicates a breakdown in price action.
The Filter (RSI): The RSI must be below 50. This confirms that the sellers are dominating and the downward momentum is real.
4. Key Advantages of This System
Objectivity: You don't guess based on the color of the line; you wait for a clear physical break (cross) of the line.
Precision: By using EMA 1, you get the earliest possible entry signal compared to slower moving averages.
False Signal Protection: The RSI 50 filter prevents you from entering "weak" trades where the price crosses the line but lacks the volume or momentum to continue.

OCC Strategy Optimized (MA 5 + Delayed TSL)# OCC Strategy Optimized (MA 5 + Delayed TSL) - User Guide
## Introduction
The **OCC Strategy Optimized** is an enhanced version of the classic **Open Close Cross (OCC)** strategy. This strategy is designed for high-precision trend following, utilizing the crossover logic of Open and Close moving averages to identify market shifts. This optimized version incorporates advanced risk management, multi-timeframe analysis, and a variety of moving average types to provide a robust trading solution for modern markets.
>
> **Special Thanks:** This strategy is based on the original work of **JustUncleL**, a renowned Pine Script developer. You can find their work and profile on TradingView here: (in.tradingview.com).
---
## Key Features
### 1. Optimized Core Logic
- **MA Period (Default: 5):** The strategy is tuned with a shorter MA length to reduce lag and capture trends earlier.
- **Crossing Logic:** Signals are generated when the Moving Average of the **Close** crosses the Moving Average of the **Open**.
### 2. Multi-Timeframe (MTF) Analysis
- **Alternate Resolution:** Use a higher timeframe (Resolution Multiplier) to filter out noise. By default, it uses $3 \times$ your current chart timeframe to confirm the trend.
- **Non-Repainting:** Includes an optional delay offset to ensure signals are confirmed and do not disappear (repaint) after the bar closes.
### 3. Advanced Risk Management
This script features a hierarchical exit system to protect your capital and lock in profits:
- **Fixed Stop Loss (Initial):** Protects against sudden market reversals immediately after entry.
- **Delayed Trailing Stop Loss (TSL):**
- **Activation Delay:** The TSL only activates after the trade reaches a specific profit threshold (e.g., 1%). This prevents being stopped out too early in the trade's development.
- **Ratchet Trail:** Once activated, the stop loss "ratchets" up/down, never moving backward, ensuring you lock in profits as the trend continues.
- **Take Profit (TP):** A fixed percentage target to exit the trade at a pre-defined profit level.
### 4. Versatility
- **12 MA Types:** Choose from SMA, EMA, DEMA, TEMA, WMA, VWMA, SMMA, HullMA, LSMA, ALMA, SSMA, and TMA.
- **Trade Direction:** Toggle between Long-only, Short-only, or Both.
- **Visuals:** Optional bar coloring to visualize the trend directly on the candlesticks.
---
## User Input Guide
### Core Settings
- **Use Alternate Resolution?:** Enable this to use the MTF logic.
- **Multiplier for Alternate Resolution:** How many charts higher the "filter" timeframe should be.
- **MA Type:** Select your preferred moving average smoothing method.
- **MA Period:** The length of the Open/Close averages.
- **Delay Open/Close MA:** Use `1` or higher to force non-repainting behavior.
### Risk Management Settings
- **Use Trailing Stop Loss?:** Enables the TSL system.
- **Trailing Stop %:** The distance the stop follows behind the price (Optimized Default: 1.5%).
- **TSL Activation % (Delay):** The profit % required before the TSL starts moving. (Optimized Default: 2.0% to ensure 0.5% profit is locked immediately).
- **Initial Fixed Stop Loss %:** Your hard stop if the trade immediately goes against you.
- **Take Profit %:** Your ultimate profit target for the trade.
---
## How to Trade with This Strategy
1. **Identify the Trend:** Look for the Moving Average lines (Close vs Open) to cross.
2. **Wait for Confirmation:** If using MTF, ensure the higher timeframe also shows a trend change.
3. **Manage the Trade:** Let the TSL work. With the default **2.0% Activation** and **1.5% Trail**, the strategy will automatically lock in **0.5% profit** the moment the threshold is hit, then follow the price higher.
4. **Position Sizing:** Adjust the `Properties` tab in the script settings to match your desired capital allocation (Default is 10% of equity).
---
## Recommended Settings
1. Trialing < Activation
2. Check ranging
## Credits
Original Strategy by: **JustUncleL**
Optimized and Enhanced by: **Antigravity AI**

RSI (Any Source) StrategyThis is a simple RSI crossover/crossunder strategy. It calculates RSI on a user-selected Source (default close) using the chosen Length (default 14). It enters a long when RSI crosses up through the Oversold level (default 30), and enters a short when RSI crosses down through the Overbought level (default 70). It does not include explicit exits—each new signal effectively flips/replaces the position via a new entry.

Butterworth LPF Flip + AutoTune (PF)Butterworth LPF Flip + AutoTune (PF)
This strategy trades price trend flips using two Butterworth low-pass filters (a FAST filter and a SLOW filter). A trade is taken when the FAST filter crosses the SLOW filter. Optionally, the script can auto-tune the filter lengths by simulating many Fast/Slow combinations and selecting the pair with the best Profit Factor (PF).
What the Script Does
- Computes two 2‑pole Butterworth low‑pass filters on price.
- Enters LONG when FAST crosses above SLOW.
- Enters SHORT when FAST crosses below SLOW.
- Optionally simulates many Fast/Slow length combinations internally.
- Chooses the Fast/Slow pair with the highest Profit Factor.
- Trades only the selected best pair.
Manual Mode (Default)
1. Leave Auto‑Tune OFF.
2. Set:
- FAST cutoff period (bars)
- SLOW cutoff period (bars)
3. The strategy will trade using only these values.
Use this mode for normal trading or live deployment.
Auto‑Tune Mode
1. Enable Auto‑Tune.
2. Define Fast and Slow ranges:
- FAST min / max / step
- SLOW min / max / step
3. The script simulates ALL Fast × Slow combinations bar‑by‑bar.
4. Each combination tracks:
- Gross Profit
- Gross Loss
- Closed trades
- Profit Factor (PF = GP / GL)
5. At the end of the chart, the best PF pair is selected and used for trading.
Interpreting the End Box
The status label at the end of the chart reports:
- Whether Auto‑Tune is enabled
- Number of candidate pairs tested
- Best FAST period
- Best SLOW period
- Profit Factor of the best pair
- Win Rate (wins ÷ closed trades)
If PF is near 1.0 or trades are very low, expand the range or length of the test.
Best Practices
- Use Auto‑Tune ONLY for research and optimization.
- After finding good parameters, disable Auto‑Tune and trade manually.
- Keep Fast < Slow (logical separation).
- Longer charts produce more reliable PF results.
- Avoid very small step sizes (performance + noise).
Known Limitations
- Pine Script runs bar‑by‑bar; tuning is approximate, not vectorized.
- Large grids increase execution time.
- Results are historical and NOT predictive.
- Not suitable for live auto‑optimization.
Summary
This script is best viewed as a *research tool first, strategy second*. Use it to discover stable Fast/Slow regimes, then lock them in for simple, repeatable trading.

ES Multi-Timeframe SMC Entry SystemOverviewThis is a comprehensive Smart Money Concepts (SMC) trading strategy for ES1! (E-mini S&P 500) futures that provides simultaneous buy and sell signals across three timeframes: Daily, Weekly, and Monthly. It incorporates your complete entry checklists, confluence scoring system, and automated risk management.Core Features1. Multi-Timeframe Signal Generation
Daily Signals (D) - For intraday/swing trades (1-3 day holds)
Weekly Signals (W) - For swing trades (3-10 day holds)
Monthly Signals (M) - For position trades (weeks to months)
All three timeframes can trigger simultaneously (pyramiding enabled)
2. Smart Money Concepts ImplementationOrder Blocks (OB)
Automatically detects bullish and bearish order blocks
Bullish OB = Down candle before strong impulse up
Bearish OB = Up candle before strong impulse down
Validates freshness (< 10 bars = higher quality)
Visual boxes displayed on chart
Fair Value Gaps (FVG)
Identifies 3-candle imbalance patterns
Bullish FVG = Gap between high and current low
Bearish FVG = Gap between low and current high
Tracks unfilled gaps as targets/entry zones
Auto-removes when filled
Premium/Discount Zones
Calculates 50-period swing range
Premium = Upper 50% (short from here)
Discount = Lower 50% (long from here)
Deep zones (<30% or >70%) for higher quality setups
Visual shading: Red = Premium, Green = Discount
Liquidity Sweeps
Sell-Side Sweep (SSL) = False break below lows → reversal up
Buy-Side Sweep (BSL) = False break above highs → reversal down
Marked with yellow labels on chart
Valid for 10 bars after occurrence
Break of Structure (BOS)
Identifies when price breaks recent swing high/low
Confirms trend continuation
Marked with small circles on chart
3. Confluence Scoring SystemEach timeframe has a 10-point scoring system based on your checklist requirements:Daily Score (10 points max)
HTF Trend Alignment (2 pts) - 4H and Daily EMAs aligned
SMC Structure (2 pts) - OB in correct zone with HTF bias
Liquidity Sweep (1 pt) - Recent SSL/BSL occurred
Volume Confirmation (1 pt) - Volume > 1.2x 20-period average
Optimal Time (1 pt) - 9:30-12 PM or 2-4 PM ET (avoids lunch)
Risk-Reward >2:1 (1 pt) - Built into exit strategy
Clean Price Action (1 pt) - BOS occurred
FVG Present (1 pt) - Near unfilled fair value gap
Minimum Required: 6/10 (adjustable)Weekly Score (10 points max)
Weekly/Monthly Alignment (2 pts) - W and M EMAs aligned
Daily/Weekly Alignment (2 pts) - D and W trends match
Premium/Discount Correct (2 pts) - Deep zone + trend alignment
Major Liquidity Event (1 pt) - SSL/BSL sweep
Order Block Present (1 pt) - Valid OB detected
Risk-Reward >3:1 (1 pt) - Built into exit
Fresh Order Block (1 pt) - OB < 10 bars old
Minimum Required: 7/10 (adjustable)Monthly Score (10 points max)
Monthly/Weekly Alignment (2 pts) - M and W trends match
Weekly OB in Monthly Zone (2 pts) - OB in deep discount/premium
Major Liquidity Sweep (2 pts) - Significant SSL/BSL
Strong Trend Alignment (2 pts) - D, W, M all aligned
Risk-Reward >4:1 (1 pt) - Built into exit
Extreme Zone (1 pt) - Price <20% or >80% of range
Minimum Required: 8/10 (adjustable)4. Entry ConditionsDaily Long Entry
✅ Daily score ≥ 6/10
✅ 4H trend bullish (price > EMAs)
✅ Price in discount zone
✅ Bullish OB OR SSL sweep OR near bullish FVG
✅ NOT during avoid times (lunch/first 5 min)Daily Short Entry
✅ Daily score ≥ 6/10
✅ 4H trend bearish
✅ Price in premium zone
✅ Bearish OB OR BSL sweep OR near bearish FVG
✅ NOT during avoid timesWeekly Long Entry
✅ Weekly score ≥ 7/10
✅ Weekly trend bullish
✅ Daily trend bullish
✅ Price in discount
✅ Bullish OB OR SSL sweepWeekly Short Entry
✅ Weekly score ≥ 7/10
✅ Weekly trend bearish
✅ Daily trend bearish
✅ Price in premium
✅ Bearish OB OR BSL sweepMonthly Long Entry
✅ Monthly score ≥ 8/10
✅ Monthly trend bullish
✅ Weekly trend bullish
✅ Price in DEEP discount (<30%)
✅ Bullish order block presentMonthly Short Entry
✅ Monthly score ≥ 8/10
✅ Monthly trend bearish
✅ Weekly trend bearish
✅ Price in DEEP premium (>70%)
✅ Bearish order block present5. Automated Risk ManagementPosition Sizing (Per Entry)
Daily: 1.0% account risk per trade
Weekly: 0.75% account risk per trade
Monthly: 0.5% account risk per trade
Formula:
Contracts = (Account Equity × Risk%) ÷ (Stop Points × $50)
Minimum = 1 contractStop Losses
Daily: 12 points ($600 per contract)
Weekly: 40 points ($2,000 per contract)
Monthly: 100 points ($5,000 per contract)
Profit Targets (Risk:Reward)
Daily: 2:1 = 24 points ($1,200 profit)
Weekly: 3:1 = 120 points ($6,000 profit)
Monthly: 4:1 = 400 points ($20,000 profit)
Example with $50,000 AccountDaily Trade:
Risk = $500 (1% of $50k)
Stop = 12 points × $50 = $600
Contracts = $500 ÷ $600 = 0.83 → 1 contract
Target = 24 points = $1,200 profit
Weekly Trade:
Risk = $375 (0.75% of $50k)
Stop = 40 points × $50 = $2,000
Contracts = $375 ÷ $2,000 = 0.18 → 1 contract
Target = 120 points = $6,000 profit
Monthly Trade:
Risk = $250 (0.5% of $50k)
Stop = 100 points × $50 = $5,000
Contracts = $250 ÷ $5,000 = 0.05 → 1 contract
Target = 400 points = $20,000 profit
6. Visual Elements on ChartKey Levels
Previous Daily High/Low - Red/Green solid lines
Previous Weekly High/Low - Red/Green circles
Previous Monthly High/Low - Red/Green crosses
Equilibrium Line - White dotted line (50% of range)
Zones
Premium Zone - Light red shading (upper 50%)
Discount Zone - Light green shading (lower 50%)
SMC Markings
Bullish Order Blocks - Green boxes with "Bull OB" label
Bearish Order Blocks - Red boxes with "Bear OB" label
Bullish FVGs - Green boxes with "FVG↑"
Bearish FVGs - Red boxes with "FVG↓"
Liquidity Sweeps - Yellow "SSL" (down) or "BSL" (up) labels
Break of Structure - Small lime/red circles
Entry Signals
Daily Long - Small lime triangle ▲ with "D" below price
Daily Short - Small red triangle ▼ with "D" above price
Weekly Long - Medium green triangle ▲ with "W" below price
Weekly Short - Medium maroon triangle ▼ with "W" above price
Monthly Long - Large aqua triangle ▲ with "M" below price
Monthly Short - Large fuchsia triangle ▼ with "M" above price
7. Information TablesConfluence Score Table (Top Right)
┌──────────┬────────┬────────┬────────┐
│ TF │ SCORE │ STATUS │ SIGNAL │
├──────────┼────────┼────────┼────────┤
│ 📊 DAILY │ 7/10 │ ✓ PASS │ 🔼 │
│ 📈 WEEKLY│ 6/10 │ ✗ WAIT │ ━ │
│ 🌙 MONTH │ 9/10 │ ✓ PASS │ 🔽 │
├──────────┴────────┴────────┴────────┤
│ P&L: $2,450 │
└─────────────────────────────────────┘
Green scores = Pass (meets minimum threshold)
Orange/Red scores = Fail (wait for better setup)
🔼 = Long signal active
🔽 = Short signal active
━ = No signal
Entry Checklist Table (Bottom Right)
┌──────────────┬───┐
│ CHECKLIST │ ✓ │
├──────────────┼───┤
│ ━ DAILY ━ │ │
│ HTF Trend │ ✓ │
│ Zone │ ✓ │
│ OB │ ✗ │
│ Liq Sweep │ ✓ │
│ Volume │ ✓ │
│ ━ WEEKLY ━ │ │
│ W/M Align │ ✓ │
│ Deep Zone │ ✗ │
│ ━ MONTHLY ━ │ │
│ M/W/D Align │ ✓ │
│ Zone: Discount│ │
└──────────────┴───┘
Green ✓ = Condition met
Red ✗ = Condition not met
Real-time updates as market conditions change
8. Alert SystemIndividual Alerts:
"Daily Long" - Triggers when daily long setup appears
"Daily Short" - Triggers when daily short setup appears
"Weekly Long" - Triggers when weekly long setup appears
"Weekly Short" - Triggers when weekly short setup appears
"Monthly Long" - Triggers when monthly long setup appears
"Monthly Short" - Triggers when monthly short setup appears
Combined Alerts:
"Any Long Signal" - Catches any bullish opportunity (D/W/M)
"Any Short Signal" - Catches any bearish opportunity (D/W/M)
Alert Messages Include:
🔼/🔽 Direction indicator
Timeframe (DAILY/WEEKLY/MONTHLY)
Current confluence score

Liquidity Maxing [JOAT]Liquidity Maxing - Institutional Liquidity Matrix
Introduction
Liquidity Maxing is an open-source strategy for TradingView built around institutional market structure concepts. It identifies structural shifts, evaluates trades through multi-factor confluence, and implements layered risk controls.
The strategy is designed for swing trading on 4-hour timeframes, focusing on how institutional order flow manifests in price action through structure breaks, inducements, and liquidity sweeps.
Core Functionality
Liquidity Maxing performs three primary functions:
Tracks market structure to identify when control shifts between buyers and sellers
Scores potential trades using an eight-factor confluence system
Manages position sizing and risk exposure dynamically based on volatility and user-defined limits
The goal is selective trading when multiple conditions align, rather than frequent entries.
Market Structure Engine
The structure engine tracks three key events:
Break of Structure (BOS): Price pushes beyond a prior pivot in the direction of trend
Change of Character (CHoCH): Control flips from bullish to bearish or vice versa
Inducement Sweeps (IDM): Market briefly runs stops against trend before moving in the real direction
The structure module continuously updates strong highs and lows, labeling structural shifts visually. IDM markers are optional and disabled by default to maintain chart clarity.
The trade engine requires valid structure alignment before considering entries. No structure, no trade.
Eight-Factor Confluence System
Instead of relying on a single indicator, Liquidity Maxing uses an eight-factor scoring system:
Structure alignment with current trend
RSI within healthy bands (different ranges for up and down trends)
MACD momentum agreement with direction
Volume above adaptive baseline
Price relative to main trend EMA
Session and weekend filter (configurable)
Volatility expansion/contraction via ATR shifts
Higher-timeframe EMA confirmation
Each factor contributes one point to the confluence score. The default minimum confluence threshold is 6 out of 8, but you can adjust this from 1-8 based on your preference for trade frequency versus selectivity.
Only when structure and confluence agree does the strategy proceed to risk evaluation.
Dynamic Risk Management
Risk controls are implemented in multiple layers:
ATR-based stops and targets with configurable risk-to-reward ratio (default 2:1)
Volatility-adjusted position sizing to maintain consistent risk per trade as ranges expand or compress
Daily and weekly risk budgets that halt new entries once thresholds are reached
Correlation cooldown to prevent clustered trades in the same direction
Global circuit breaker with maximum drawdown limit and emergency kill switch
If any guardrail is breached, the strategy will not open new positions. The dashboard clearly displays risk state for transparency.
Market Presets
The strategy includes configuration presets optimized for different market types:
Crypto (BTC/ETH): RSI bands 70/30, volume multiplier 1.2, enhanced ATR scaling
Forex Majors: RSI bands 75/25, volume multiplier 1.5
Indices (SPY/QQQ): RSI bands 70/30, volume multiplier 1.3
Custom: Default values for user customization
For crypto assets, the strategy automatically applies ATR volatility scaling to account for higher volatility characteristics.
Monitoring and Dashboards
The strategy includes optional monitoring layers:
Risk Operations Dashboard (top-right):
Trend state
Confluence score
ATR value
Current position size percentage
Global drawdown
Daily and weekly risk consumption
Correlation guard state
Alert mode status
Performance Console (top-left):
Net profit
Current equity
Win rate percentage
Average trade value
Sharpe-style ratio (rolling 50-bar window)
Profit factor
Open trade count
Optional risk tint on chart background provides visual indication of "safe to trade" versus "halted" state.
All visualization elements can be toggled on/off from the inputs for clean chart viewing or full telemetry during parameter tuning.
Alerts and Automation
The strategy supports alert integration with two formats:
Standard alerts: Human-readable messages for long, short, and risk-halt conditions
Webhook format: JSON-formatted payloads ready for external execution systems (optional)
Alert messages are predictable and unambiguous, suitable for manual review or automated forwarding to execution engines.
Built-in Validation Suite
The strategy includes an optional validation layer that can be enabled from inputs. It checks:
Internal consistency of structure and confluence metrics
Sanity and ordering of risk parameters
Position sizing compliance with user-defined floors and caps
This validation is optional and not required for trading, but provides transparency into system operation during development or troubleshooting.
Strategy Parameters
Market Presets:
Configuration Preset: Choose between Crypto (BTC/ETH), Forex Majors, Indices (SPY/QQQ), or Custom
Market Structure Architecture:
Pivot Length: Default 5 bars
Filter by Inducement (IDM): Default enabled
Visualize Structure: Default enabled
Structure Lookback: Default 50 bars
Risk & Capital Preservation:
Risk:Reward Ratio: Default 2.0
ATR Period: Default 14
ATR Multiplier (Stop): Default 2.0
Max Drawdown Circuit Breaker: Default 10%
Risk per Trade (% Equity): Default 1.5%
Daily Risk Limit: Default 6%
Weekly Risk Limit: Default 12%
Min Position Size (% Equity): Default 0.25%
Max Position Size (% Equity): Default 5%
Correlation Cooldown (bars): Default 3
Emergency Kill Switch: Default disabled
Signal Confluence:
RSI Length: Default 14
Trend EMA: Default 200
HTF Confirmation TF: Default Daily
Allow Weekend Trading: Default enabled
Minimum Confluence Score (0-8): Default 6
Backtesting Considerations
When backtesting this strategy, consider the following:
Commission: Default 0.05% (adjustable in strategy settings)
Initial Capital: Default $100,000 (adjustable)
Position Sizing: Uses percentage of equity (default 2% per trade)
Timeframe: Optimized for 4-hour charts, though can be tested on other timeframes
Results will vary significantly based on:
Market conditions and volatility regimes
Parameter settings, especially confluence threshold
Risk limit configuration
Symbol characteristics (crypto vs forex vs equities)
Past performance does not guarantee future results. Win rate, profit factor, and other metrics should be evaluated in context of drawdown periods, trade frequency, and market conditions.
How to Use This Strategy
This is a framework that requires understanding and parameter tuning, not a one-size-fits-all solution.
Recommended workflow:
Start on 4-hour timeframe with default parameters and appropriate market preset
Run backtests and study performance console metrics: focus on drawdown behavior, win rate, profit factor, and trade frequency
Adjust confluence threshold to match your risk appetite—higher thresholds mean fewer but more selective trades
Set realistic daily and weekly risk budgets appropriate for your account size and risk tolerance
Consider ATR multiplier adjustments based on market volatility characteristics
Only connect alerts or automation after thorough testing and parameter validation
Treat this as a risk framework with an integrated entry engine, not merely an entry signal generator. The risk controls are as important as the trade signals.
Strategy Limitations
Designed for swing trading timeframes; may not perform optimally on very short timeframes
Requires sufficient market structure to identify pivots; may struggle in choppy or low-volatility environments
Crypto markets require different parameter tuning than traditional markets
Risk limits may prevent entries during favorable setups if daily/weekly budgets are exhausted
Correlation cooldown may delay entries that would otherwise be valid
Backtesting results depend on data quality and may not reflect live trading with slippage
Design Philosophy
Many indicators tell you when price crossed a moving average or RSI left oversold. This strategy addresses questions institutional traders ask:
Who is in control of the market right now?
Is this move structurally significant or just noise?
Do I want to add more risk given what I've already done today/week?
If I'm wrong, exactly how painful can this be?
The strategy provides disciplined, repeatable answers to these questions through systematic structure analysis, confluence filtering, and multi-layer risk management.
Technical Implementation
The strategy uses Pine Script v6 with:
Custom types for structure, confluence, and risk state management
Functional programming approach for reusable calculations
State management through persistent variables
Optional visual elements that can be toggled independently
The code is open-source and can be modified to suit individual needs. All important logic is visible in the source code.
Disclaimer
This script is provided for educational and informational purposes only. It is not intended as financial, investment, trading, or any other type of advice or recommendation. Trading involves substantial risk of loss and is not suitable for all investors. Past performance, whether real or indicated by historical tests of strategies, is not indicative of future results.
No representation is being made that any account will or is likely to achieve profits or losses similar to those shown. In fact, there are frequently sharp differences between backtested results and actual results subsequently achieved by any particular trading strategy.
The user should be aware of the risks involved in trading and should trade only with risk capital. The authors and publishers of this script are not responsible for any losses or damages, including without limitation, any loss of profit, which may arise directly or indirectly from use of or reliance on this script.
This strategy uses technical analysis methods and indicators that are not guaranteed to be accurate or profitable. Market conditions change, and strategies that worked in the past may not work in the future. Users should thoroughly test any strategy in a paper trading environment before risking real capital.
Commission and slippage settings in backtests may not accurately reflect live trading conditions. Real trading results will vary based on execution quality, market liquidity, and other factors not captured in backtesting.
The user assumes full responsibility for all trading decisions made using this script. Always consult with a qualified financial advisor before making investment decisions.
Enjoy - officialjackofalltrades

Heikin Ashi Wick Strategy
🔥 Heikin Ashi Wick Momentum Strategy
“Trade momentum decay before the trend breaks.
>> FOCUS ON WICKS, NOT ONLY CANDLE COLOR<<
What Makes This Different (Traffic Driver)
✔ Uses Heikin Ashi wicks (almost nobody does this correctly)
✔ Captures trend continuation, not breakouts
✔ Exits before momentum collapse, not after
✔ Non-repainting
✔ Clean charts, instant readability
This Strategy Is REALLY Trading
This is a Heikin Ashi momentum-decay system:
• Enters when trend is strong but not euphoric
• Exits when:
o Trend stops probing higher
o Sellers gain relative strength
It avoids:
• Chasing strong breakout candles
• Holding through momentum rollovers
Candle Type Used: Heikin Ashi (manually calculated)
NOTE: The script does not use regular candles.
It reconstructs Heikin Ashi (HA) candles from raw OHLC:
• HA Close = average of open, high, low, close
• HA Open = midpoint of prior HA candle (smoothed)
• HA High / Low = extremes of HA open/close vs real high/low
➡️ This filters noise and emphasizes trend structure and momentum.
Strengths
✅ Works well in strong, smooth trends
✅ Very clean logic (no indicators)
✅ Non-repainting
✅ Early exits protect capital
Best Use
This works best on:
• Daily timeframe
• Strong trend ETFs / megacaps
o QQQ
o SPY
o NVDA, MSFT, AAPL
• When combined with:
o EMA 21 trend filter (your preference)
o Market regime filter (e.g., above 50/200 SMA)
o Rising 10 EMA and 20 EMA
________________________________________
8️⃣ Weaknesses (Important)
⚠️ No stop loss (only structure-based exits)
⚠️ Can exit too early in explosive trends
⚠️ Will chop in sideways markets
⚠️ No volatility filter (ATR, EMA, regime)
How to Avoid the Weaknesses — Summary
Turn the setup from a concept into a robust strategy by adding these controls:
1. Trade Only Trends
o Require price above EMA-21 (optionally EMA-21 > EMA-50)
o Eliminates chop and sideways markets
2. Improve Exits (Avoid Leaving Winners Too Early)
o Partial exit when upper wick disappears
o Full exit only when lower wick dominates
o Optional: require 2 consecutive exit candles
3. Add Risk Protection
o Use a volatility stop: ~1.5× ATR(14) below entry or below HA swing low
o Protects against gaps and sudden reversals
4. Filter Weak Signals
o Require meaningful wick size (≈30–40% of candle range)
o Avoids low-quality indecision candles
5. Avoid Bad Volatility
o Skip entries when ATR is expanding aggressively
o Focus on calmer, controllable trends
6. Limit Time in Trade
o Add a max bars hold (e.g., 10–15 bars on daily)
o Prevents capital getting stuck in fading trends
⚠️ Educational use only. Not financial advice. Trading involves risk and losses can exceed expectations. Past performance does not guarantee future results. Use at your own risk.

EMA and Dow Theory Strategies V2📘 Overview
This strategy is an advanced evolution of the original EMA × Dow Theory hybrid model. V2 introduces true swing‑based trend detection, gradient trend‑zones, higher‑timeframe swing overlays, and dynamic exit logic designed for intraday to short‑term trading across crypto, forex, stocks, and indices.
The system provides precise entries, adaptive exits, and highly visual guidance that helps traders understand trend structure at a glance.
🧠 Key Features
🔹 1. Dual‑EMA Trend Logic (Symbol + External Index)
Both the chart symbol and an external index (OTHERS.D) are evaluated using fast/slow EMAs to determine correlation‑based trend bias.
🔹 2. Dow Theory Swing Detection (Real‑time)
The script identifies swing highs/lows and updates trend direction when price breaks them. This creates a structural trend model that reacts faster than EMAs alone.
🔹 3. Gradient Trend Zones (Visual Trend Strength)
When trend is up or down, the area between price and the latest swing level is filled with a multi‑step gradient. This makes trend strength and distance-to-structure visually intuitive.
🔹 4. Higher‑Timeframe Swing Trend (htfTrend)
Swing highs/lows from a higher timeframe (e.g., 4H) are plotted to show macro structure. Used only for visual context, not for filtering entries.
🔹 5. RSI‑Based Entry Protection
RSI prevents entries during extreme overbought/oversold conditions.
🔹 6. Dynamic Exit System
Includes:
Custom stop‑loss (%)
Partial take‑profit (TP1/TP2/TP3)
Automatic scale‑out when trend color weakens
“Color‑change lockout” to prevent immediate re‑entry
Real‑time PnL tracking and labels
🔹 7. Alerts for All Key Events
Entry, stop‑loss, partial exits, and trend‑change exits all generate structured JSON alerts.
🔹 8. Visual PnL Labels & Equity Tracking
PnL for the latest trade is displayed directly on the chart, including scale‑out adjustments.
⚙️ Input Parameters
Parameter Description
Fast EMA / Slow EMA EMAs used for symbol trend detection
Index Fast / Slow EMA EMAs applied to external index
StopLoss (%) Custom stop‑loss threshold
Scale‑Out % Portion to exit when trend color weakens
RSI Period / Levels Overbought/oversold filters
Swing Detection Length Bars used to detect swing highs/lows
Stats Display Position of statistics table
🧭 About htfTrend (Higher Timeframe Trend)
The higher‑timeframe swing trend is displayed visually but not used for entry logic.
Why? Strict HTF filtering reduces trade frequency and often removes profitable setups. By keeping it visual‑only, traders retain flexibility while still benefiting from macro structure awareness.
Use it as a contextual guide, not a constraint.
📘 概要
本ストラテジーは、V1 を大幅に拡張した EMA × ダウ理論 × スイング構造 × 上位足トレンド可視化 の複合型モデルです。 短期〜デイトレード向けに最適化されており、仮想通貨・FX・株式・指数など幅広いアセットで利用できます。
V2 では、スイング構造の自動検出、グラデーションによるトレンド強度の可視化、上位足スイングライン、動的な利確/損切りロジック が追加され、視覚的にもロジック的にも大幅に強化されています。
🧠 主な機能
🔹 1. 銘柄+外部インデックスの EMA クロス判定
対象銘柄と OTHERS.D の EMA を比較し、相関を考慮したトレンド方向を判定します。
🔹 2. ダウ理論に基づくスイング高値・安値の自動検出
スイング更新によりトレンド方向を切り替える、構造ベースのトレンド判定を採用。
🔹 3. グラデーション背景によるトレンド強度の可視化
スイングラインから現在価格までを段階的に塗り分け、 「どれだけトレンドが伸びているか」を直感的に把握できます。
🔹 4. 上位足スイングトレンド(htfTrend)の表示
4H などの上位足でのスイング高値・安値を表示し、 大局的なトレンド構造を視覚的に把握できます(ロジックには未使用)。
🔹 5. RSI による過熱・売られすぎフィルター
極端な RSI 状態でのエントリーを防止。
🔹 6. 動的イグジットシステム
カスタム損切り(%)
TP1/TP2/TP3 の段階的利確
トレンド色の弱まりによる自動スケールアウト
色変化後の再エントリー制限(waitForColorChange)
リアルタイム PnL の追跡とラベル表示
🔹 7. アラート完備(JSON 形式)
エントリー、損切り、部分利確、トレンド反転などすべてに対応。
🔹 8. 損益ラベル・統計表示
直近トレードの損益をチャート上に表示し、視覚的に把握できます。
⚙️ 設定項目
設定項目名 説明
Fast / Slow EMA 銘柄の EMA 設定
Index Fast / Slow EMA 外部インデックスの EMA 設定
損切り(%) カスタム損切りライン
部分利確割合 トレンド弱化時のスケールアウト割合
RSI 期間・水準 過熱/売られすぎフィルター
スイング検出期間 スイング高値・安値の検出に使用
統計表示位置 テーブルの表示位置
🧭 上位足トレンド(htfTrend)について
上位足スイングの更新に基づくトレンド判定を表示しますが、 エントリー条件には使用していません。
理由: 上位足を厳密にロジックへ組み込むと、トレード機会が大幅に減るためです。
本ストラテジーでは、 「大局の把握は視覚で、エントリーは柔軟に」 という設計思想を採用しています。
→ 裁量で利確判断や逆張り回避に活用できます。

extradestrategy super BTCUSD M15cocok untuk btc usd tidak di perjual belikan harap tidak menggunakan sembarangan


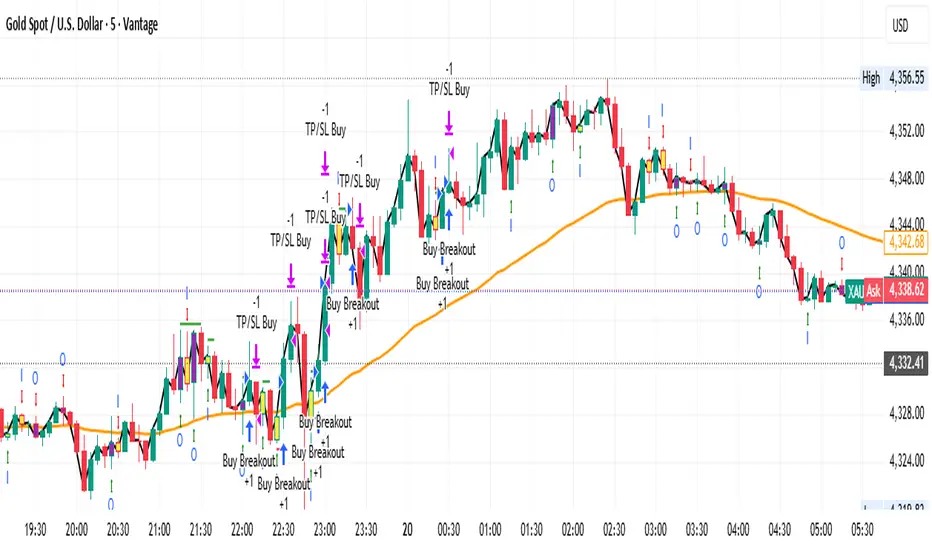
Gold M5 Scalping (Strategy)This is the New Strategy for my new Indicator for M5 Scalping.
Just to test my result.
Will release my indicator soon