Daily ADR TableDaily ADR Table Indicator
The Daily Average Daily Range (ADR) Table displays real-time volatility statistics directly on your chart. It shows both the current day's range and the historical average daily range as percentages of the current price, providing essential volatility metrics for trading decisions.
The indicator tracks today's range in real-time throughout the trading session using session-based calculations to ensure accuracy. It compares this against a customizable historical average (default 20 days, adjustable from 1-500 days) to help traders assess whether current volatility is above or below normal levels.
All values are displayed as percentages for easy comparison across different price levels and formatted to two decimal places for precision. The table position, text size, alignment, and colors are fully customizable with nine position options and professional default styling optimized for readability.
This indicator is valuable for day traders, swing traders, and market analysts who need to quickly assess current market volatility relative to historical norms. It assists in position sizing decisions, setting stop losses, and identifying potential breakout or consolidation scenarios based on range expansion or contraction.
Percent

Custom Performance TableThis script generates a table designed to provide a concise yet highly customizable overview of the performance of multiple financial instruments, displayed directly on the chart. The table can include up to 40 tickers, each individually configurable, with values updated in real time based on either the current chart timeframe or a specific user-selected timeframe.
NOTE : The update frequency of the table values depends on the refresh rate of the chart's main ticker to which the indicator is applied. To ensure a consistent and reliable data feed, especially when monitoring heterogeneous instruments, it is recommended to apply the indicator to a highly liquid and continuously traded asset, such as BTCUSD.
PERFORMANCE CALCULATION MODES
You can choose from three different performance calculation modes:
1) Change % (Percentage Change)
Displays the percentage change of the current price compared to the previous candle within the selected timeframe.
(Current Price - Previous Price) / Previous Price * 100
This mode provides an immediate and straightforward measure of each instrument's percentage movement, useful for quick visual comparisons of relative strength among assets.
2) Z-Score
The Z-Score measures how much the current price variation deviates from the historical average variation, relative to the standard deviation of those variations.
(Current Variation - Average Variation) / Standard Deviation of Variations
The result indicates how statistically unusual a movement is:
- Values near 0 suggest normal variations.
- Values above ±2 indicate statistically significant deviations.
This is a valuable tool for identifying overbought/oversold conditions or market stress events and is often used in mean reversion strategies.
NOTE : Due to technical constraints, Z-Score can only be calculated when the selected timeframe matches the chart's timeframe exactly.
3) RAROC (Risk-Adjusted Return on Capital)
RAROC expresses an asset's performance in relation to the risk taken, measured through its volatility (standard deviation of price).
Percentage Change / Standard Deviation of Price
It allows for an assessment of return efficiency in relation to volatility.
A high RAROC value indicates a high return relative to the risk, making it a useful tool for comparing assets with different risk profiles. It is especially suitable for portfolio selection and allocation purposes.
TABLE CONFIGURATION
Each ticker can be customized with its own label, colors, and position in the table.
Each row can display the ticker name or a custom label, which, at the user's discretion, can either replace the name or be shown as an informational tooltip.
The table can be placed anywhere on the chart using horizontal and vertical offset parameters. Thanks to offset support, you can, for example, create financial market overview layouts. This can be done by completely “cleaning” the chart from price and indicators using TradingView settings, and then displaying multiple tables simultaneously (see the example chart published here).
Advanced customization options are also available for the table's appearance, including font settings, colors, borders, and more.
CALCULATION TIMEFRAME
The indicator allows the user to force a specific timeframe (Daily, Weekly, Monthly, Yearly) when applied to intraday charts.
However, for Z-Score mode, the selected timeframe must match the chart's timeframe exactly to ensure correct computation. Otherwise, the script will halt until settings are properly adjusted.
USAGE NOTES
Custom Performance Table is a flexible and adaptable tool, suitable for both intraday operations and medium- to long-term analysis. It is designed for traders and analysts who need to compare assets based on quantitative metrics, whether simple (like percentage change) or more advanced and risk-adjusted (such as Z-Score and RAROC).

Smart % Levels📈 Smart % Levels – Visualize Significant Percentage Moves
What it does:
This indicator plots horizontal levels based on a percentage change from the previous day's close (or open, if selected). It allows traders to visualize price movements relative to meaningful thresholds like ±1%, ±2%, etc.
What makes it different:
Unlike other level indicators, Smart % Levels only displays the relevant levels based on current price action. This avoids clutter by showing only the levels that are being approached or crossed by the current price. It's a clean and dynamic way to visualize key price zones for intraday analysis.
How it works:
- Select between using the previous day's Close or Open as the reference
- Choose the percentage spacing between levels (e.g., 1%, 0.5%, etc.)
- Enable optional labels to see the exact percentage of each level
- Automatically filters levels to only show those between yesterday's price and today's current price
- Includes customization for colors, line styles, widths, and opacity
Best for:
Day traders and scalpers who want a quick, clean view of how far the current price has moved from yesterday’s reference, without being overwhelmed by unnecessary lines.
Extra notes:
- The levels are recalculated each day at the market open
- All graphics reset at the start of each session to maintain clarity
- This script avoids repainting by only plotting levels relative to available historical data (no lookahead)
This tool is for informational purposes only and should not be considered as financial advice. Always do your own research before making trading decisions.

Percentage Based ZigZag█ OVERVIEW
The Percentage-Based ZigZag indicator is a custom technical analysis tool designed to highlight significant price reversals while filtering out market noise. Unlike many standard zigzag tools that rely solely on fixed price moves or generic trend-following methods, this indicator uses a configurable percentage threshold to dynamically determine meaningful pivot points. This approach not only adapts to different market conditions but also helps traders distinguish between minor fluctuations and truly significant trend shifts—whether scalping on shorter timeframes or analyzing longer-term trends.
█ KEY FEATURES & ORIGINALITY
Dynamic Pivot Detection
The indicator identifies pivot points by measuring the percentage change from the previous extreme (high or low). Only when this change exceeds a user-defined threshold is a new pivot recognized. This method ensures that only substantial moves are considered, making the indicator robust in volatile or noisy markets.
Enhanced ZigZag Visualization
By connecting significant highs and lows with a continuous line, the indicator creates a clear visual map of price swings. Each pivot point is labelled with the corresponding price and the percentage change from the previous pivot, providing immediate quantitative insight into the magnitude of the move.
Trend Reversal Projections
In addition to marking completed reversals, the script computes and displays potential future reversal points based on the current trend’s momentum. This forecasting element gives traders an advanced look at possible turning points, which can be particularly useful for short-term scalping strategies.
Customizable Visual Settings
Users can tailor the appearance by:
• Setting the percentage threshold to control sensitivity.
• Customizing colors for bullish (e.g., green) and bearish (e.g., red) reversals.
• Enabling optional background color changes that visually indicate the prevailing trend.
█ UNDERLYING METHODOLOGY & CALCULATIONS
Percentage-Based Filtering
The script continuously monitors price action and calculates the relative percentage change from the last identified pivot. A new pivot is confirmed only when the price moves a preset percentage away from this pivot, ensuring that minor fluctuations do not trigger false signals.
Pivot Point Logic
The indicator tracks the highest high and the lowest low since the last pivot. When the price reverses by the required percentage from these extremes, the algorithm:
1 — Labels the point as a significant high or low.
2 — Draws a connecting line from the previous pivot to the current one.
3 — Resets the extreme-tracking for detecting the next move.
Real-Time Reversal Estimation
Building on traditional zigzag methods, the script incorporates a projection calculation. By analyzing the current trend’s strength and recent percentage moves, it estimates where a future reversal might occur, offering traders actionable foresight.
█ HOW TO USE THE INDICATOR
1 — Apply the Indicator
• Add the Percentage-Based ZigZag indicator to your trading chart.
2 — Adjust Settings for Your Market
• Percentage Move – Set a threshold that matches your trading style:
- Lower values for sensitive, high-frequency analysis (ideal for scalping).
- Higher values for filtering out noise on longer timeframes.
• Visual Customization – Choose your preferred colors for bullish and bearish signals and enable background color changes for visual trend cues.
• Reversal Projection – Enable or disable the projection feature to display potential upcoming reversal points.
3 — Interpret the Signals
• ZigZag Lines – White lines trace significant high-to-low or low-to-high movements, visually connecting key swing points.
• Pivot Labels – Each pivot is annotated with the exact price level and percentage change, providing quantitative insight into market momentum.
• Trend Projections – When enabled, projected reversal levels offer insight into where the current trend might change.
4 — Integrate with Your Trading Strategy
• Use the indicator to identify support and resistance zones derived from significant pivots.
• Combine the quantitative data (percentage changes) with your risk management strategy to set optimal stop-loss and take-profit levels.
• Experiment with different threshold settings to adapt the indicator for various instruments or market conditions.
█ CONCLUSION
The Percentage-Based ZigZag indicator goes beyond traditional trend-following tools by filtering out market noise and providing clear, quantifiable insights into price action. With its percentage threshold for pivot detection and real-time reversal projections, this original methodology and customizable feature set offer traders a versatile edge for making informed trading decisions.

Percent Change HistogramThis indicator shows you percent changes in a super visual way using a color-coded histogram.
Here's how the colors work:
🟩 Dark green = percent change is growing stronger
🟢 Light green = still positive but losing steam
🟥 Dark red = getting more negative
🔴 Light red = negative but improving
The cool part? You can set any lookback period you want. For example:
24 periods on 1H chart = last 24 hours
30 periods on daily = last month
7 periods on daily = last week
Pro tip: You're not locked to your chart's timeframe! Want to see monthly changes while trading on 5min?
No problem.
You can even stack multiple indicators to watch different intervals simultaneously (daily, weekly, monthly) - super helpful for multi-timeframe analysis.
Perfect for spotting momentum shifts across different timeframes without switching between charts.

Percentage Calculator by Akshay GaurThis indicator calculates and displays percentage levels above and below the current price. It allows you to easily identify any percentage levels which can be used in many things like creating strangles and straddles and make informed trading decisions. The indicator automatically adjusts and redraws the lines and labels on the latest bar to reflect real-time market conditions.
Key Features:
• Calculates percentage levels above and below the current price
• Displays percentage levels on big labels with the horizontal lines on the chart
• Allows you to adjust the percentage value and every details.
• Allows you to see Fluctuation line on the chart.
How to Use:
1. Set the percentage value to the desired level (e.g. 1%, 2%, etc.)
2. If you want to see Fluctuation lines also then turn on it from Input settings.
3. Use the displayed levels to identify desired percentage levels.
4. Make informed trading decisions based on the calculated levels

Support/Resistance Strength [UAlgo]The Support/Resistance Strength indicator is a tool designed for traders seeking a precise understanding of key support and resistance levels in the market. This tool dynamically identifies and visualizes support and resistance zones based on pivot points and strength criteria, providing traders with actionable insights for better decision-making.
By incorporating features such as ATR-based or percentage-based channel calculations, customizable strength thresholds, and intuitive visualization of key levels, the indicator caters to traders of various skill levels and strategies. It also adapts dynamically to market conditions, allowing users to identify frequently tested zones with minimal manual input.
🔶 Key Features
Dynamic Support and Resistance Zones
Automatically detects significant support and resistance levels using pivot high and low calculations.
Offers ATR-based or percentage-based channel customization to cater to diverse trading styles.
Customizable Parameters
Lookback period for pivot calculations, strength threshold, and maximum stored pivots are fully adjustable.
Display options for showing specific numbers of recent support/resistance lines.
Intuitive Visualization
Highlights key support and resistance levels with color-coded lines and labels.
Includes percentage deviation from the current price for quick assessment.
Interactive Updates
Continuously updates support and resistance levels to reflect changing market dynamics.
Displays pivot points visually for enhanced clarity.
Can be used effectively on various timeframes, from intraday to daily and weekly charts.
🔶 Interpreting the Indicator
Identifying Key Levels
Support levels are indicated by green (lime) lines and resistance levels by red lines. The transparency of colors is adjustable for visual preference.
Labels display the exact price level and the percentage difference from the current price.
Strength Threshold
The "Minimum S/R Strength" parameter defines how frequently a level must be tested to be considered significant.
Higher strength values indicate zones that have been tested more frequently, suggesting stronger support or resistance.
Pivot Points
The indicator marks pivot high and low points on the chart to provide a visual representation of the calculated levels.
Dynamic Updates
The indicator adapts to the most recent price action. If the price moves above a resistance level or below a support level, the color of the lines and labels will dynamically change to reflect the current price positioning.
🔶 Disclaimer
Use with Caution: This indicator is provided for educational and informational purposes only and should not be considered as financial advice. Users should exercise caution and perform their own analysis before making trading decisions based on the indicator's signals.
Not Financial Advice: The information provided by this indicator does not constitute financial advice, and the creator (UAlgo) shall not be held responsible for any trading losses incurred as a result of using this indicator.
Backtesting Recommended: Traders are encouraged to backtest the indicator thoroughly on historical data before using it in live trading to assess its performance and suitability for their trading strategies.
Risk Management: Trading involves inherent risks, and users should implement proper risk management strategies, including but not limited to stop-loss orders and position sizing, to mitigate potential losses.
No Guarantees: The accuracy and reliability of the indicator's signals cannot be guaranteed, as they are based on historical price data and past performance may not be indicative of future results.

Percent % Change Since Specific Date / TimeFUNCTIONS
- User specified Date/Time of importance
- Calculate the percent change since user input date/time to current price
- Plot a line at user input date/time
USAGE
You want to see how much price has changed since a certain important date/time.
Example important date: Trump win, FED rate change, Earnings, etc.

Average True Range with Price MAATR with Price Moving Average Indicator
This custom indicator combines the Average True Range (ATR) with a Price Moving Average (MA) to help traders analyze market volatility in percent to the price.
Key Components:
Average True Range (ATR)
Price Moving Average (MA)
ATR/Price in Percent
ATR/Price in Percent
Purpose: This ratio helps traders understand the relative size of the ATR compared to the current price, providing a clearer sense of how significant the volatility is in proportion to the price level.
Calculation: ATR is divided by the current closing price and multiplied by 100 to express it as a percentage. This makes it easier to compare volatility across assets with different price ranges.
Plot: This is plotted as a percentage, making it easier to gauge whether the volatility is proportionally high or low compared to the asset's price.
Usage:
This indicator is designed to help identify the most volatile tokens, making it ideal for configuring a Grid Bot to maximize profit. By focusing on high-volatility assets, traders can capitalize on larger price swings within the grid, increasing the potential for more profitable trades.
Features:
Customizable Smoothing Method: Choose from RMA (Relative Moving Average), SMA (Simple Moving Average), EMA (Exponential Moving Average), or WMA (Weighted Moving Average) for both ATR and the Price Moving Average.
Dual Perspective: The indicator provides both volatility analysis (ATR) and trend analysis (Price MA) in a single view.
Proportional Volatility: The ATR/Price (%) ratio adds a layer of context by showing how volatile the asset is relative to its current price.

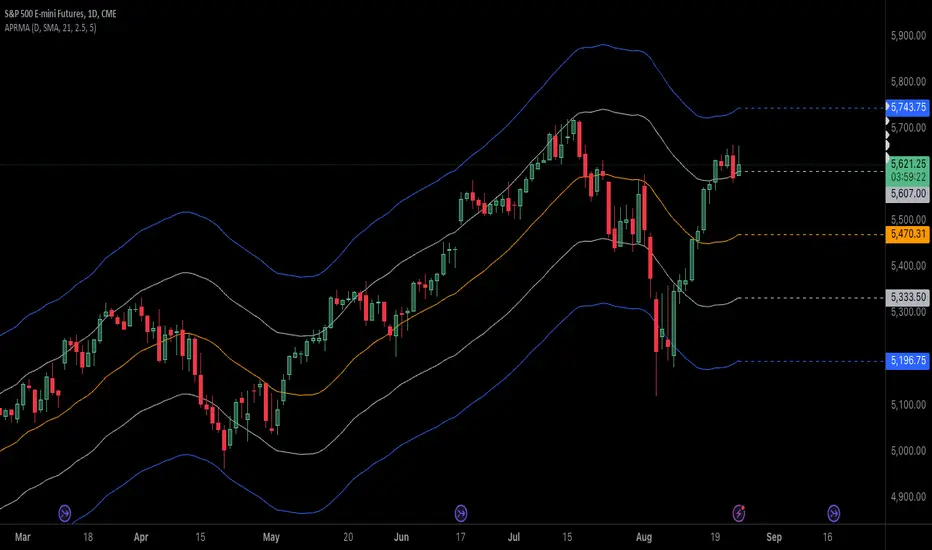
Adjustable Percentage Range Moving AverageAdjustable Percentage Range Moving Average (APRMA)
The Adjustable Percentage Range Moving Average (APRMA) is a technical analysis tool designed for traders and market analysts who seek a dynamic approach to understanding market volatility and trend identification. Unlike traditional moving averages, the APRMA incorporates user-adjustable percentage bands around a central moving average line, offering a customizable view of price action relative to its recent history.
Key Features:
Central Moving Average: At its core, APRMA calculates a moving average (type of your choice) of the price over a specified number of periods, serving as the baseline for the indicator.
Percentage Bands: Surrounding the moving average are four bands, two above and two below, set at user-defined percentages away from the central line. These bands expand and contract based on the percentage input, not on standard deviation like Bollinger Bands, which allows for a consistent visual interpretation of how far the price has moved from its average.
Customizability: Users can adjust:
The length of the moving average period to suit short-term, medium-term, or long-term analysis.
The percentage offset for the bands, enabling traders to set the sensitivity of the indicator according to the asset's volatility or their trading strategy.
Visual Interpretation:
When the price moves towards or beyond the upper band, it might indicate that the asset is potentially overbought or that a strong upward trend is in place.
Conversely, price action near or below the lower band could suggest an oversold condition or a strong downward trend.
The space between the bands can be used to gauge volatility; narrower bands suggest lower current volatility relative to the average, while wider bands indicate higher volatility.
Usage in Trading:
Trend Confirmation: A price staying above the moving average and pushing the upper band might confirm an uptrend, while staying below and testing the lower band could confirm a downtrend.
Reversion Strategies: Traders might look for price to revert to the mean (moving average) when it touches or crosses the bands, setting up potential entry or exit points.
Breakout Signals: A price moving decisively through a band after a period of consolidation within the bands might signal a breakout.
The APRMA provides a clear, adaptable framework for traders to visualize where the price stands in relation to its recent average, offering insights into potential overbought/oversold conditions, trend strength, and volatility, all tailored by the trader's strategic preferences.
Donchian Channels StrengthTL;DR - A different approach calculating strength based on Donchain channels
My approach calculating strength by using the difference between price and donchain average. It is possible to use the highest/lowest value of a given source (like close) or to use the highest high/lowest low (by using the option 'include wicks') for the strength calculation
I added multiple moving averages which can be used in the calculations incl. SMMA (RMA) which is used in RSI calculation and works best for me.
Usage is similar to RSI: DC Strength oscillates between 0 and 100. Low values (<20) indicate a bearish situation while high values (>80) indicate bullish ones. Center line (50) crossings can also indicate a possible trend change.

ADR % RangesThis indicator is designed to visually represent percentage lines from the open of the day. The % amount is determined by X amount of the last days to create an average...or Average Daily Range (ADR).
1. ADR Percentage Lines: The core function of the script is to apply lines to the chart that represent specific percentage changes from the daily open. It first calculates the average over X amount of days and then displays two lines that are 1/3rd of that average. One line goes above the other line goes below. The other two lines are the full "range" of the average. These lines can act as boundaries or targets to know how an asset has moved recently. *Past performance is not indicative of current or future results.
The calculation for ADR is:
Step 1. Calculate Today's Range = DailyHigh - DailyLow
Step 2. Store this average after the day has completed
Step 3. Sum all day's ranges
Step 4. Divide by total number of days
Step 5. Draw on chart
2. Customizable Inputs: Users have the flexibility to customize the script through various inputs. This includes the option to display lines only for the current trading day (`todayonly`), and to select which lines are displayed. The user can also opt to show a table the displays the total range of previous days and the average range of those previous days.
3. No Secondary Timeframe: The ADR is computed based on whatever timeframe the chart is and does not reference secondary periods. Therefore the script cannot be used on charts greater than daily.
This script is can be used by all traders for any market. The trader might have to adjust the "X" number of days back to compute a historical average. Maybe they only want to know the average over the past week (5 days) or maybe the past month (20 days).

% Chg LinesThis indicator is designed to visually represent percentage changes from the previous day's close.
1. Percentage Change Lines : The core function of the script is to apply lines to the chart that represent specific percentage changes from the previous day's closing price. It can display up to five different percentage levels, ranging from 0.50% to 2.50% by default but the user can set any value that they wish. This feature allows users to quickly gauge how the current price is performing relative to the previous day's close.
2. Customizable Inputs : Users have the flexibility to customize the script through various inputs. This includes the option to display lines only for the current trading day (`todayonly`), and to select which specific percentage change levels to plot (`show_pct1` to `show_pct5`).
3. Dynamic Calculation : The script dynamically calculates the previous day's closing price by making a request security call and uses it as a baseline to determine the percentage change levels.
% Change = (y2-y1)/y1*100
4. Positive and Negative Changes : It plots both positive and negative percentage changes, allowing users to see areas of potential resistance and support based on historical closing data.
This script is can be used by all traders for any market. The trader might have to adjust the %Chg input amount, but most financial instruments do see "reactions" at certain % intervals.

Multiple Percentile Ranks (up to 5 sources at a time)This indicator is a visual percentile rank indicator that can display 1 to 5 sources at one time.
The options:
“Sources”
Choose the number of sources you would like to display. The minimum is 1, the maximum is 5.
“Label percent position”
The label for the current percentage of where the source candle ranks.
“Label position”
This displays the source/s you’ve selected, and the chosen bottom rank % and top rank %.
“Label text size”
Displays the text size of all labels.
“Display current % labels”
Switches the labels on/off only for the current percentage rank of each source.
Source options:
ATR: Average True Range
CCI: Commodity Channel Index
COG: Centre of Gravity
Close: closing price
Close Percent: close percentage from previous close
Dollar Value: volume * (high * low * close / 3)
EOM: Ease of Movement: how much volume it takes to move the price in a certain direction
OBV: On-Balance Volume
RANGE: percentage range of the close price
RSI: Relative Strength Index
RVI: Relative Vigor Index
Time Close: if you select the 1 second timeframe it will provide the gap of time between each 1 second close
Volume: each bar’s volume
Volume (MA): volume moving average
Source # where # is the number of the source. Selects the source you’d like.
Ma Length is the number of previous candles to consider when calculating the moving average of the source. Note, the “MA Length” only applies to sources that have the “(MA)” at the end of their name.
Bottom % is the bottom percentage rank of the source you’ve selected. This is a filter to display the candle line graph in red once the percentage rank is equal to the percentage you’ve chosen or below.
Top % is the top percentage rank of the source you’ve selected. This is a filter to display the candle line graph in green once the percentage rank is equal to the percentage you’ve chosen or higher.
A simple example of how to use the indicator:
Select the dropdown menu for source 1 and select volume.
As the candles populate, it will look at previous candles and assign a percentage rank of where the candles are in relation to previous candles.
*Note, the way Tradingview works is it will populate the first candle the chart was active, and continue on. So, let’s say the 3rd candle was the highest volume day. This candle will show up as 100%. If the next day, the 4th candle has an even higher volume, it will show up as 100% also, the previous candles won’t “repaint” to other values and are instead set based on when they were confirmed. So, this indicator works best when there are a lot of previous candles to compare itself to.
To use the bottom % rank filter enter a percentage such as 5%. As it comes across a candle that is 5% or less compared to previous volume candles, then the line graph will shade in red.
The same can be said for the top % rank. So, if you want to see the line graph change to green when it comes across the top 99th percentile rank of volume bars, then set the top % rank to 1% and it will give you extremely high-volume bars in green instead of blue.

Scalp Pump-Dump Detector with AlertsThis script displays the percentage of movement of all candles on the chart, as well as identifying abnormal movements to which you can attach alerts. An abnormal movement is considered a rise or fall that exceeds the parameter set in the settings (by default, 1% per 1 bar).
Added a function to display the volume on abnormal candlesticks.

Percent Change of Day [ilovealgotrading]
OVERVIEW:
This indicator aims to effectively show us the percentage change of the price within the time frame we have chosen.
What is the purpose of this indicator?
This indicator shows how the price changes for each bar at different time frames we have chosen. By examining the percentage change in different time periods, we can easily look at the change in the face of the market during the time interval. Also if the price is above or below the value of 0 during the specified time, the color of our percentage line changes.
IMPLEMENTATION DETAILS:
First of all, let's understand How to Calculate Percent Change?
The difference between the old and new value of a quantity given in percentages is known as a percent change. It's rather simple to calculate the % difference between two given quantities.
The formula is given by;
Example
The price of a kilo of rice went from 10$ to12.5$, what is the percentage change?
Explanation
• The old value of sugar = $ 10
• New value = $12.5
• Now apply the percent change formula;
• Percentage change = ×100%
= x 100%
= (2.5/10) x 100%
= 25%
In this case, the percent change is positive and therefore, it is an increase.
How Is Percentage Change Used in Finance?
In the world of finance, percentage change is frequently used to analyze changes in the value of stocks or major market indexes over time.
Percentage change is used for many purposes in finance, most notably to track the price change of stocks market and crypto market.
What can we change from the settings panel ?
We can set time frame setting of the percentage change from place number 1
We are able to adjust the changing color if the percentage change is above or below zero from place 2 and 3
ALSO:
Please do not open trades without properly managing your risk and psychology!!!
If you have any ideas what to add to my work to add more sources or make calculations cooler, suggest in DM .
Higher High & Higher Low (Live) ━ [whvntr]This indicator is based on the trading formation Higher high and Higher low. It dynamically displays the current price above the bar on a label.
Features:
• If the current price is lower than the previous high the label color will dim.
• If the current price is lower than the previous low the price figure will turn red.
• Completely customizable
• Inspired by the Price label written by Westy_ , I have written different functions (coding) to make this indicator what it is.
These are not buy and sell signs, it's based on the HH & HL trading formation.

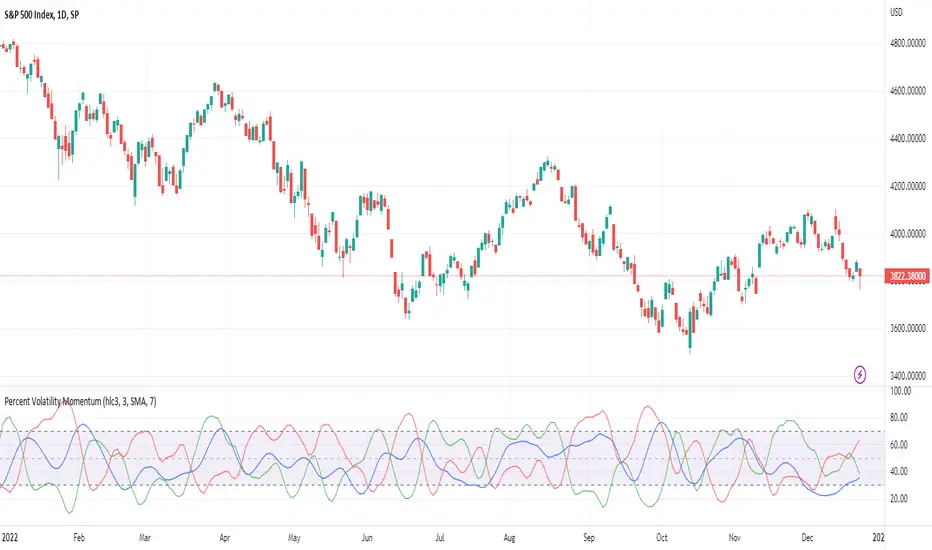
Percent Volatility MomentumThis pine script calculates percent volatility momentum, negative percent volatility and positive percent volatility. The blue line is the overall momentum of the current percent volatility trend. The red line only includes negative movements in the percent volatility of the source. The green line includes only positive movements of the percent volatility of the source. The script also includes an angle and a normalized angle setting that allows one to determine the angle of the source curve. Note, the angle was transformed from -90 to 90 to 0 to 100. Such that an angle of -90 is transformed to 0. An angle of 0 is transformed to 50 and an angle of 90 is transformed to 100. This is the first draft of this script and my first pine script published. Any feedback is welcome. I borrowed code from TradingView's Linear Regression Channel and Relative Strength Index pine scripts.
Percent ResearchPercent Research is an indicator that will plot a color / column on the chart in case custom requirements are met.
The requirements are:
- Price : Price requirement (equal or above input).
- Change % Up : Amount the price have moved up in percent (equal or above input).
- Change % Down : Amount the price have moved down in percent (equal or below input).
- Change Interval : Amount of bars the above move happened over.
- Volume : Volume requirement (equal or above input).
- Volume Interval : Amount of bars in a row that each require the above volume.
Example: In case one wants to plot whenever price has made a 20 percent move up or down in a week with minimum 100 000 volume for each of the last 2 days one can use.
Change % Up: 20
Change % Down: -20
Change Interval: 5
Volume: 100 000
Volume Interval: 2
The indicator will plot a color on the chart whenever the requirements are met, which then can be used to look into price action for each colored time period.
The values can be customized dependent on preference, example 100% movers over a month or 20% movers over a week etc.

Abnormal bar % v.1This script helps you find abnormal bars on the charts.
An abnormal bar is a bar that is larger than the adjacent bar by at least 50 percent.
The script can search for bars on any time frame.
The search for an abnormal bar, is possible in two ways:
- on the absolute value, for example - all that is higher than 0.5% is considered an abnormal bar, on different timeframes it is necessary to change the percentage values;
- on the basis of the ATR, in my opinion it is a more objective result.
In the settings available:
- choice of color to display percentages on the screen;
- choice of calculation method;
- Selecting the value - what is considered an abnormal bar.
======
Данный скрипт помогает найти на графиках аномальные бары.
Аномальный бар - это бар который, больше рядом стоящего бара как минимум на 50 процентов.
Скрипт может искать бары на любом тайм-фрейма.
Поиск аномального бара, возможен в двух вариантах:
- по абсолютному значению, например - всё что выше 0.5%, считается аномальным баром, на разных тайм-фреймах нужно менять значения процентов;
- на основание ATR, на мой взгляд это более объективный результат.
В настройках доступно:
- выбор цвета для отображения процентов на экране;
- выбор способа поиска;
- выбор значения - что считаем аномальным баром.
==

inChart - LibLibrary "inChart"
determine if price value is between chart high + x% and low - x% on the visible chart.
inChart()

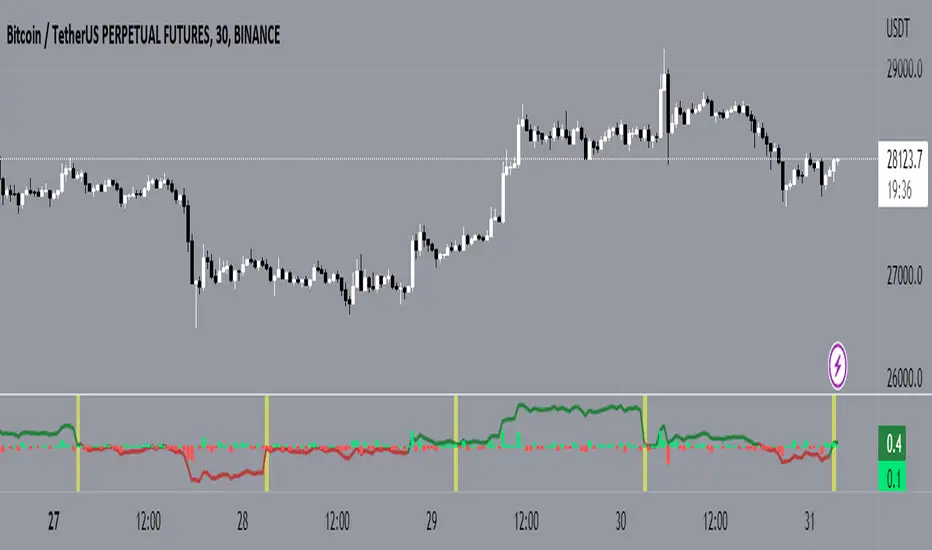
Bull/Bear Candle % Oscillator█ OVERVIEW
This script determines the proportion of bullish and bearish candles in a given sample size. It will produce an oscillator that fluctuates between 100 and -100, where values > 0 indicate more bullish candles in the sample and values < 0 indicate more bearish candles in the sample. Data produced by this oscillator is normalized around the 50% value, meaning that an even 50/50 split between bullish and bearish candles makes this oscillator produce 0; this oscillator indirectly represents the percent proportion of bullish and bearish candles in the sample (see HOW TO USE/INTERPRETATION OF DATA ).
It has two overarching settings: 'classic' and 'range'.
█ CONCEPTS
This script will cover concepts related to candlestick analysis, volumetric analysis, and lower timeframes.
Candlestick Analysis - The idea behind this script is to solely look at the candlesticks themselves and derive information from them in a given sample. It separates candles into two categories, bullish (close > open) and bearish (close < open).
If the indicator's setting is set to 'classic', the size of candles do not matter and all are assigned a value of 1 or 0.
If the indicator's setting is set to 'range', specific candle ranges modify the proportion of bullish/bearish values. Bullish candle values include all bullish candles in the set from their lows to the close, plus the lower wicks of all bearish candles. Bearish candle values include all bearish candles in the set from their highs to the close, plus the upper wicks of all bullish candles.
Volumetric Analysis - One of this script's features allows the user to modify the bullish and bearish candle proportions by its 'weight' determined by its volume compared to the sample set's total volume. Volumetric analysis for the 'range' setting are more complex than 'classic' as described below.
Lower Timeframes - For volumetric analysis to be done on candle wicks, there needed to be a way to determine how much volume had occurred in the wick by itself to find the weight of upper and lower wicks. To accomplish this, I employed PineScrypt's request.security_lower_tf function to grab OHLC values of lower timeframe candles (as well as volume) to determine how much volume had occurred in the wicks of the chart resolution's candle. The default OHLC values used here are the lows for upper wicks and highs for lower wicks. These OHLC values are then compared to the chart resolution candle's close to determine if the volume of that lower timeframe candle should be shifted to the wick weight or stay in the current weight of that candle. The reason 'low' and 'high' are used here is to guarantee that 100% of the volume of a lower timeframe candle had occurred in the wick of the candle at the current resolution (see LIMITATIONS ).
Bullish candles will exclude volume of all lower timeframe candles whose lows were greater than that candle's close. Bearish candles will exclude volume of all lower timeframe candles whose highs were less than that candle's close. These wick volumes are then divided by the volume of the sample set, and wick sizes are then multiplied by this weight before being added to their specific bullish/bearish sums (lower wicks to bullish and upper wicks to bearish).
█ FEATURES
There are 13 inputs for the user to modify the behavior/visual representation of this script.
Sample Length - This determines how many candles are in the sample set to find the proportion of bullish and bearish candles.
Colors and Invert Colors - There are three colors set by the user: a bullish color, neutral color, and bearish color. The oscillator plots two lines, one at 0 and another that represents the proportion of bullish or bearish candles in the sample set (we'll call this the 'signal line'). If the oscillator is above 0, bullish color is used, bearish otherwise. This script generates a gradient to color a filled area between the 0 line and the signal line based on the historical values of the oscillator itself and the signal line. For bullish values, the closer the signal line is to the max (or restricted max described below) that the oscillator has experienced, the more colored toward bullish color the shaded area will be, using the neutral color as a starting point. The same is applied to the bearish values using the bearish color.
There is an additional input to invert the colors so that the bearish color is associated with bullish values and vise-versa.
Calculation Type - This determines the overarching behavior of the oscillator and has two settings:
Classic - The weight of candles are either 1 if they occurred and 0 if not.
Range - The weight of candles is determined by the size of specific sections as described in CONCEPTS - Candlestick Analysis .
Volume Weighted - This enables modifying the weights of candles as described in CONCEPTS - Volumetric Analysis and Lower Timeframes based on which Calculation Type is used.
Wick Slice Resolution - This is the lower timeframe resolution that will be used to slice the chart resolution's candle when determining the volumetric weight of wicks. Lower timeframe resolutions like '1 minute' will yield more precise results as they will give more data points to go off of (see LIMITATIONS ).
Upper/Lower Wick Source - These two inputs allow the user to select which OHLC values to compare against the chart resolution's candle close when determining which lower timeframe candles will have their volumes associated with the wicks of candles being analyzed at the chart's resolution.
Restrict Min/Max Data and Restriction - This will restrict the maximum and minimum values that will be used for the signal line when comparing its value to previous oscillator values and change how the color gradient is generated for the indicator. Restriction is the number of candles back that will determine these maximum and minimum values.
Display Min/Max Guide - This will plot two lines that are colored the corresponding bullish and bearish colors which follow what the maximum and minimum values are currently for the oscillator.
█ HOW TO USE/INTERPRETATION OF DATA
As mentioned in the OVERVIEW section, this oscillator provides an indirect representation of the percent proportion of bullish or bearish candles in a given sample. If the oscillator reads 80, this does not mean that 80% of all candles in the sample were bullish . To find the percentage of candles that were bullish or bearish, the user needs to perform the following:
50% + ((|oscillator value| / 100) * 50)%
If the oscillator value is negative, the value from above will represent the percentage of bearish candles in the sample. If it is positive, this value represents the percentage of bullish candles in the sample.
Example 1 (oscillator value = 80):
50% + ((|80| / 100) * 50)%
50% + ((0.80) * 50)%
50% + 40% = 90%
90% of the candles in the sample were bullish.
Example 2 (oscillator value = -43):
50% + ((|-43| / 100) * 50)%
50% + ((0.43) * 50)%
50% + 21.5% = 71.5%
71.5% of the candles in the sample were bearish.
An example use of this indicator would be to put in a 'buy' order when its value shows a significant proportion of the sampled candles were bearish, and put in a 'sell' order when a significant proportion of candles were bullish. Potential divergences of this oscillator may also be used to plan trades accordingly such as bearish divergence - price continues higher as the oscillator decreases in value and vise-versa.*
* Nothing in this script constitutes any form of financial advice. The user is solely responsible for their trading decisions and I will not be held liable for any losses or gains incurred with the use of this script. Please proceed with caution when using this script to assist with trading decisions.
█ LIMITATIONS
Range Volumetric Weights :
Because of the conditions that must be met in order for volume to be considered part of wicks, it is possible that the default settings and their intended reasoning will not produce reliable results. If all lower timeframe candles have highs or lows that are within the body of the candle at the chart's resolution, the volume for the wicks will effectively be 0, which is not an accurate representation of those wicks. This is one of the reasons why I included the ability to change the source values used for these conditions as certain OHLC values may produce more reliable/intended results under these conditions.
Wick Slice Resolution :
PineScript restricts the number of intrabar references to 100,000 total. This script uses 3 separate request.security_lower_tf calls and has a default resolution of 1 minute. This means that if the user were to set the oscillator to the Range setting, enable volume weighted, and had the Wick Slice Resolution set to 1 minute, this script will exceed this 100,000 reference restriction within 24 days of data and will not produce any results beyond the previous 23.14 days.
Below are example uses of all the different settings of this script, these are done on the 1D chart of COINBASE:BTCUSD :
Default Settings:
Classic - Volume Weighted:
Range - no Volume Weight:
Range - Volume Weighted (1 min slices):
Range - Volume Weighted (1 hour slices):
Display Min/Max Guide - No Restriction:
Display Min/Max Guide - Restriction:
Invert Colors:

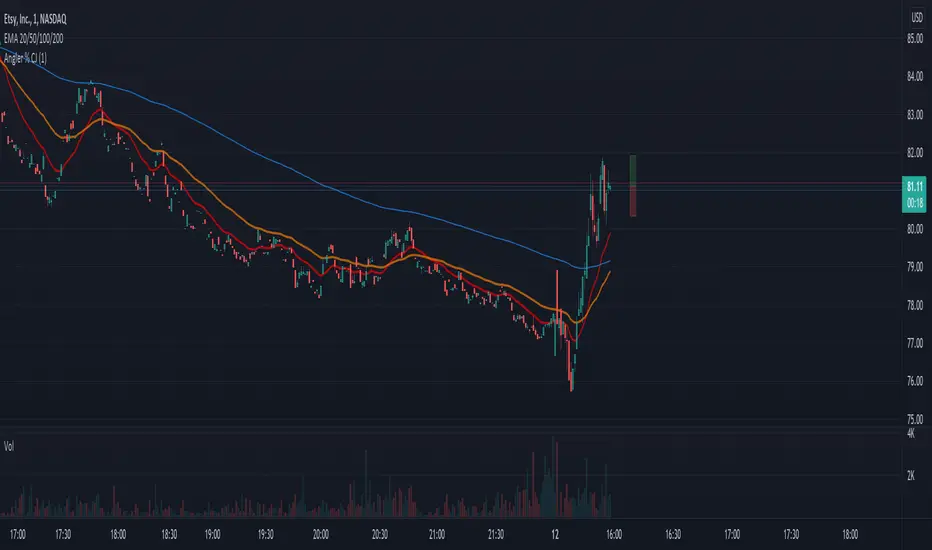
Front Angler Percent CJA nice little gadget.
Can be used to visually hint on volatility.
Will show a leading vertical bar which shows percentage of price, both up and down, in relation to current price.