Overnight vs Intra-day Performance█ STRATEGY OVERVIEW
The "Overnight vs Intra-day Performance" indicator quantifies price behaviour differences between trading hours and overnight periods. It calculates cumulative returns, compound growth rates, and visualizes performance components across user-defined time windows. Designed for analytical use, it helps identify whether returns are primarily generated during market hours or overnight sessions.
█ USAGE
Use this indicator on Stocks and ETFs to visualise and compare intra-day vs overnight performance
█ KEY FEATURES
Return Segmentation : Separates total returns into overnight (close-to-open) and intraday (open-to-close) components
Growth Tracking : Shows simple cumulative returns and compound annual growth rates (CAGR)
█ VISUALIZATION SYSTEM
1. Time-Series
Overnight Returns (Red)
Intraday Returns (Blue)
Total Returns (White)
2. Summary Table
Displays CAGR
3. Price Chart Labels
Floating annotations showing absolute returns and CAGR
Color-coded to match plot series
█ PURPOSE
Quantify market behaviour disparities between active trading sessions and overnight positioning
Provide institutional-grade attribution analysis for returns generation
Enable tactical adjustment of trading schedules based on historical performance patterns
Serve as foundational research for session-specific trading strategies
█ IDEAL USERS
1. Portfolio Managers
Analyse overnight risk exposure across holdings
Optimize execution timing based on return distributions
2. Quantitative Researchers
Study market microstructure through time-segmented returns
Develop alpha models leveraging session-specific anomalies
3. Market Microstructure Analysts
Identify liquidity patterns in overnight vs daytime sessions
Research ETF premium/discount mechanics
4. Day Traders
Align trading hours with highest probability return windows
Avoid overnight gaps through informed position sizing
Performance

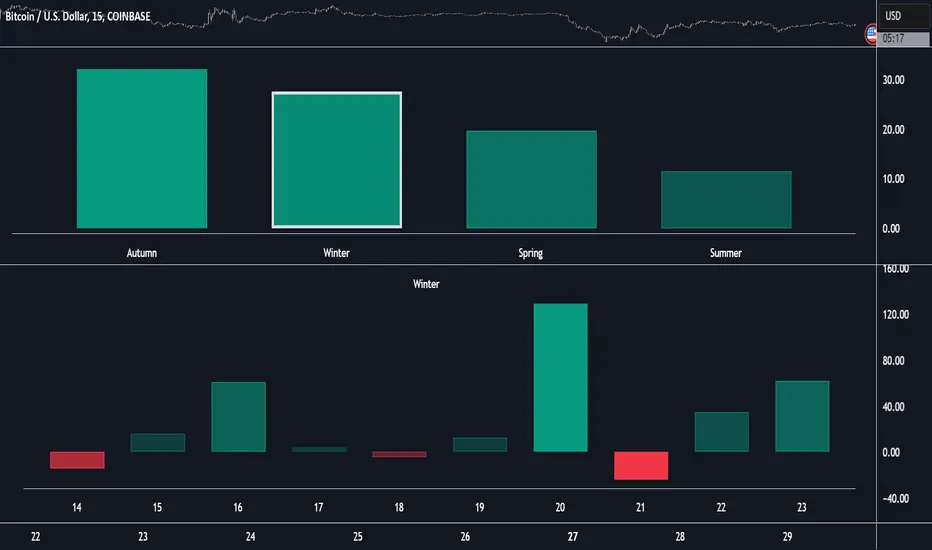
Market Performance by Yearly Seasons [LuxAlgo]The Market Performance by Yearly Seasons tool allows traders to analyze the average returns of the four seasons of the year and the raw returns of each separate season.
🔶 USAGE
By default, the tool displays the average returns for each season over the last 10 years in the form of bars, with the current session highlighted as a bordered bar.
Traders can choose to display the raw returns by year for each season separately and select the maximum number of seasons (years) to display.
🔹 Hemispheres
Traders can select the hemisphere in which they prefer to view the data.
🔹 Season Types
Traders can select the type of seasons between meteorological (by default) and astronomical.
The meteorological seasons are as follows:
Autumn: months from September to November
Winter: months from December to February
Spring: months from March to May
Summer: months from June to August
The astronomical seasons are as follows:
Autumn: from the equinox on September 22
Winter: from the solstice on December 21
Spring: from the equinox on March 20
Summer: from the solstice on June 21
🔹 Displaying the data
Traders can choose between two display modes, average returns by season or raw returns by season and year.
🔶 SETTINGS
Max seasons: Maximum number of seasons
Hemisphere: Select NORTHERN or SOUTHERN hemisphere
Season Type: Select the type of season - ASTRONOMICAL or METEOROLOGICAL
Display: Select display mode, all four seasons, or any one of them
🔹 Style
Bar Size & Autofit: Select the size of the bars and enable/disable the autofit feature
Labels Size: Select the label size
Colors & Gradient: Select the default color for bullish and bearish returns and enable/disable the gradient feature
Annual Performance Table with Average PeformanceAn indicator that displays annual performance in a table format, providing a quick overview of yearly returns with historical context.
It calculates the performance based on the first and last monthly close prices of each year. It displays returns chronologically from left to right, concluding with an average performance column.
Features :
Works exclusively on monthly timeframes
Customizable number of years to display (1-50 years)
Shows year-by-year performance percentages
Color-coded returns (green for positive, red for negative)
Includes average performance across displayed years
Semi-transparent overlay design for better chart visibility
Performance calculation method:
Performance = ((December Close - January Close) / January Close) × 100%
Usage :
Apply to any chart on monthly timeframe
Adjust the "Number of Years to Display" parameter as needed
Table appears as an overlay with years, individual performances, and average
Note: The indicator will display an error message if applied to any timeframe other than monthly.

Relative Performance Indicator by ComLucro - 2025_V01The "Relative Performance Indicator by ComLucro - 2025_V01" is a powerful tool designed to analyze an asset's performance relative to a benchmark index over multiple timeframes. This indicator provides traders with a clear view of how their chosen asset compares to a market index in short, medium, and long-term periods.
Key Features:
Customizable Lookback Periods: Analyze performance across three adjustable periods (default: 20, 50, and 200 bars).
Relative Performance Analysis: Calculate and visualize the difference in percentage performance between the asset and the benchmark index.
Dynamic Summary Label: Displays a detailed breakdown of the asset's and index's performance for the latest bar.
User-Friendly Interface: Includes customizable colors and display options for clear visualization.
How It Works:
The script fetches closing prices of both the asset and a benchmark index.
It calculates percentage changes over the selected lookback periods.
The indicator then computes the relative performance difference between the asset and the index, plotting it on the chart for easy trend analysis.
Who Is This For?:
Traders and investors who want to compare an asset’s performance against a benchmark index.
Those looking to identify trends and deviations between an asset and the broader market.
Disclaimer:
This tool is for educational purposes only and does not constitute financial or trading advice. Always use it alongside proper risk management strategies and backtest thoroughly before applying it to live trading.
Chart Recommendation:
Use this script on clean charts for better clarity. Combine it with other technical indicators like moving averages or trendlines to enhance your analysis. Ensure you adjust the lookback periods to match your trading style and the timeframe of your analysis.
Additional Notes:
For optimal performance, ensure the benchmark index's data is available on your TradingView subscription. The script uses fallback mechanisms to avoid interruptions when index data is unavailable. Always validate the settings and test them to suit your trading strategy.

PSE, Practical Strategy EnginePSE, Practical Strategy Engine
A ready-to-use engine that is simple to connect your indicator to, simple to use, and effective at generating alerts for order-filled events during the real-time candle.
Great for
• Evaluating indicators on important metrics without the need to write a strategy script for backtesting.
• Using indicators with built-in risk management.
About The PSE
This engine accepts entry and exit signals from your indicator to provide trade signals for both long and short positions. The PSE was written for trading Funds (e.g. ETF’s), Stocks, Forex, Futures, and Cryptocurrencies. The trades on the chart indicate market, limit, and stop orders. The PSE allows for backtesting of trades along with metrics of performance based on trade-groups with many great features.
Note: A link to a video of how to connect your indicator(s) to the PSE is provided below.
Key Features
Trade-Grp’s
A Trade-Grp makes up one or more trade positions from the first position entering to the last position exiting. Using Trade-Grp’s instead of positions should help you better assess if the metric results fit your trading style.
Below are two (2) examples of a Trade-Grp with three (3) positions.
Metrics
A table of metrics is available if the “Show Metrics Table” checkbox is enabled on the Inputs tab, but metrics always show in the Data Window.
Examples of the Metrics Table are shown below.
• ROI (Return on Investment) and CAGR (Compound Annual Growth Rate) are based on the Avg Invest/Trade-Grp and are adjusted for dividends if the “Include Dividends in Profit” checkbox is enabled.
• Profit/Risked is based on Trade-Grp’s. Also known as reward/risk, as well as expectancy per amount risked. It determines the effectiveness of your strategy and provides a measure of comparison between your strategies. This is adjusted for dividends if the “Include Dividends in Profit” checkbox is enabled. In the Data Window the color is green when above the breakeven point of making a profit and red when below the breakeven point. In the Table the color is red if below the breakeven point, otherwise it is the default color. For example, using the 3 metrics tables above:
For every USD risked the profit is 1.709 USD.
For every BTC risked the profit is 0.832 BTC.
For every JPY risked the profit is 0.261 JPY.
• Winning % is based on Trade-Grp’s. In the Data Window the color is green when above the breakeven point of making a profit and red when below the breakeven point. In the Table the color is red if below the breakeven point, otherwise it is the default color.
The breakeven point is a relationship between the Profit/Risked and Winning % to indicate system profitability potential. Another way to assess trading system performance. For example, for a low Winning % a high Profit/Risked is needed for the system to be potentially profitable.
• Profit Factor (PF) is based on Trade-Grp’s. The dividend payment, if any, is not considered in the calculation of a win or loss. The “Include Dividends in Profit Factor” checkbox allows you the option to either include or not include dividends in the calculation of Profit Factor. The default is enabled.
Must enable the “Include Dividends in Profit” checkbox to include dividends in PF.
Including dividends in PF evaluates the trading strategy with a more overall profitability performance view.
Enable/Disable “Include Dividends in Profit Factor” checkbox also affects the Avg Trade-Grp Loss, and thus Equity Loss from ECL and % Equity Loss from ECL.
• Max Consecutive Losses are based on Trade-Grp’s.
• Nbr of Trade-Grp’s and Nbr of Positions.
These help you to determine if enough trades have occurred to validate your strategy. The Nbr of Positions is the count of positions on the chart. The TV list of trades in the Strategy Tester may indicate more than what is actually shown on the chart. The Data Window includes 'Nbr Strat Tester Trades', which equals the TV listing trades, to help you locate specific trades on the chart.
• Time in Market (%) is based on Trade-Grp’s and date range selected.
• Avg Invest/Trade-Grp will indicate the average amount of money invested in a Trade-Grp. This is adjusted for dividends if the “Include Dividends in Profit” checkbox is enabled.
• Equivalent Consecutive Losses, labeled as Equiv. Cons. Losses (ECL).
This value is determined by the Winning % and Nbr of Trade-Grp’s. This simulates the more likely case of a series of losses, then a small win, then another series of losses to form an equivalent consecutive losing streak. To lower the value, increase the Winning %.
• Equity Loss from ECL is the equity loss from the equivalent consecutive losses.
• % Equity Loss from ECL is the percent of equity loss from the equivalent consecutive losses.
Risk Management
• Pyramid rules enforce and maintain position sizing designated by you on the Inputs tab (% Equity to Risk, Up/Dwn Gap) & Properties tab (number of pyramids, slippage, and commission).
A pyramid position will not occur unless both its stop covers the last entry price with gap/slippage and commission cost of previous trade is covered. If take profit is enabled, a pyramid position will not occur unless commission cost of the trade is covered when take profit target is reached.
• Position sizing, stop-loss (SL), trailing stop-loss (TSL), and take profit (TP) are used.
• Wash sale prevention for applicable assets is enforced. Wash sale assets include stock and fund (e.g. ETF’s).
• No more than one entry position per candle is enforced .
Other Great Features
• Losing Trade-Grp’s indicated at the exit with label text in the color blue. Used to easily find consecutive losses affecting your strategy’s performance. The dividend payment, if any, is not considered in the calculation of a win or loss.
• Position values can be displayed on the chart. The number format is based on the min tick value, but is limited to 8 decimal places only for display purposes.
• Dividends per share and the amount can be displayed on the chart.
• Hold Days . This is the number of days to hold before allowing the next Trade-Grp. Can be a decimal number. This feature may help those trading on a cash account to avoid any settlement violations when trading the same asset.
• Date Filter. Partition the time when trading is allowed to see if the strategy works well across the date range selected. The metrics should be acceptable across all four (4) time ranges: entire range, 1st half, IQR (inter-quartile range), and 2nd half.
• Price gap amount identification. Used in determining if a pyramid entry may be profitable, and may be used in determining slippage amount to use.
• When TP is enabled, the PSE will only allow a pyramid position if the potential is profitable based on commission and price gap selected.
• Trade-Grp’s shown in background color: green for long positions and red for short positions.
• The PSE will alert you to update your stop-loss as the market changes if your exchange/broker does not allow for trailing stop-loss orders. Enable this option on the Inputs tab with Alert Chg TSL.
• The PSE will alert you if your drawdown exceeds Max % Equity Drawdown set on the Inputs tab.
• The PSE will send an alert to warn you of an expiring GTC order.
Some brokers will indicate the order is GTC, Good 'Till Cancelled, but there really is a time limit on the order and is typically 60-120 days. Therefore, the PSE will alert you if you've been in position for close to 60 days so you can refresh your order. The alert is typically a few days before the 60-day time period.
• For order fill alerts just use a {{placeholder}} in the Message of the alert. Details on how to enter placeholders is explained below.
• Identify same bar enter/exit for first entries and pyramids. This is shown in the Data Window as well. This can help you determine what stop-loss % works best for your trading style.
• Leverage trading information is displayed in the Data Window and applies to Trade-Grps.
Failed PosSize or Margin (%): Shows a zero if the failed-to-trade position size was less than 1 or shows the margin % which failed to meet the margin requirement set in the Properties tab. A flag will show on the bar where a failed-to-trade occurred. This is only applicable to the first position of a Trade-Grp. Position the cursor over the flag for the value to show in the Data Window.
Notional Value: total Trade-Grp position size x latest entry price x point value. The equity must be > notional value x margin requirement for a trade to occur.
Current Margin (%): must be greater than margin requirement set on the Properties tab in order for a trade to occur.
Margin Call Price: when enabled on the Style tab is displayed on both the chart and the Data Window as shown below.
PSE Settings
Pyramids
• Pyramiding requires the Stop Method to be set to either TSL or Both (meaning SL & TSL).
• The maximum number of pyramids is determined by the value entered in the Properties tab.
• Pyramid orders require the enter price to be higher than the previous close for Longs and lower than the previous close for Shorts.
• Pyramids also require the stop with gap/slippage to be higher than the last entry price for Longs, and lower than the last entry price for Shorts. This covers all previous positions and maintains position sizing.
• When take profit, TP, is enabled, the pyramids also require that they will be profitable when opening a position assuming they will reach TP. This is automatically adjusted by you with the Dwn Gap/Up Gap, Slippage, and Commission settings.
Inputs Tab
General Settings
Color Traded Background
Enable to change background color where in a trade. Green for long positions and red for short positions.
Show Losing Trade-Grp
Enable to show if losing Trade-Grp and is indicated by text in blue color. The last position may be at a loss, but if there was profit for the Trade-Grp, then it will not be shown as a loss .
Show Position Values
Enable to show the currency value of each position in gold color.
Include Dividends in Profit
This feature is only applicable if the asset pays dividends and the time frame period of the chart is 1D or less, otherwise ignored. The PSE assumes dividends are taken as cash and not reinvested.
Enable to adjust ROI, CAGR, Profit/Risked, Avg Invest/Trade-Grp, and Equity to include dividend payments. This feature considers if you were in position at least one day prior to the ex-dividend date and had not exited until after the ex-dividend date.
When Show Dividends is enabled it will display the payout in currency/share, as well as the total amount based on the number of shares the position(s) of the Trade-Grp are currently holding.
Include Dividends in Profit Factor
This checkbox allows you the option to either include or not include dividends in the calculation of Profit Factor. Must enable the “Include Dividends in Profit” checkbox to include dividends in PF. The dividend payment, if any, is not considered in the calculation of a win or loss.
Show Metrics Table
Options are font size and table location.
Alert Failed to Trade
Enable for the strategy to alert you when a trade did not happen due to low equity or low order size. Applicable only for the first position of a Trade-Grp.
Trade Direction
Options are 'Longs Only', 'Both', 'Shorts Only'.
Hold Days
This is the number of days to hold before allowing the next Trade-Grp. Applies only to the first trade position of a Trade-Grp. Where a Trade-Grp consists of the first position plus any pyramid positions.
The value entered will be overwritten to >= 31 to prevent wash sale for applicable assets in the event the last Trade-Grp was a loss. Wash sale assets include stock and fund (i.e. ETF’s).
The minimum value is the equivalent of 1 candle and is automatically assigned by the PSE if the entered value is equivalent to less than one candle. To calculate Hold Days in # of candles on the Hour chart divide the chart period by 24 x #candles. On the Minute chart divide the chart period by 60 then by 24 x #candles.
Show Vertical Lines at From Date & To Date
Shows a vertical dotted line at the From Date and To Date for visual inspection of the setting.
Date Filter
When enabled, trades are allowed between the From Date and To Date, i.e., the date range.
When disabled, trades are allowed for all candles.
Partition the time when trading is allowed to see if your indicator settings work well across the date range. Click 1st Half, IQR (inter-quartile range), or 2nd Half buttons to trade a portion of the date range.
Select only one at-a-time to partition the time when trading is allowed.
When 1st Half is enabled only trades for the 1st half of the date range are allowed.
When IQR is enabled only trades for the inter-quartile date range are allowed.
When 2nd Half is enabled only trades for the 2nd half of the date range are allowed.
Position Sizing
The % of Equity to Risk has been separated into two (2) areas: for initial trades and for pyramid trades. This allows for greater ability to maximize profits within your acceptable drawdown. A variation of the Anti-Martingale method from the initial trade if you choose to use it in that manner.
% Equity to Risk for Initial Trades: enter the percent of equity you want to risk per position for the initial trades of each Trade-Grp. For example, for 1% enter 1.
% Equity to Risk for Pyramid Trades: enter the percent of equity you want to risk per position for the pyramid trades of each Trade-Grp. For example, for 2% enter 2.
% Equity for Max Position Size: the position size will not exceed this amount. For example, for 25% enter 25.
Max % Equity Drawdown Warning: an alert will be triggered if the maximum drawdown exceeds this v alue. For example, for 10% enter 10.
Stop Methods
NOTE: The Stop Method must be either Both or TSL in order for the pyramids to work. This feature enforces position sizing.
Stop-loss, SL, and trailing stop-loss, TSL, are other features that enforce risk management.
The trailing stop-loss, TSL, is activated immediately if Stop Method = TSL. If Stop Method = Both, then the TSL is activated when its value is above stop-loss, SL, for Longs and below the SL for Shorts.
The calculated TSL value (shown on the chart by + symbol) of the previous bar is used for the current bar and the plot value is off by default, but you can it turn on via the Style tab. This is available so you can better understand how the TSL value used was calculated from. It is beneficial to show when monitoring the real-time candle.
Alert Chg TSL
When enabled, this feature will alert you to update your stop price if it moves greater than the change amount in %. The amount is the absolute % so will work for both Longs and Shorts. For example, for 1% enter 1 . This is provided since some exchanges/brokers do not offer TSL orders and you must manually adjust as price action plays out.
The alert will also suggest a stop limit price based on the gap selected and explained below.
The alert will occur at the close of the candle at the calculated TSL value of the candle just prior to the real-time candle.
Dwn Gap/Up Gap Input Settings
A price gap is the difference between the closing price of the previous candle and the opening price of the current candle. Dwn Gap and Up Gap are illustrated here.
The values of the Dwn Gap and Up Gap can be seen in the Data Window and are based on the settings of the Date Filter.
The options are “zero gap”, "median gap", "avg gap", "80 pct gap", "90 pct gap". The X pct gap stands for X percentile rank. For example, "80 pct gap" means that 80% of the gaps are less than or equal to the value shown in the Data Window. Select “zero gap” to disable this feature.
If Show Stop Limit is enabled, it will show a dotted-line below or above the current stop price where a stop-limit order should be taken. It is shown based on the gap option selected. Again, the PSE trades market, limit, and stop orders, but a stop-limit may be shown if you wanted to see where one would be set using the Up/Dwn Gap.
Dwn Gap: Affects Short Take Profit, Long Pyramid Entries, and to show the Long Stop Limit.
Up Gap : Affects Long Take Profit, Short Pyramid Entries, and to show the Short Stop Limit.
Fixed Take Profit (TP)
When take profit (TP) is enabled, the PSE will determine if opening a pyramid position will be in profit assuming the TP will be hit while considering commission costs (on Properties tab).
The larger of Up Gap or Slippage value is used with Long positions regarding TP.
The larger of Dwn Gap or Slippage value is used with Short positions regarding TP.
Properties Tab
• Initial Capital: Set as desired.
• Base Currency: Leave as Default. The PSE is designed to use the instrument’s currency, therefore leave as Default.
• Order Size: Leave as default. This setting has been disabled and position sizing is handled on the Inputs tab and is based on % of equity.
• Pyramiding: Set as desired.
• Commission: Set as number %. The PSE is designed to only work with commission as a percent of the position value.
• Verify Price for Limit Orders: Set as desired.
Slippage
Adjust Slippage on the Properties tab to account for a realistic bid-ask spread. You can use one of Dwn/Up Gap values or other guidelines. Again, the Dwn/Up Gap values are based on the Date Filter input settings.
Heed warnings from the TradingView Pine Script™ manual about values entered into the Slippage field.
The Slippage (ticks) have a noticeable influence on entry price and exit price especially at the beginning when the date range includes prices from $0.01 to $100,000.00 like that for BTC-USD INDEX. When this is the case, it is best to use different slippage values when partitioning time with the Date Filter.
To minimize the effects of slippage, yet account for it select ‘median gap’ on the Input Tab and use that value for slippage on the Properties tab.
The slippage value is included in the placeholder {{strategy.order.price}}.
Leverage Trading
The PSE is designed to be used both without leverage (the default) and with leverage.
These two settings apply to Trade-Grps. For example, for 5x leverage enter 20 (1/5x100=20).
Margin for Long Positions: Set as desired. The default is 100%.
Margin for Short Positions: Set as desired. The default is 100%.
This setting on the Inputs tab applies to each trade position within a Trade-Grp.
Max % Equity per Position: Set as desired. The default is 20% and intended for non-leverage trading. For leverage trading set as desired. For example, for 3x leverage enter 300 (3x100=300).
Recalculate After Order Is Filled
The PSE uses the strategy parameter calc_on_order_fills=true to allow for enter/exit on the same bar and generate alerts immediately after an order is filled. This parameter is on the Properties tab and is named ‘Recalculate After order is filled’ and is enabled by default.
Disabling this feature will cause the PSE to not work as intended.
You will see the following Caution! on the TV Strategy Tester
This occurs because the PSE has the strategy parameter calc_on_order_fills = true.
Again, the PSE will only work as intended if this parameter is enabled and set to true.
Therefore, you can close the caution sign and be confident of receiving realistic results.
Recalculate On every tick: Disable.
Fill Orders
• Using bar magnifier: Set as desired.
• On Bar Close: Disable. The PSE will not work as intended if this is enabled.
• Using Standard OHLC: Set as desired.
Using The Alert Message Box From TV Strategy Alert
Set alerts to gain access to all the alerts from PSE. This allows for both order filled alerts, as well as the alert function calls related to refresh GTC orders, drawdown exceeded, update stop-loss order, and Failed to Trade.
Example Message for Manual Trading Alerts
(This is just an example. Consult TV manual for possible placeholders to use.)
{
Alert for {{plot("position_for_alert")}} position. (long = 1; short = -1)
{{exchange}}:{{ticker}} on TF of {{interval}} at Broker Name
{{strategy.order.action}} Equity x Equity_Multiplier USD in shares at price = {{strategy.order.price}},
where Equity_Multiplier = {{strategy.order.contracts}} x {{strategy.order.price}} / {{plot("Equity")}}
or {{strategy.order.action}} {{strategy.order.contracts}} shares at price = {{strategy.order.price}}.
}
Note: Use the Equity x Equity_Multiplier method if you have several accounts with different initial capital.
Example Message for Bot Trading Alerts
(You must consult your specific bot for configuring the alert message. This is just an example.)
{
"action": "{{strategy.order.action}}",
“price”: {{strategy.order.price}}
"amount": {{strategy.order.contracts}},
"botId": "1234"
}
Connecting to the PSE
The diagram below illustrates how to connect indicators to the PSE.
The Aroon and MACD indicators are only used here as an example. Substitute your own indicators and add as many as you like.
Connection Indicator for the PSE
A video of how to connect your indicator(s) to the PSE is below.
The Connection Indicator for the PSE, also called here the connection-indicator.
Below is a description of how to connect your chosen indicators to the connection-indicator. Two (2) indicators were chosen for the example, but you may have one (1) or many indicators.
If you have source code access to your indicators you can paste the code directly into the connection-indicator to eliminate the need to have those indicators on the chart and the additional connection of them to the connection-indicator. Below will assume source code to the indicators are not available.
The MACD and Aroon Oscillator are from TV built standard indicators and are shown here just as an example for inputs (i.e. source) to the connection-indicator. They were configured as follows:
The source code for the connection-indicator is shown below. Substitute your own chosen indicators and add as many as you like to create your connection-indicator that feeds into the PSE. The MACD and Aroon Oscillator were simply chosen as an example. Configure your connection-indicator in the manner shown below.
// This Pine Script™ code is subject to the terms of the Mozilla Public License 2.0 at mozilla.org
// This is just an example Indicator to show how to interface with the PSE.
// The indicators used in the example are standard TV built indicators.
//@version=5
indicator(title="Connection Indicator for the PSE", overlay=false, max_lines_count=500, max_labels_count=500, max_boxes_count=500)
// Ind_1 INDICATOR ++++++++++++++++++++++++++++++++++++++++++++++++++++++++
// This is just and example and used MACD histogram as the source.
Filter_Ind_1 = input.bool(false, 'Ind_1', group='Ind_1 INDICATOR ~~~~~~~~~~~~~~~~~', tooltip='Click ON to enable the indicator')
input_Ind_1 = input.source(title = "input_Ind_1", defval = close, group='Ind_1 INDICATOR ~~~~~~~~~~~~~~~~~')
Entry_Ind_1_Long = Filter_Ind_1 ? input_Ind_1 > 0 ? 1 : 0 : 0
Entry_Ind_1_Short = Filter_Ind_1 ? input_Ind_1 < 0 ? 1 : 0 : 0
Exit_Ind_1_Long = Entry_Ind_1_Short
Exit_Ind_1_Short = Entry_Ind_1_Long
// Ind_2 INDICATOR ++++++++++++++++++++++++++++++++++++++++++++++++++++++++
// This is just an example and used Aroon Oscillator as the source. Included limits to use with the oscillator to determine enter and exit.
Filter_Ind_2 = input.bool(false, "Ind_2", group='Ind_2 INDICATOR ~~~~~~~~~~~~~~', tooltip='Click ON to enable the indicator')
Filter_Ind_2_Limit = input.int(35, minval=0, step=5, group='Ind_2 INDICATOR ~~~~~~~~~~~~~~')
Filter_Ind_2_UL = Filter_Ind_2_Limit
Filter_Ind_2_LL = -Filter_Ind_2_Limit
up = input.source(title = "input_Ind_2A Up", defval = close, group='Ind_2 INDICATOR ~~~~~~~~~~~~~~')
down = input.source(title = "input_Ind_2B Down", defval = close, group='Ind_2 INDICATOR ~~~~~~~~~~~~~~')
oscillator = up - down
Entry_Ind_2_Long = Filter_Ind_2? oscillator > Filter_Ind_2_UL ? 1 : 0 : 0
Entry_Ind_2_Short = Filter_Ind_2? oscillator < Filter_Ind_2_LL ? 1 : 0 : 0
Exit_Ind_2_Long = Entry_Ind_2_Short
Exit_Ind_2_Short = Entry_Ind_2_Long
//#region ~~~~~~~ASSEMBLY OF FILTERS ~~~~~~~~~~~~~~~~~~~~~~~~~~~~~~~~~~~~~~~~~~~~~~~~~~~~~~~~~~~~~~~~~}
// You may have as many indicators as you like. Assemble them in similar fashion as below.
// ——————— Assembly of Entry Filters
Nbr_Entries = input.int(1, minval=1, title='Min Nbr Entries', inline='nbr_in_out', group='Assembly of Indicators')
// Update the assembly based on the number of indicators connected.
EntryLongOK = Entry_Ind_1_Long + Entry_Ind_2_Long >= Nbr_Entries? true: false
EntryShortOK = Entry_Ind_1_Short + Entry_Ind_2_Short >= Nbr_Entries? true: false
entry_signal = EntryLongOK ? 1 : EntryShortOK ? -1 : 0
plot(entry_signal, title="Entry_Signal", color=color.new(color.blue, 0))
// ——————— Assembly of Exit Filters
Nbr_Exits = input.int(1, minval=1, title='Min Nbr of Exits', inline='nbr_in_out', group='Assembly of Indicators', tooltip='Enter the minimum number of entries & exits
required for a signal.')
// Update the assembly based on the number of indicators connected.
ExitLongOK = Exit_Ind_1_Long + Exit_Ind_2_Long >= Nbr_Exits? true: false
ExitShortOK = Exit_Ind_1_Short + Exit_Ind_2_Short >= Nbr_Exits? true: false
exit_signal = ExitLongOK ? 1 : ExitShortOK ? -1 : 0
plot(exit_signal, title="Exit_Signal", color=color.new(color.red, 0))
//#endregion ~~~~~~~END OF ASSEMBLY OF FILTERS ~~~~~~~~~~~~~~~~~~~~~~~~~~~~~~~~~~~~~~~~~~~~~~~~~~~~~~~~~~~~~~~~~}
The input box for the connection-indicator is shown below. The default for input source is “close”. For Input_Ind_1 click the dropdown and select the MACD Histogram. For Input_Ind_2 click the dropdown and select Aroon Up and Aroon Down as shown.
Signal Connection Section of PSE
Below is a description of how to connect your chosen indicators to the PSE from the connection-indicator.
At the PSE Input tab, the Signal Connection Section is where you select the source of the Entry and Exit Signal to the PSE. These are the outputs from connection-indicator.
The default source is “close”. Click the dropdown and select the entry and exit signal to establish a connection as shown below.

Portfolio [Afnan]🚀 Portfolio - Advanced Portfolio Management Indicator 📊
A game-changing portfolio management tool designed to help traders stay on top of their positions and manage risk efficiently. This indicator combines detailed tracking, real-time analytics, and visual clarity to ensure traders are well-equipped for the dynamic world of financial markets.
📈 Key Features 💡
Track up to 14 positions with ease
Real-time Profit & Loss (P&L) updates and risk metrics
Visual representation of entry, stop-loss (SL), and target levels
Alerts for stop-loss breaches and target achievements
Comprehensive portfolio summaries for quick analysis
Customizable options to suit individual trading styles
🔍 Main Components ⚙️
📊 1. Position Tracking
Detailed position data: entry, stop-loss, target levels, and more
Real-time risk-reward ratios
Insights into position size and exposure percentages
Continuous updates on P&L in real-time
📉 2. Visual Indicators
Clear visual markers for entry, SL, and target prices
Price labels with detailed percentage changes
Indicators that show the current position's market status
💼 3. Portfolio Summary
Aggregate account values and exposure
Summarized P&L metrics across all positions
Risk management insights for better decision-making
Daily performance tracking to evaluate strategies
⚠️ 4. Alert System
Instant notifications for stop-loss breaches
Alerts when target prices are hit
Alerts operate for the current chart symbol
⚡ Customization Options 🎨
Show or hide specific data columns
Adjust the table's position and size for better visibility
Personalize color schemes and text styles
Switch between full portfolio view and single symbol focus
📱 How to Use 📝
Input your positions in the indicator's settings
Enable or disable specific positions dynamically
Customize display preferences to your liking
Set up alerts for proactive risk management
Monitor all your trading activities in one comprehensive dashboard
📌 Important Notes ℹ️
Compatible with any trading symbol
Updates seamlessly during market hours
Alerts are specific to the currently active chart symbol
Maximum capacity: 14 simultaneous positions
Created by: @AfnanTAjuddin
⚠️ Disclaimer ⚠️
This indicator is a tool for informational purposes only. Ensure all calculations are verified and consult a financial professional before making investment decisions.
🎯 "Stay disciplined, trade smart, and let data guide your decisions." 📊

US/JP Factor/Sector Performance RankingThis indicator is designed to help you easily understand the strengths and weaknesses of different factors and sectors in the U.S. stock market. It looks at various ETFs, ranks their performance over a specific period (20 days by default), and shows the results visually.
= How the Ranking Works
The best-performing rank is shown as -1, with lower ranks as -2, -3, -4, and so on. This setup makes it easy to see rank order in TradingView’s default view.
If you turn on the “Inverse” setting, ranks will be shown as positive numbers in order (e.g., 1, 2, 3…). In this case, it’s recommended to reverse the TradingView scale for better understanding.
= How the Indicator Reacts to Market Conditions
- Normal Market Conditions
Certain factors or sectors often stay at the top rank. For example, during the rallies at the start of 2024 and in May, the Momentum factor performed well, showing a risk-on market environment.
On the other hand, sectors at the bottom rank also tend to stay in specific positions.
- Market Tops
Capital flows within sectors slow down, and top ranks begin to change frequently. This may suggest a market turning point.
- Bear Markets or High Volatility
Rankings become more chaotic in these conditions. These large changes can help you understand market sentiment and the level of volatility.
= Way of using the Indicator
You can use this indicator in the following ways:
- To apply sector rotation strategies.
- To build positions after volatile markets calm down.
- To take long positions on strong elements (higher ranks) and short positions on weaker ones (lower ranks).
= Things to Keep in Mind
It’s a Lagging Indicator
This indicator calculates rankings using the past 20 days of data. It doesn’t provide signals for the future but is a tool for analyzing past performance. To predict the market, you should combine this with other tools or leading indicators.
However, since trends in capital flows often continue, this indicator can help you spot those trends.
= Customization
This indicator is set up for U.S. and Japanese stock markets. However, you can customize it for other markets by changing the ticker and label description in the script.
==Japanese Description==
このインジケーターは、米国株市場におけるファクターやセクターの強弱を直感的に把握するために設計されています。
各ETFを参照し、特定期間(デフォルトでは20日間)のパフォーマンスを順位付けし、それを視覚的に表示します。
= インジケーターの特徴
- ランク付けの仕様
ランク1位は-1で表され、順位が下がるごとに-2、-3、-4…と減少します。この仕様により、TradingViewの標準状態でランクの高低を直感的に把握できるようにしました。
さらに、Inverse設定をONにすると、1位から順に正の値(例: 1, 2, 3…)で表示されるようになります。この場合、TradingViewのスケールを反転させることを推奨します。
= 市況とインジケーターの動き
- 平常時の市況
特定のファクターやセクターがランク1位を維持することが多いです。
例えば、2024年の年初や同年5月の上昇相場では、Momentumファクターが効果を発揮し、リスクオンの市場環境であったことを示しています。
一方、最下位に位置するセクターも特定の順位を維持する傾向があります。
- 天井圏の市況
セクター内の資金流入や流出が停滞し、上位ランクの変動が起こり始めます。これが市場の転換点を示唆する場合があります。
- 下落相場や荒れた市況
ランク順位が大きく乱れることが特徴です。この変動の大きさは、市況の雰囲気やボラティリティの高さを感じ取る材料として活用できます。
= 活用方法
このインジケーターは以下のような投資戦略に役立てることができます:
- セクターローテーションを活用した投資戦略
- 荒れた相場が落ち着いたタイミングでのポジション構築
- 強い要素(ランク上位)のロング、弱い要素(ランク下位)のショート
= 注意点
- 遅行指標であること
本インジケーターは、過去20日間のデータを基にランクを算出します。そのため、先行的なシグナルを提供するものではなく、過去のパフォーマンスに基づいた分析ツールです。市場を先回りするには、別途先行指標や分析を組み合わせる必要があります。
ただし、特定のファクターやセクターへの資金流入・流出が継続する傾向があるため、これを見極める手助けにはなります。
= カスタマイズについて
このインジケーターは米国・日本株市場に特化しています。ただし、他国のファクターやセクターのETFや指数が利用可能であれば、スクリプト内のtickerとlabel descriptionを変更することでカスタマイズが可能です。

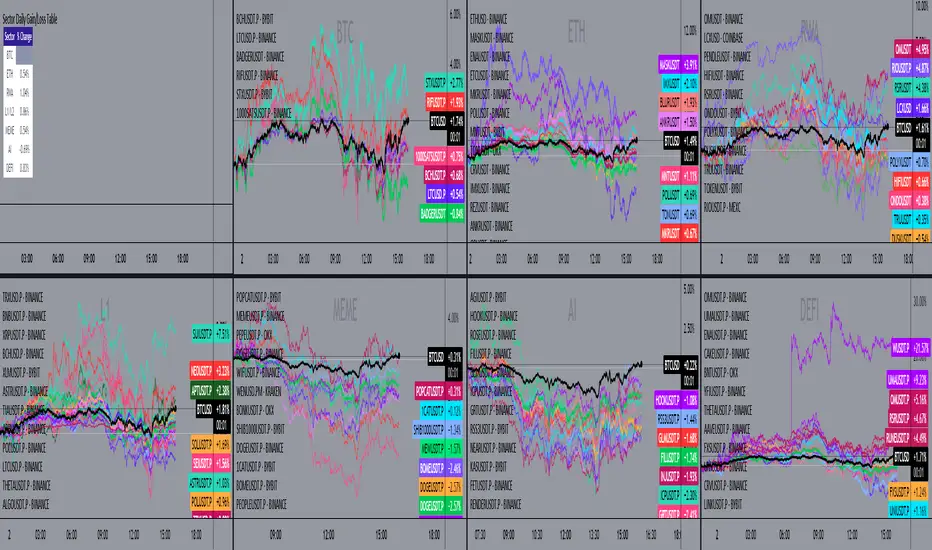
MultiSector Performance Tracker [LuxAlgo]The MultiSector Performance Tracker tool shows the overall performance of different crypto market sectors within a selected time frame, overlaid on a single chart for easy comparison.
Users can customize the time frame to suit their specific needs, whether daily, weekly, monthly, or yearly.
🔶 USAGE
The tool displays the performance of up to 6 crypto sectors within a selected time period, such as each day, week, month or year, or from the beginning of the year for any of the last 4 years.
The sectors and tickers within each sector are as follows:
Layer 1: CRYPTOCAP:ETH CRYPTOCAP:SOL CRYPTOCAP:TON
Layer 2: SEED_DONKEYDAN_MARKET_CAP:MATIC TSX:MNT AMEX:ARB
CEX: CRYPTOCAP:BNB CRYPTOCAP:OKB NYSE:BGB
DEX: CRYPTOCAP:UNI LSE:JUP CRYPTOCAP:RUNE
AI: CRYPTOCAP:NEAR GETTEX:TAO CRYPTOCAP:ICP
Ethereum Memes: CRYPTOCAP:PEPE CRYPTOCAP:SHIB CRYPTOCAP:FLOKI
Traders can compare the relative performance of a custom ticker against the sector of their choice and view the average of all sectors.
The tool is fully customizable, allowing traders to enable or disable any of the features or sectors.
🔹 Dashboard
The tool also displays the data in an ascending or descending sector performance dashboard, allowing traders to see at a glance which sectors are overperforming or underperforming.
Other dashboard features include custom ticker vs. sector comparison and sectors average, and traders can choose the location and size of the dashboard.
🔶 SETTINGS
Period: View all data by time period, daily, weekly, etc. Or view data from last year, last 2 years, etc.
Relative Performance Against: Enable/Disable relative performance comparison against a sector.
Use chart ticker: Enable the use of the chart ticker or a custom ticker for relative performance comparison.
🔹 Dashboard
Show Dashboard: Enable / disable Dashboard display.
Order: Choose between ascending and descending order.
Position: Selection of dashboard location.
Size: Selection of dashboard size.
🔹 Style
Show Sectors Labels: Enable / disable sector labels
Layer 1: Enable / disable Layer 1 sector
Layer 2: Enable / disable Layer 2 sector
CEX: Enable / disable CEX sector
DEX: Enable / disable DEX sector
AI: Enable / disable AI sector
Ethereum Memes: Enable / disable Ethereum Memes sector
Average: Enable / disable sectors average display
Custom Ticker: Enable / disable custom ticker display

Crypto Wallets Profitability & Performance [LuxAlgo]The Crypto Wallets Profitability & Performance indicator provides a comprehensive view of the financial status of cryptocurrency wallets by leveraging on-chain data from IntoTheBlock. It measures the percentage of wallets profiting, losing, or breaking even based on current market prices.
Additionally, it offers performance metrics across different timeframes, enabling traders to better assess market conditions.
This information can be crucial for understanding market sentiment and making informed trading decisions.
🔶 USAGE
🔹 Wallets Profitability
This indicator is designed to help traders and analysts evaluate the profitability of cryptocurrency wallets in real-time. It aggregates data gathered from the blockchain on the number of wallets that are in profit, loss, or breaking even and presents it visually on the chart.
Breaking even line demonstrates how realized gains and losses have changed, while the profit and the loss monitor unrealized gains and losses.
The signal line helps traders by providing a smoothed average and highlighting areas relative to profiting and losing levels. This makes it easier to identify and confirm trading momentum, assess strength, and filter out market noise.
🔹 Profitability Meter
The Profitability Meter is an alternative display that visually represents the percentage of wallets that are profiting, losing, or breaking even.
🔹 Performance
The script provides a view of the financial health of cryptocurrency wallets, showing the percentage of wallets in profit, loss, or breaking even. By combining these metrics with performance data across various timeframes, traders can gain valuable insights into overall wallet performance, assess trend strength, and identify potential market reversals.
🔹 Dashboard
The dashboard presents a consolidated view of key statistics. It allows traders to quickly assess the overall financial health of wallets, monitor trend strength, and gauge market conditions.
🔶 DETAILS
🔹 The Chart Occupation Option
The chart occupation option adjusts the occupation percentage of the chart to balance the visibility of the indicator.
🔹 The Height in Performance Options
Crypto markets often experience significant volatility, leading to rapid and substantial gains or losses. Hence, plotting performance graphs on top of the chart alongside other indicators can result in a cluttered display. The height option allows you to adjust the plotting for balanced visibility, ensuring a clearer and more organized chart.
🔶 SETTINGS
The script offers a range of customizable settings to tailor the analysis to your trading needs.
Chart Occupation %: Adjust the occupation percentage of the chart to balance the visibility of the indicator.
🔹 Profiting Wallets
Profiting Percentage: Toggle to display the percentage of wallets in profit.
Smoothing: Adjust the smoothing period for the profiting percentage line.
Signal Line: Choose a signal line type (SMA, EMA, RMA, or None) to overlay on the profiting percentage.
🔹 Losing Wallets
Losing Percentage: Toggle to display the percentage of wallets in loss.
Smoothing: Adjust the smoothing period for the losing percentage line.
Signal Line: Choose a signal line type (SMA, EMA, RMA, or None) to overlay on the losing percentage.
🔹 Breaking Even Wallets
Breaking-Even Percentage: Toggle to display the percentage of wallets breaking even.
Smoothing: Adjust the smoothing period for the breaking-even percentage line.
🔹 Profitability Meter
Profitability Meter: Enable or disable the meter display, set its width, and adjust the offset.
🔹 Performance
Performance Metrics: Choose the timeframe for performance metrics (Day to Date, Week to Date, etc.).
Height: Adjust the height of the chart visuals to balance the visibility of the indicator.
🔹 Dashboard
Block Profitability Stats: Toggle the display of profitability stats.
Performance Stats: Toggle the display of performance stats.
Dashboard Size and Position: Customize the size and position of the performance dashboard on the chart.
🔶 RELATED SCRIPTS
Market-Sentiment-Technicals
Multi-Chart-Widget

Performance IndicatorPerformance Indicator
This TradingView indicator calculates and displays the performance of a selected price type over a specified timeframe. It also provides the option to display an additional price type with a customizable line color.
Features:
Timeframe Selection: Choose the timeframe for performance calculation (e.g., 3-Month, 1-Year).
Price Type Selection: Select the price type for performance calculation (Open, High, Low, Close).
Customizable Colors: Set colors for the box, text, and lines.
Box Positioning: Choose the position of the information box on the chart.
Additional Price Type: Display an additional price type with a separate customizable line color.
Inputs:
Timeframe: Select the timeframe for performance calculation.
Price Type: Choose the price type (Open, High, Low, Close) for performance calculation.
Box Color: Set the color of the information box.
Text Color: Set the color of the text inside the box.
Line Color: Set the color of the main performance line.
Line Width: Set the width of the main performance line.
Box Position: Choose the position of the information box (Top Right, Top Left, Bottom Right, Bottom Left).
Additional Price Type: Select an additional price type to display (Open, High, Low, Close).
Additional Line Color: Set the color of the additional price line.
How to Use:
Add the Indicator: Add the indicator to your TradingView chart.
Configure Inputs: Use the input options to configure the timeframe, price types, colors, and box position according to your preferences.
View Performance: The indicator will display the performance of the selected price type over the chosen timeframe in the information box.
Additional Price: The additional price type will also be displayed in the information box with a separate line on the chart.
Example:
If you select a 3-Month timeframe and choose “Close” as the price type, the indicator will calculate the performance of the closing price over the last 3 months. It will also display an additional price type (e.g., “Low”) with a separate line on the chart.

Sector Daily Gain/Loss TableOverview: The "Sector Daily Gain/Loss Table" is a custom TradingView indicator designed to display the daily percentage changes in selected cryptocurrency sectors. This indicator provides a comprehensive view of the performance of various cryptocurrencies organized into specific sectors, helping traders and analysts to make informed decisions based on sector performance.
Key Features:
Dynamic Data Retrieval: The indicator retrieves daily closing prices for multiple cryptocurrencies across different exchanges (Binance and Bybit) using the request.security function. This allows users to monitor real-time price movements.
Sectors Covered:
BTC Sector: Includes Bitcoin (BTC).
ETH Sector: Includes Ethereum (ETH).
RWA Sector: Comprises various assets such as OM, ONDO, POLYX, SNX, PENDLE, and HIFI.
L1/L2 Sector: Features major Layer 1 and Layer 2 solutions including ETH, BNB, SOL, XRP, TON, ADA, AVAX, DOT, SUI, APT, ICP, POL, and more.
MEME Sector: Showcases popular meme coins like DOGE, SHIB, PEPE, WIF, BONK, FLOKI, ORDI, BOME, and NEIRO, along with MEW and POPCAT from Bybit.
AI Sector: Highlights AI-related tokens such as TAO, FET, GRT, THETA, WLD, and TURBO.
DEFI Sector: Displays decentralized finance projects including UNI, AAVE, INJ, RUNE, MKR, JUP, LDO, PENDLE, CAKE, LUNA, RAY, OSMO, KAVA, and RSR.
Average Gain/Loss Calculations: For each sector, the indicator calculates the average percentage change in price based on the included cryptocurrencies, offering insights into sector-wide performance trends.
Table Display: The performance metrics are presented in a clean and organized table format on the TradingView chart, providing easy access to vital information for traders.
User-Friendly Design: The table is designed to be visually appealing and informative, with color coding and clear labeling for each sector and its corresponding percentage change.
Usage: Traders can utilize this indicator to quickly assess the performance of various cryptocurrency sectors and make informed trading decisions based on the daily changes in sector performance.
analytics_tablesLibrary "analytics_tables"
📝 Description
This library provides the implementation of several performance-related statistics and metrics, presented in the form of tables.
The metrics shown in the afforementioned tables where developed during the past years of my in-depth analalysis of various strategies in an atempt to reason about the performance of each strategy.
The visualization and some statistics where inspired by the existing implementations of the "Seasonality" script, and the performance matrix implementations of @QuantNomad and @ZenAndTheArtOfTrading scripts.
While this library is meant to be used by my strategy framework "Template Trailing Strategy (Backtester)" script, I wrapped it in a library hoping this can be usefull for other community strategy scripts that will be released in the future.
🤔 How to Guide
To use the functionality this library provides in your script you have to import it first!
Copy the import statement of the latest release by pressing the copy button below and then paste it into your script. Give a short name to this library so you can refer to it later on. The import statement should look like this:
import jason5480/analytics_tables/1 as ant
There are three types of tables provided by this library in the initial release. The stats table the metrics table and the seasonality table.
Each one shows different kinds of performance statistics.
The table UDT shall be initialized once using the `init()` method.
They can be updated using the `update()` method where the updated data UDT object shall be passed.
The data UDT can also initialized and get updated on demend depending on the use case
A code example for the StatsTable is the following:
var ant.StatsData statsData = ant.StatsData.new()
statsData.update(SideStats.new(), SideStats.new(), 0)
if (barstate.islastconfirmedhistory or (barstate.isrealtime and barstate.isconfirmed))
var statsTable = ant.StatsTable.new().init(ant.getTablePos('TOP', 'RIGHT'))
statsTable.update(statsData)
A code example for the MetricsTable is the following:
var ant.StatsData statsData = ant.StatsData.new()
statsData.update(ant.SideStats.new(), ant.SideStats.new(), 0)
if (barstate.islastconfirmedhistory or (barstate.isrealtime and barstate.isconfirmed))
var metricsTable = ant.MetricsTable.new().init(ant.getTablePos('BOTTOM', 'RIGHT'))
metricsTable.update(statsData, 10)
A code example for the SeasonalityTable is the following:
var ant.SeasonalData seasonalData = ant.SeasonalData.new().init(Seasonality.monthOfYear)
seasonalData.update()
if (barstate.islastconfirmedhistory or (barstate.isrealtime and barstate.isconfirmed))
var seasonalTable = ant.SeasonalTable.new().init(seasonalData, ant.getTablePos('BOTTOM', 'LEFT'))
seasonalTable.update(seasonalData)
🏋️♂️ Please refer to the "EXAMPLE" regions of the script for more advanced and up to date code examples!
Special thanks to @Mrcrbw for the proposal to develop this library and @DCNeu for the constructive feedback 🏆.
getTablePos(ypos, xpos)
Get table position compatible string
Parameters:
ypos (simple string) : The position on y axise
xpos (simple string) : The position on x axise
Returns: The position to be passed to the table
method init(this, pos, height, width, positiveTxtColor, negativeTxtColor, neutralTxtColor, positiveBgColor, negativeBgColor, neutralBgColor)
Initialize the stats table object with the given colors in the given position
Namespace types: StatsTable
Parameters:
this (StatsTable) : The stats table object
pos (simple string) : The table position string
height (simple float) : The height of the table as a percentage of the charts height. By default, 0 auto-adjusts the height based on the text inside the cells
width (simple float) : The width of the table as a percentage of the charts height. By default, 0 auto-adjusts the width based on the text inside the cells
positiveTxtColor (simple color) : The text color when positive
negativeTxtColor (simple color) : The text color when negative
neutralTxtColor (simple color) : The text color when neutral
positiveBgColor (simple color) : The background color with transparency when positive
negativeBgColor (simple color) : The background color with transparency when negative
neutralBgColor (simple color) : The background color with transparency when neutral
method init(this, pos, height, width, neutralBgColor)
Initialize the metrics table object with the given colors in the given position
Namespace types: MetricsTable
Parameters:
this (MetricsTable) : The metrics table object
pos (simple string) : The table position string
height (simple float) : The height of the table as a percentage of the charts height. By default, 0 auto-adjusts the height based on the text inside the cells
width (simple float) : The width of the table as a percentage of the charts width. By default, 0 auto-adjusts the width based on the text inside the cells
neutralBgColor (simple color) : The background color with transparency when neutral
method init(this, seas)
Initialize the seasonal data
Namespace types: SeasonalData
Parameters:
this (SeasonalData) : The seasonal data object
seas (simple Seasonality) : The seasonality of the matrix data
method init(this, data, pos, maxNumOfYears, height, width, extended, neutralTxtColor, neutralBgColor)
Initialize the seasonal table object with the given colors in the given position
Namespace types: SeasonalTable
Parameters:
this (SeasonalTable) : The seasonal table object
data (SeasonalData) : The seasonality data of the table
pos (simple string) : The table position string
maxNumOfYears (simple int) : The maximum number of years that fit into the table
height (simple float) : The height of the table as a percentage of the charts height. By default, 0 auto-adjusts the height based on the text inside the cells
width (simple float) : The width of the table as a percentage of the charts width. By default, 0 auto-adjusts the width based on the text inside the cells
extended (simple bool) : The seasonal table with extended columns for performance
neutralTxtColor (simple color) : The text color when neutral
neutralBgColor (simple color) : The background color with transparency when neutral
method update(this, wins, losses, numOfInconclusiveExits)
Update the strategy info data of the strategy
Namespace types: StatsData
Parameters:
this (StatsData) : The strategy statistics object
wins (SideStats)
losses (SideStats)
numOfInconclusiveExits (int) : The number of inconclusive trades
method update(this, stats, positiveTxtColor, negativeTxtColor, negativeBgColor, neutralBgColor)
Update the stats table object with the given data
Namespace types: StatsTable
Parameters:
this (StatsTable) : The stats table object
stats (StatsData) : The stats data to update the table
positiveTxtColor (simple color) : The text color when positive
negativeTxtColor (simple color) : The text color when negative
negativeBgColor (simple color) : The background color with transparency when negative
neutralBgColor (simple color) : The background color with transparency when neutral
method update(this, stats, buyAndHoldPerc, positiveTxtColor, negativeTxtColor, positiveBgColor, negativeBgColor)
Update the metrics table object with the given data
Namespace types: MetricsTable
Parameters:
this (MetricsTable) : The metrics table object
stats (StatsData) : The stats data to update the table
buyAndHoldPerc (float) : The buy and hold percetage
positiveTxtColor (simple color) : The text color when positive
negativeTxtColor (simple color) : The text color when negative
positiveBgColor (simple color) : The background color with transparency when positive
negativeBgColor (simple color) : The background color with transparency when negative
method update(this)
Update the seasonal data based on the season and eon timeframe
Namespace types: SeasonalData
Parameters:
this (SeasonalData) : The seasonal data object
method update(this, data, positiveTxtColor, negativeTxtColor, neutralTxtColor, positiveBgColor, negativeBgColor, neutralBgColor, timeBgColor)
Update the seasonal table object with the given data
Namespace types: SeasonalTable
Parameters:
this (SeasonalTable) : The seasonal table object
data (SeasonalData) : The seasonal cell data to update the table
positiveTxtColor (simple color) : The text color when positive
negativeTxtColor (simple color) : The text color when negative
neutralTxtColor (simple color) : The text color when neutral
positiveBgColor (simple color) : The background color with transparency when positive
negativeBgColor (simple color) : The background color with transparency when negative
neutralBgColor (simple color) : The background color with transparency when neutral
timeBgColor (simple color) : The background color of the time gradient
SideStats
Object that represents the strategy statistics data of one side win or lose
Fields:
numOf (series int)
sumFreeProfit (series float)
freeProfitStDev (series float)
sumProfit (series float)
profitStDev (series float)
sumGain (series float)
gainStDev (series float)
avgQuantityPerc (series float)
avgCapitalRiskPerc (series float)
avgTPExecutedCount (series float)
avgRiskRewardRatio (series float)
maxStreak (series int)
StatsTable
Object that represents the stats table
Fields:
table (series table) : The actual table
rows (series int) : The number of rows of the table
columns (series int) : The number of columns of the table
StatsData
Object that represents the statistics data of the strategy
Fields:
wins (SideStats)
losses (SideStats)
numOfInconclusiveExits (series int)
avgFreeProfitStr (series string)
freeProfitStDevStr (series string)
lossFreeProfitStDevStr (series string)
avgProfitStr (series string)
profitStDevStr (series string)
lossProfitStDevStr (series string)
avgQuantityStr (series string)
MetricsTable
Object that represents the metrics table
Fields:
table (series table) : The actual table
rows (series int) : The number of rows of the table
columns (series int) : The number of columns of the table
SeasonalData
Object that represents the seasonal table dynamic data
Fields:
seasonality (series Seasonality)
eonToMatrixRow (map)
numOfEons (series int)
mostRecentMatrixRow (series int)
balances (matrix)
returnPercs (matrix)
maxDDs (matrix)
eonReturnPercs (array)
eonCAGRs (array)
eonMaxDDs (array)
SeasonalTable
Object that represents the seasonal table
Fields:
table (series table) : The actual table
headRows (series int) : The number of head rows of the table
headColumns (series int) : The number of head columns of the table
eonRows (series int) : The number of eon rows of the table
seasonColumns (series int) : The number of season columns of the table
statsRows (series int)
statsColumns (series int) : The number of stats columns of the table
rows (series int) : The number of rows of the table
columns (series int) : The number of columns of the table
extended (series bool) : Whether the table has additional performance statistics

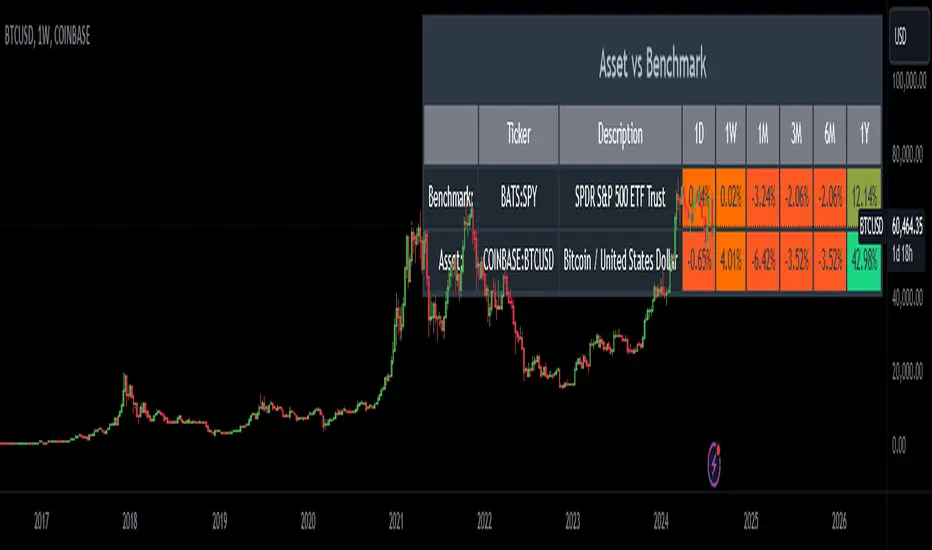
Relative Performance AnalysisRelative Performance Analysis Script
This Pine Script creates a detailed table on your TradingView chart to compare the performance of a specified asset against a benchmark over multiple time frames. The table is fully customizable, allowing you to select its location on the chart and display performance metrics for different periods.
Features:
Customizable Table Location: Choose where the table appears on your chart from a range of predefined positions (e.g., bottom left, top center).
Dynamic Column Headers: The table includes columns for the ticker, description, and performance metrics for various time periods (1 day, 1 week, 1 month, 3 months, 6 months, and 1 year).
Performance Calculation: Calculates the percentage change in performance between the current close price and the previous close price for each time frame.
Color-Coded Performance: Uses a color scheme to highlight performance levels, with specific colors for positive and negative changes to easily visualize performance trends.
Benchmark and Asset Comparison: Displays performance metrics for both a benchmark (e.g., SPY) and the asset currently viewed on the chart, providing a clear comparison.
Inputs:
Benchmark Symbol: Specify the symbol of the benchmark asset (e.g., SPY).
Benchmark Description: Provide a description for the benchmark asset.
Chart Symbol: Automatically uses the symbol of the chart for comparison.
Usage:
Add the script to your TradingView chart.
Configure the benchmark symbol and description as needed.
The table will automatically populate with performance data and be positioned according to your selection.
Disclaimer:
This script is for informational and educational purposes only and is not intended as financial advice. The performance data displayed in the table is based on historical prices and is not indicative of future performance. Trading involves risk, and you should always do your own research and consult with a qualified financial advisor before making any investment decisions. The creator of this script assumes no responsibility for any losses or damages incurred as a result of using this tool.
TrendMaster ProTrendMaster Pro: A Comprehensive Trend Analysis Tool for Long-Term Investors
TrendMaster Pro is an advanced technical indicator designed to provide long-term investors with a robust and comprehensive analysis of market trends. This sophisticated tool operates exclusively on daily timeframes, making it ideal for those focused on long-term investment strategies. By combining multiple analytical approaches, TrendMaster Pro offers investors a powerful means to assess trend quality and make informed decisions.
Automatic Trend Detection
At the heart of TrendMaster Pro lies its ability to automatically identify the most statistically significant trend. The indicator analyzes various timeframes ranging from 1000 to 5000 days, selecting the one that exhibits the highest correlation. This feature ensures that investors are always working with the most relevant trend data, eliminating the subjectivity often associated with manual trend identification.
The trend detection algorithm employs a regression analysis approach, evaluating approximately 80,000 different trend alternatives each day. Each potential trend is assigned a score based on criteria such as trend density, deviation from regression, and the number of price points near the trend's floor and ceiling. The trend with the highest score is then selected and displayed on the chart.
Comprehensive Scoring System
TrendMaster Pro employs a multi-faceted scoring system that evaluates four key aspects of a trend, providing a holistic view of its quality and potential. Each aspect is scored on a scale of 0 to 10, with the overall trend quality score being a weighted average of these individual scores.
1. Length Score
The Length Score measures the duration of the detected trend. Longer trends receive higher scores, reflecting increased reliability and significance. This score is calculated by normalizing the auto-selected period (which ranges from 1000 to 5000 days) to a scale of 5 to 10.
For example, if the auto-selected period is 3000 days, it would receive a score of around 7.5. This emphasizes the importance of long-term trends in investment decision-making, as they tend to be more stable and indicative of underlying market forces.
2. Strength Score
The Strength Score utilizes Pearson's Correlation Coefficient to assess trend strength. This statistical measure gauges the linear relationship between price and trend projection. A value closer to 1 indicates a strong positive correlation, reinforcing confidence in the trend direction based on historical price movements.
The indicator translates the Pearson's Correlation Coefficient into a score from 0 to 10. For instance, a correlation coefficient of 0.95 might translate to a Strength Score of 8, indicating a strong and reliable trend.
3. Performance Score
The Performance Score compares the asset's Compound Annual Growth Rate (CAGR) to a chosen benchmark, typically a major index like the S&P 500. This score provides insight into how well the asset is performing relative to the broader market.
The CAGR is calculated using the formula: CAGR = (Ending Value / Beginning Value)^(1/n) - 1, where n is the number of years. The Performance Score is then determined by comparing this CAGR to the benchmark's CAGR over the same period. A higher score indicates outperformance relative to the benchmark.
4. Level Score
The Level Score evaluates the current price position within the trend channel. Lower prices within the channel receive higher scores, suggesting potential value or buying opportunities. This score helps identify possible entry points based on historical trend behavior.
For example, if the current price is near the lower boundary of the trend channel, it might receive a Level Score of 9, indicating a potentially attractive entry point.
Visual Representation
TrendMaster Pro provides a clear visual representation of the detected trend by displaying a regression channel on the chart. This channel consists of three lines: a middle line representing the main trend, and upper and lower lines representing standard deviations from the main trend.
The channel offers a quick visual reference for support and resistance levels, helping investors identify potential entry and exit points. The color and style of these lines can be customized to suit individual preferences.
Detailed Information Table
A comprehensive table presents all scores and relevant data, allowing for quick and easy interpretation of the trend analysis. This table includes:
The auto-selected trend length
The Pearson's Correlation Coefficient
The asset's CAGR and the benchmark's CAGR
Individual scores for Length, Strength, Performance, and Level
The overall Trend Quality Score
This table provides investors with a clear, at-a-glance summary of the trend's key characteristics and quality.
Practical Application
To use TrendMaster Pro effectively, investors should consider the following:
Focus on the overall Trend Quality Score as a primary indicator of trend strength and reliability.
Use the Length Score to gauge the trend's longevity and potential stability.
Pay attention to the Strength Score to assess how well the price action aligns with the identified trend.
Utilize the Performance Score to compare the asset's performance against the broader market.
Consider the Level Score when timing entries, looking for opportunities when prices are relatively low within the trend channel.
Use the visual trend channel as a guide for potential support and resistance levels.
Limitations and Considerations
While TrendMaster Pro offers powerful insights, it's important to remember that no indicator can predict future market movements with certainty. The tool should be used in conjunction with fundamental analysis and other market information.
Additionally, as the indicator is designed for daily charts and long-term analysis, it may not be suitable for short-term trading strategies. Users should also be aware that past performance does not guarantee future results, even with strong trend indications.
Conclusion
TrendMaster Pro represents a significant advancement in trend analysis for long-term investors. By combining automatic trend detection, comprehensive scoring, and benchmark comparison, it offers a powerful tool for those seeking to make informed, data-driven investment decisions. Its ability to objectively assess trend quality across multiple dimensions provides investors with a valuable edge in navigating complex market conditions.
For investors looking to deepen their understanding of market trends and enhance their long-term investment strategies, TrendMaster Pro offers a sophisticated yet accessible solution. As with any investment tool, users are encouraged to thoroughly familiarize themselves with its features and interpret its outputs in the context of their overall investment approach.

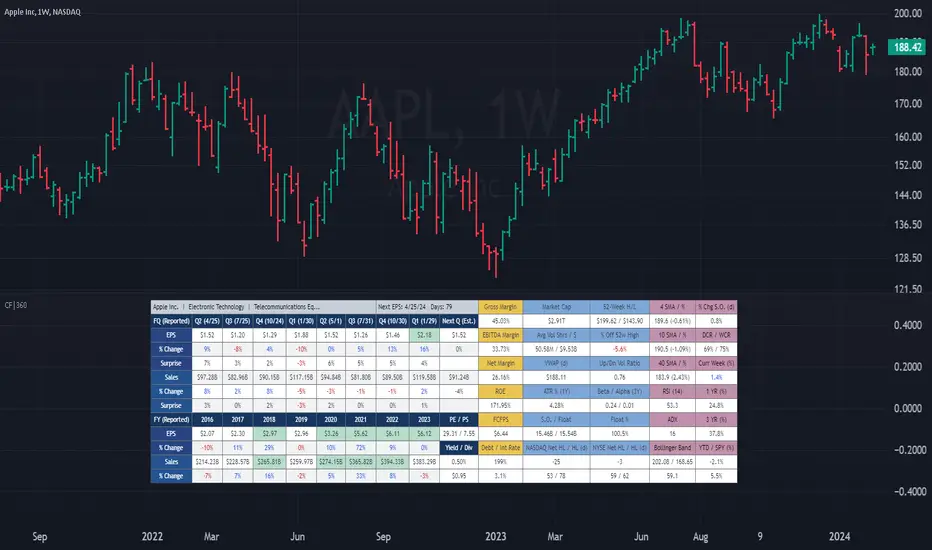
(CF|360) Caruso Financial DashboardThe Caruso Financial 360 Dashboard (CF|360) revolutionizes your TradingView charts by seamlessly integrating comprehensive Fundamental, Statistical, Technical, Performance, and Event information into an intuitively organized dashboard. This empowers users to make informed investment decisions effortlessly, eliminating the need to switch between pages or applications.
The dashboard is strategically divided into five distinct sections, each color-coded for user-friendly navigation. A quick glance at the dark blue "Fundamentals" table reveals two years of quarterly EPS and Sales data, YoY % change, and Surprise %, complete with report dates. Users can explore eight years of annual data and choose between Non-GAAP EPS, Diluted EPS, and Basic EPS for versatile analysis. Opting for Non-GAAP EPS also unveils next quarter estimates. The Fundamentals section further encompasses P/E and P/S data, alongside TTM dividend and dividend yield information.
In the yellow "Extended Fundamentals" section, users gain insights into Gross, EBITDA, and Net margins for easy profitability comparisons within the same industry group. Return on Equity data and Free Cashflow per share provide perspectives on profitability, efficiency, and financial flexibility.
The light blue "Statistics" section furnishes essential statistical measures for a rapid grasp of a company's trading characteristics. Metrics such as Market Cap, Average Volume per day (Shares and $ value), VWAP, Up/Down volume ratio, ATR%, Alpha, Beta, Shares Outstanding & Float, 52-week High/Low, and % distance from the 52-week high are presented. Additionally, market breadth is depicted through Nasdaq and NYSE 52-week high/low data.
The purple "Technical & Performance" section seamlessly integrates both Technical Analysis data and Performance statistics, enabling users to assess the stock's technical context and performance against the market over different periods. Technical indicators, including three customizable moving average types, RSI, ADX, Bollinger Band, Keltner Band, and daily and weekly closing ranges, are featured.
The grey top "Events" section offers a quick overview of the next earnings release date, countdown, and associated color changes as the date approaches. Company name, sector, and industry details are also presented.
To enhance information visibility, record EPS and Sales data are highlighted, emphasizing new records, along with highlights for new 52-week highs and lows.
The CF|360 offers customization options , including three display styles for Desktops, Desktop Slim, and Mobile devices.
Users can also tailor the lengths of technical indicators to suit their preferences. International market enthusiasts will appreciate that the CF|360 provides financial and market data for various regions, including the US, EU, Canada, and beyond.
88 Metrics Included:
Fundamentals Section (Dark Blue Group)
EPS (Adjusted Non-GAAP, Diluted, Basic)
- Quarterly, YoY % Chg, Surprise, Report Date, Next Quarter Estimate (Adjusted EPS only)
- Annual, YoY % Chg
Sales
- Quarterly, YoY % Chg, Surprise, Report Date, Next Quarter Estimate
- Annual, YoY % Chg
P/E ratio
P/S ratio
Dividend TTM
Dividend TTM Yield
Fundamentals Extended (Yellow Group)
Gross Margin
EBITDA Margin
Net Margin
Return on Equity (ROE)
Free Cashflow per Share (FCFPS)
Debt to Equity (Debt)
Effective Interest Rate (Int Rate)
Statistics (Light Blue Group)
Market Cap
Average Daily Volume (Shares)
Average Daily Volume (Dollar Value)
VWAP (Daily)
Average True Range Percent
Shares Outstanding
Shares in Float
Percentage of Share in Float
52-Week High
52-Week Low
% off of 52-Week High
Up / Down Volume Ratio
Beta
Alpha
Nasdaq Net 52-Week High/Lows
Nasdaq 52-Week Highs
Nasdaq 52-Week Lows
NYSE Net 52-Week High/Lows
NYSE 52-Week Highs
NYSE 52-Week Lows
Technical & Performance (Purple Group)
Moving Average Value (3 different averages)
Distance from Moving Average (3 different averages)
Relative Strength Index (RSI)
Average Directional Index (ADX)
Bollinger Band Value (Upper/Lower)
%b
Keltner Band Value (Upper/Lower)
%k
Percentage Changes Since Today’s Open
Daily Closing Range (DCR)
Weekly Closing Range (WCR)
Current Week % Change
1 Month % Change
3 Month % Change
6 Month % Change
1 Year % Change
3 Year % Change
YTD % Change
S&P 500 YTD % Change
Name, Group, & Events (Grey Section)
Company Name
Sector
Industry
Next Earnings Date
Days Until Next Earnings Date
Event Highlights
Record EPS (Quarterly/Annual)
Record Sales (Quarterly/Annual)
52-Week High
52-Week Low
Layout Types
Desktop
Get the full experience with the Desktop view.
Desktop Slim
Save screen real estate with a slim version of the dashboard.
Mobile
Take the most vital metrics with you on your mobile device. For the best experience, view in landscape mode.
Blockunity Level Presets (BLP)A simple tool for setting performance targets.
Level Presets (BLP) is a simple tool for setting upside and downside levels relative to the current price of any asset. In this way, you can track which price the asset needs to move towards in order to achieve a defined performance.
How to Use
This indicator is very easy to use, you can set up to 5 upward and downward targets in the parameters.
Elements
The main elements of this tool are upward (default green) and downward (default red) levels.
Settings
Several parameters can be defined in the indicator configuration.
In addition to configuring which performance value to set the level at, you can choose not to display it if you don't need it. For example, here we display only two levels:
You can also choose not to display the labels:
Also concerning labels, you can choose not to display them in currency format, but in numerical format only (for example, if you're viewing a non-USD pair, such as ETHBTC):
Finally, you can modify design elements such as colors, level widths and text size:
How it Works
Here's how upside (_u) and downside (_d) levels are calculated:
source = close
level_1_u = source + (source * (level_1 / 100))
level_1_d = math.max(source - (source * (level_1 / 100)), 0)

Annualized ReturnThis is a straightforward tool for investors, offering the capability to select a specific start date and visualize the annualized return of the currently displayed asset.
Annualized return is a crucial metric for investors, as it provides a standardized measure of an investment's performance, making it easier to compare different investments. By annualizing returns, investors can gain insights into the average yearly growth rate of their investments, enabling more informed decision-making and portfolio management .
Selecting various start dates enables users to understand how market timing can influence the success of their investments.
The annualized return is calculated using the following formula :
AnnualizedReturn = (Ending price / Beginning price) ^ (1 / Number of Years) − 1

Blockunity Performance Oscillator (BPO)The Performance Oscillator (BPO) is an intuitive indicator that makes it easy to analyze the performance of any asset. It operates over 5 simultaneously configurable periods. All design elements are also customizable. The integrated table summarizes the information in color, so you can quickly assess the different variations.
How it works
The operation of this script is quite simple. It calculates the performance of the selected asset over the different lookback periods indicated in the parameters (default: 1, 7, 30, 120 and 365). It then plots the lines in an independent panel (it is possible to hide lines by unchecking them in the parameters). Finally, performance information is displayed in a table for enhanced clarity.
The Idea
The idea is to bring information about the performance of any asset into your TradingView chart, and to make it visual. What's more, it can give an idea of the asset's trend, as, for example, if all periods are green (positive) in the table, then we can deduce that the selected asset is in a clear uptrend.
Being able to visually analyze several variations over different periods at the same time, while adding this information to a colorful table, makes it unique.
Usage Advice
You can use this indicator on any asset or index.
For example, if you use the indicator in a daily timeframe, the default periods will be 1 day, 7 days, 30 days, etc. If you use the indicator in a horary timeframe, the default periods will be 1 hour, 7 hours, 30 hours, etc.
Parameters
Display of different periods.
Periods according to the timeframe selected on the graph.
Line widths.
Line colors.
Table parameters.

S&P Sector PerformanceS&P Sector Performance calculate and display the logarithmic returns of SPX and each S&P Sector for a predefined timeframe or for a custom date.

Momentum ChannelbandsThe "Momentum Channelbands" is indicator that measures and displays an asset's momentum. It includes options to calculate Bollinger Bands and Donchian Channels around the momentum. Users can customize settings for a comprehensive view of momentum-related insights. This tool helps assess trend strength, identify overbought/oversold conditions, and pinpoint highs/lows. It should be used alongside other indicators due to potential lag and false signals.

Multi-Asset Performance [Spaghetti] - By LeviathanThis indicator visualizes the cumulative percentage changes or returns of 30 symbols over a given period and offers a unique set of tools and data analytics for deeper insight into the performance of different assets.
Multi Asset Performance indicator (also called “Spaghetti”) makes it easy to monitor the changes in Price, Open Interest, and On Balance Volume across multiple assets simultaneously, distinguish assets that are overperforming or underperforming, observe the relative strength of different assets or currencies, use it as a tool for identifying mean reversion opportunities and even for constructing pairs trading strategies, detect "risk-on" or "risk-off" periods, evaluate statistical relationships between assets through metrics like correlation and beta, construct hedging strategies, trade rotations and much more.
Start by selecting a time period (e.g., 1 DAY) to set the interval for when data is reset. This will provide insight into how price, open interest, and on-balance volume change over your chosen period. In the settings, asset selection is fully customizable, allowing you to create three groups of up to 30 tickers each. These tickers can be displayed in a variety of styles and colors. Additional script settings offer a range of options, including smoothing values with a Simple Moving Average (SMA), highlighting the top or bottom performers, plotting the group mean, applying heatmap/gradient coloring, generating a table with calculations like beta, correlation, and RSI, creating a profile to show asset distribution around the mean, and much more.
One of the most important script tools is the screener table, which can display:
🔸 Percentage Change (Represents the return or the percentage increase or decrease in Price/OI/OBV over the current selected period)
🔸 Beta (Represents the sensitivity or responsiveness of asset's returns to the returns of a benchmark/mean. A beta of 1 means the asset moves in tandem with the market. A beta greater than 1 indicates the asset is more volatile than the market, while a beta less than 1 indicates the asset is less volatile. For example, a beta of 1.5 means the asset typically moves 150% as much as the benchmark. If the benchmark goes up 1%, the asset is expected to go up 1.5%, and vice versa.)
🔸 Correlation (Describes the strength and direction of a linear relationship between the asset and the mean. Correlation coefficients range from -1 to +1. A correlation of +1 means that two variables are perfectly positively correlated; as one goes up, the other will go up in exact proportion. A correlation of -1 means they are perfectly negatively correlated; as one goes up, the other will go down in exact proportion. A correlation of 0 means that there is no linear relationship between the variables. For example, a correlation of 0.5 between Asset A and Asset B would suggest that when Asset A moves, Asset B tends to move in the same direction, but not perfectly in tandem.)
🔸 RSI (Measures the speed and change of price movements and is used to identify overbought or oversold conditions of each asset. The RSI ranges from 0 to 100 and is typically used with a time period of 14. Generally, an RSI above 70 indicates that an asset may be overbought, while RSI below 30 signals that an asset may be oversold.)
⚙️ Settings Overview:
◽️ Period
Periodic inputs (e.g. daily, monthly, etc.) determine when the values are reset to zero and begin accumulating again until the period is over. This visualizes the net change in the data over each period. The input "Visible Range" is auto-adjustable as it starts the accumulation at the leftmost bar on your chart, displaying the net change in your chart's visible range. There's also the "Timestamp" option, which allows you to select a specific point in time from where the values are accumulated. The timestamp anchor can be dragged to a desired bar via Tradingview's interactive option. Timestamp is particularly useful when looking for outperformers/underperformers after a market-wide move. The input positioned next to the period selection determines the timeframe on which the data is based. It's best to leave it at default (Chart Timeframe) unless you want to check the higher timeframe structure of the data.
◽️ Data
The first input in this section determines the data that will be displayed. You can choose between Price, OI, and OBV. The second input lets you select which one out of the three asset groups should be displayed. The symbols in the asset group can be modified in the bottom section of the indicator settings.
◽️ Appearance
You can choose to plot the data in the form of lines, circles, areas, and columns. The colors can be selected by choosing one of the six pre-prepared color palettes.
◽️ Labeling
This input allows you to show/hide the labels and select their appearance and size. You can choose between Label (colored pointed label), Label and Line (colored pointed label with a line that connects it to the plot), or Text Label (colored text).
◽️ Smoothing
If selected, this option will smooth the values using a Simple Moving Average (SMA) with a custom length. This is used to reduce noise and improve the visibility of plotted data.
◽️ Highlight
If selected, this option will highlight the top and bottom N (custom number) plots, while shading the others. This makes the symbols with extreme values stand out from the rest.
◽️ Group Mean
This input allows you to select the data that will be considered as the group mean. You can choose between Group Average (the average value of all assets in the group) or First Ticker (the value of the ticker that is positioned first on the group's list). The mean is then used in calculations such as correlation (as the second variable) and beta (as a benchmark). You can also choose to plot the mean by clicking on the checkbox.
◽️ Profile
If selected, the script will generate a vertical volume profile-like display with 10 zones/nodes, visualizing the distribution of assets below and above the mean. This makes it easy to see how many or what percentage of assets are outperforming or underperforming the mean.
◽️ Gradient
If selected, this option will color the plots with a gradient based on the proximity of the value to the upper extreme, zero, and lower extreme.
◽️ Table
This section includes several settings for the table's appearance and the data displayed in it. The "Reference Length" input determines the number of bars back that are used for calculating correlation and beta, while "RSI Length" determines the length used for calculating the Relative Strength Index. You can choose the data that should be displayed in the table by using the checkboxes.
◽️ Asset Groups
This section allows you to modify the symbols that have been selected to be a part of the 3 asset groups. If you want to change a symbol, you can simply click on the field and type the ticker of another one. You can also show/hide a specific asset by using the checkbox next to the field.

Sector Spaghetti [CE]Sector Spaghetti
An overlay indicator for multiple sectors that is configurable for multi asset configuration to track the returns of sectors in the market.
The tool provides three different viewing modes for returns; a rolling bar lookback, a specific data and time anchor, and a visible range.
Included is a pre built list of sectors created by none other than DaanCryptoTrades, the list includes a large range of sectors to cover the depth of the market as a whole.
Additionally a pre configured custom sectors list has been provided, we have included Daan's custom list within the custom sectors but provided the use of an additional feature "weight".
The weight feature is an intuitive method of applying importance to assets in there relevant sectors, we have used this as an opportunity to show the ability of creating market cap weighted sectors to balance the assets accordingly. This can provide useful in sectors where a low market cap + high beta asset could typically skew the results in one direction even if the remainder of the sector may be performing differently.
Non Market Cap:
Meme and Dex seem to be performing similarly
Market Cap:
Assets weighted via market cap shows relatively Meme sector is out performing
We have also added an optional table to the right of the screen so that the trader can clearly see outperforming assets. This table is toggleable using radio buttons within the Style menu. Updating the code we have provided users the ability to customize the table to further improve readability of the Text and reduce screen noise where needed.
To improve asset visibility, the script also calculates the 'long tail' of the list distribution and automatically lowers the visibility of clustered assets in the centre.
To Do
Alerts for sector performance

Rolling Risk-Adjusted Performance RatiosThis simple indicator calculates and provides insights into different performance metrics of an asset - Sharpe, Sortino and Omega Ratios in particular. It allows users to customize the lookback period and select their preferred data source for evaluation of an asset.
Sharpe Ratio:
The Sharpe Ratio measures the risk-adjusted return of an asset by considering both the average return and the volatility or riskiness of the investment. A higher Sharpe Ratio indicates better risk-adjusted performance. It allows investors to compare different assets or portfolios and assess whether the returns adequately compensate for the associated risks. A higher Sharpe Ratio implies that the asset generates more return per unit of risk taken.
Sortino Ratio:
The Sortino Ratio is a variation of the Sharpe Ratio that focuses specifically on the downside risk or volatility of an asset. It takes into account only the negative deviations from the average return (downside deviation). By considering downside risk, the Sortino Ratio provides a more refined measure of risk-adjusted performance, particularly for investors who are more concerned with minimizing losses. A higher Sortino Ratio suggests that the asset has superior risk-adjusted returns when considering downside volatility.
Omega Ratio:
The Omega Ratio measures the probability-weighted ratio of gains to losses beyond a certain threshold or target return. It assesses the skewed nature of an asset's returns by differentiating between positive and negative returns and assigning more weight to extreme gains or losses. The Omega Ratio provides insights into the potential asymmetry of returns, highlighting the potential for significant positive or negative outliers. A higher Omega Ratio indicates a higher probability of achieving large positive returns compared to large negative returns.
Utility:
Performance Evaluation: Provides assessment of an asset's performance, considering both returns and risk factors.
Risk Comparison: Allows for comparing the risk-adjusted returns of different assets or portfolios. Helps identify investments with better risk-reward trade-offs.
Risk Management: Assists in managing risk exposure by evaluating downside risks and volatility.
