Kz GC1! ORBStrategy that trades breakouts on GC1! futures on the 5min timeframe. It also works on MGC1! for lower drawdown and to manage Apex and Top Step accounts with the lower risk.
Risk Disclaimer:
Past results as well as strategy tester reports do not indicate future performance. Guarantees do not exist in trading. By using this strategy you risk losing all your money.
Important:
It trades all days that markets are open. Set times may be seen on settings. Trades multiple times a day sometimes.
It works on the 5 and 15min timeframe only. Results are better on 5min timeframe.
The settings are optimized already for GC1! on the 5min timeframe.
How it works:
Every trading day it measures the range of the first 15min candle of pre-selected hours. As soon as price closes above or below on the 15min timeframe, it will trade the breakout targeting a set risk to reward ratio. SL on the opposite side of the range.
Settings:
Hourly Trading Hours: These are the times that worked best for this strategy. All boxes should be checked for best results. Excluded times were when it performed bad which is why those times have been left out.
ORB Formation Period: This setting determines on which timeframe candle has to close outside the opening range box in order to take a trade. It's set to 15min by default because this is what worked by far the best
Entry Type: Entries are immediate instead of waiting for a pull back to enter on a limit order.
Limit Orders: If enabled, the strategy will place a pending order x points from the current price, instead of a market order. Immediate orders are enabled by default for a better performance. Important: It doesn't actually place a limit order. The strategy will just wait for a pullback and then enter with a market order. It's more like a hidden limit order.
Limit Order Offset Points: If you have limit orders enabled, this setting determines how many points from the current price the limit order will be placed.
FVG Detection Type: How fast it detects the fair value gaps. Standard detection over immediate had better performance
Risk Type: You can chose either between Fixed USD Amount, Risk per Trade in % or Fixed Contract Size. By default it's set to fixed contract size.
Risk Amount (USD or Contracts): This setting is to set how many USD or how many contracts you want to risk per trade. Make sure to check which risk type you have selected before you choose the risk amount.
Take Profit Multiplier: This is simply the total SL size in points multiplied by x.
Example: If you put 2, you get a 2:1 Risk to Reward Ratio. By Default it's set to 2.5 because this gave the best results in backtests.
Stop Loss Padding: This is simply the buffer in points that is added to the SL for safety reasons. If you have it on 0, the SL will be at the exact price of the opposite side of the range. By default it's set to 5 because this is what delivered the best results in backtests.
Stop Loss Placement: This determines where the stop loss gets placed for the order. It has been set to ORB Range by default as this delivered the best results.
Max Trades Per Hour: This allows the user to decide how many trades are taken an hour. 1 is been set to default for best results
Visual Settings: Check boxes to show orb range, FVG's, Entry points, and trade visualization boxes.
Backtest Settings:
For the backtest the commissions were set to 1.29USD per contract and .35USD for micros which is the highest amount Tradovate charges Margin was not accounted for because typically on prop accounts you can use way more contracts than you need for the extremely low max drawdown. Margin would be important on personal accounts but even there typically it's not an issue at all especially because this strategy runs on the 15min timeframe so it won't use a lot of contracts anyways.
Why the source code is hidden:
The source code is hidden because I invested a lot of time and money into developing this strategy and optimizing it with paid 3rd party software.
Su Pine

Current Price (Customizable) by DRtradeCurrent Price Line & Dynamic Label (Fully Customizable)
The ultimate tool for clear, real-time price visualization.
This powerful, lightweight indicator draws a clean horizontal line at the current market price, updating instantly with every price tick. Unlike other current price line scripts, this tool ensures you always see where the price is right now and provides full control over every visual element.
Key Features:
- Real-Time Tracking: The line moves dynamically with price ticks within the current candle, eliminating lag and providing true current market price awareness.
- Line Extension Control: Choose to extend: Left, Right, or Both. Helpful for scalpers and options traders
- Visual Customizations: Color, Style, Size, Width, etc.
- Label Positioning: Left of Candle, Above Candle, or Right of Candle
All customization options are available in the indicator's settings menu.
Ping me with feature reqeusts.

Impulse Range Compression & Expansion (IRCE)📌 Impulse Range Compression & Expansion (IRCE) – Visualizing Price Traps Before Breakouts
📖 Overview
The IRCE Indicator is a precision breakout detection tool designed to identify consolidation traps and price coil zones before expansion moves occur. Unlike traditional volatility indicators that rely solely on statistical thresholds (e.g., Bollinger Bands or ATR), IRCE focuses on behavioral price compression, detecting tight-range candle clusters and validating breakouts through body expansion and/or volume surges.
This makes it ideal for traders looking to:
• Catch breakouts from range traps
• Avoid choppy and premature signals
• Spot early-stage momentum moves based on clean price behavior
⸻
⚙️ How It Works
1. Impulse Range Compression Detection
• Measures the high-low range of each candle
• Compares it to a user-defined average range (default 7 bars)
• Flags candles where the range is significantly smaller (e.g., <60% of average)
• Groups these into tight clusters, indicating compression zones or potential “trap ranges”
2. Cluster Box Construction
• When a valid cluster (e.g., 3 or more tight candles) is detected, the indicator:
• Marks the high and low of the cluster
• Draws a shaded box over this “trap zone”
• This helps visually track where price has coiled before a breakout
3. Breakout Confirmation Logic
A breakout from the trap zone is only validated when:
• Price closes above the cluster high (bullish) or below the cluster low (bearish)
• One or both of the following confirm strength:
• Body Expansion: Current candle body is 120%+ of recent average
• Volume Expansion: Volume exceeds recent volume average
4. Optional Trend Filter
• An optional EMA filter (default: 50 EMA) ensures breakout signals align with trend direction
• Helps filter out countertrend noise in ranging markets
5. Signal Cooldown
• Prevents repeated signals by enforcing a cooldown period (e.g., 10 bars) between entries
⸻
🖥️ Visual Elements
• 📦 Yellow compression boxes represent tight price traps
• 🟢 Buy labels appear when price breaks above the trap with confirmation
• 🔴 Sell labels appear when price breaks below with confirmation
• All visuals are non-repainting and updated in real-time
🧠 How to Use
1. Wait for a yellow trap box to appear
2. Watch for a confirmed breakout from the trap zone
3. Take the trade in the direction of the breakout:
• Only if it satisfies body or volume confirmation
• And if trend alignment is enabled, it must match EMA direction
4. Place stops just outside the opposite end of the trap zone
5. Use risk/reward ratios or structure levels for exits
This logic works great on:
• Lower timeframes (scalping breakouts)
• Higher timeframes (detecting price coiling before major moves)
• Any market: Stocks, Crypto, FX, Commodities
⸻
🔒 Technical Notes
• ✅ No repainting
• ✅ No future-looking logic
• ✅ Suitable for both discretionary and systematic traders
• ✅ Built in Pine Script v6

NAKA SIAM ROMEO (SMC) V10📌 Description (ภาษาไทย)
อินดิเคเตอร์ Naka Siam Romeo พัฒนาขึ้นจากแนวคิด Smart Money Concepts (SMC) ผสมผสานกับ Bollinger Bands (BB) เพื่อช่วยจับโครงสร้างตลาด (BOS, CHoCH, Order Block) และยืนยันจังหวะเข้า–ออกออเดอร์ด้วยโซนแรงกดดันของราคา เหมาะสำหรับทั้งสาย Scalping และ Swing Trading โดยเฉพาะทองคำ (XAUUSD) และคู่เงินหลัก
📌 Description (English)
The Naka Siam Romeo indicator is designed based on Smart Money Concepts (SMC) combined with Bollinger Bands (BB).
It helps traders identify market structure (BOS, CHoCH, Order Blocks) and confirm entry–exit points with price pressure zones.
Suitable for both scalping and swing trading, especially on Gold (XAUUSD) and major Forex pairs.


Divergence Scalp v1.1 By DaoAn advanced divergence detection indicator based on RSI and price pivots, designed for scalpers and swing traders who want to catch high-probability reversal points.
🔑 Key Features
RSI Divergence Detection
Regular Bullish Divergence → Price makes lower low, RSI makes higher low (RSI < 50).
Hidden Bullish Divergence → Price makes higher low, RSI makes lower low (RSI < 50).
Regular Bearish Divergence → Price makes higher high, RSI makes lower high (RSI > 50).
Hidden Bearish Divergence → Price makes lower high, RSI makes higher high (RSI > 50).
Customizable Settings
Pivot lookback length & detection range.
Toggle On/Off for Bullish, Bearish, Hidden signals.
Adjustable colors for signals and labels.
RSI Visualization
Plots RSI line with overbought (70), oversold (30), and midline (50).
Background shading for quick visual reference.
Signal Labels
“Bull / H Bull” → Bullish Divergence.
“Bear / H Bear” → Bearish Divergence.
Built-in Alerts → Real-time alerts for all four divergence types.
📊 How It Helps
This tool makes it easier to spot early signs of momentum shifts, allowing traders to anticipate reversals at key levels and improve entry/exit timing.
👉 Perfect for traders who use RSI divergence + price action as a scalping or swing strategy.

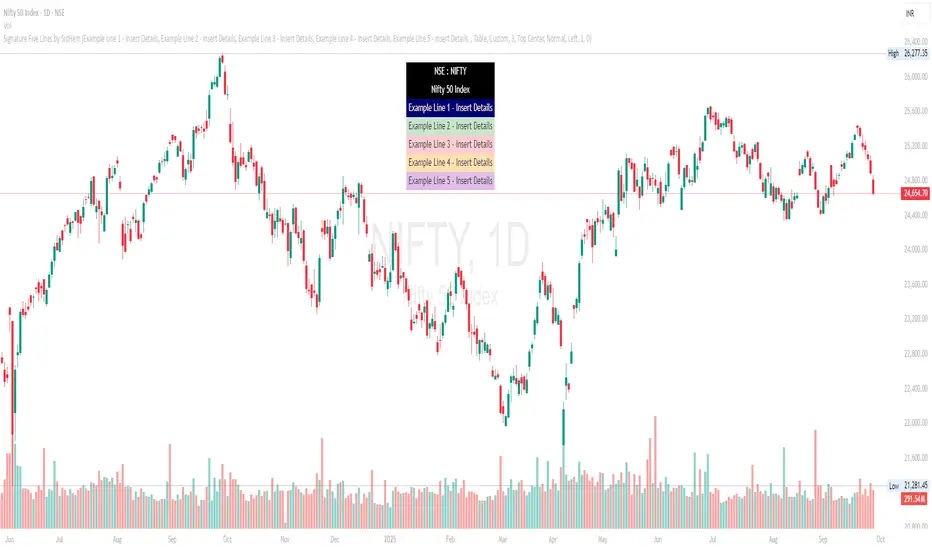
Signature Five Lines by SidHemSignature Five Lines by SidHem
Overview:
Signature Five Lines by SidHem is a chart overlay tool that lets traders and analysts display a fully customizable multi-line signature or text annotation directly on TradingView charts. It allows up to five user-defined lines, optional logo or emoji on the first line, and automatic inclusion of the symbol and instrument description. The display can be shown either as a table or a label, with complete control over fonts, colors, spacing, and positioning.
If you’re tired of adding your details manually on every new chart, Signature Five Lines by SidHem helps you display your standard information automatically on any chart you open.
This script is useful for traders who want to keep key information visible, add personal notes, or include contextual text on charts without manually adding labels or text boxes.
Inputs and How to Use Them
1. Multi-Line Signature
Enable Line 1–5: Toggle visibility of each signature line. Show or hide this line on the chart.
Line 1–5 Text: Enter the custom text for each line. Line 1 can include a logo or emoji if enabled.
2. Logo / Emoji
Show Emoji / Text in Line 1: Enable an emoji or small text to appear before Line 1 of the signature for personalization.
Logo Text: Enter the emoji or symbol to display at the start of Line 1 when enabled.
3. Symbol / Instrument
Show Symbol Row: Display the chart’s symbol (e.g., NSE:INFY) above your custom lines.
Show Name / Description Row: Display the instrument’s name or description below the symbol.
Combine Symbol & Name in 1 Row: Merge the symbol and description into a single row for compact display.
4. Display Mode
Display Mode: Choose how the signature is displayed: Table (row-based) or Label (near price).
Theme Skin: Select a prebuilt color theme or choose Custom to define your own colors for text and background.
5. Table Style
Table Vertical Spacer Rows: Number of empty rows added above the signature lines to adjust vertical positioning.
Table Position: Set the location of the table on the chart (Top, Middle, Bottom; Left, Center, Right).
Table Font Size: Set the font size for the signature lines. Options: Tiny, Small, Normal, Large, Huge.
6. Table Custom Line Colors
Lines 1–5 Background & Text Colors: Customize the background and text color for each signature line individually.
Symbol Row (line6) Background & Text Colors: Customize background and text colors for the symbol row.
Name/Description Row (line7) Background & Text Colors: Customize background and text colors for the description row.
7. Label Style (for Label Mode)
Label Text Color: Color of text when using Label mode.
Label Background Color: Background color of the label; supports transparency.
Label Style: Position of the label pointer relative to the bar (Left, Right, Up, Down, Center).
Label X Offset: Horizontal shift of the label in bars relative to the current bar.
Label Y Offset: Vertical shift of the label in price points; allows precise positioning above or below the price.
How it Works:
The script dynamically builds a display array combining the chart symbol, instrument description, and your custom signature lines.
Long text is automatically wrapped to ensure readability without overlapping chart elements.
Users can choose Table mode (row-based display) or Label mode (floating near price), with customizable X/Y offsets for precise placement.
Predefined color themes make it easy to match the chart’s style, or you can select Custom to fully control background and text colors for each line.
An optional logo/emoji can appear at the start of Line 1 for personalization.
Advantages:
Keeps key chart information visible at all times.
Adds a professional annotation layer to charts for notes or commentary.
Multi-line support allows clear separation of different information (symbol, description, personal notes, optional emoji).
Dynamic wrapping ensures text remains readable on different timeframes or zoom levels.
Works with any TradingView chart or instrument.
Recommended Use:
Add Prefixed notes or annotations directly on charts - simply calling it a Signature
Display symbol and description alongside personal commentary.
Combine multiple lines of information in a clean and readable overlay.
Alert on Price Close Above/BelowOverview
This indicator sends alerts when a candle closes above or below a user-defined price level on a chosen timeframe. Unlike standard price alerts that can trigger mid-candle, this script confirms on bar close, making it more reliable for breakout/breakdown use cases.
How it works
- Select the evaluation timeframe (e.g., 15m, 1H, 4H).
- Set a Primary Level and choose the direction (Above or Below).
- Optionally enable a Secondary Level with its own direction.
- The alert triggers only when the chosen timeframe’s candle closes beyond your level(s).
- Dynamic alert messages include the timeframe and can optionally include the exact closing price.
Alert message style
1. Dynamic alerts (when you choose “Any alert() function call”) use this format:
{TF} {TICKER} Close Above {Price}
{TF} {TICKER} Close Below {Price}
2. With “Show exact close price” enabled, messages append the actual close:
{TF} {TICKER} Close Above {Price} (Close={ActualClose})
Setup steps
1. Add the indicator to your chart on the symbol/timeframe you want to monitor.
2. Open the settings:
- Set “Evaluate On Timeframe” (this is the timeframe used to confirm closes).
- Choose “Primary Direction” (Above/Below) and enter the “Primary Level.”
- Optional: enable and configure the Secondary Level (direction + price).
3. Create a TradingView alert:
- Click the Alert button in the top toolbar.
- In “Condition,” pick this indicator and select “Any alert() function call” to receive dynamic messages.
- In “Interval,” select the timeframe same as the indicator.
- Optional: rename the alert for clarity.
4. Save. You’ll receive alerts when conditions are met.
Examples
4H BTCUSDT Close Above 100000
1H ETHUSDT Close Below 4000 (Close=3900)

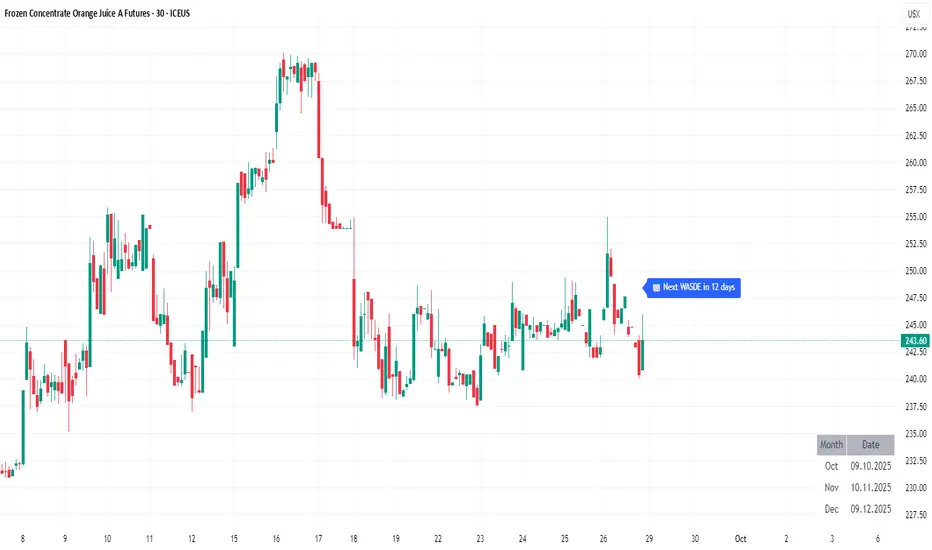
WASDE DatesOverview
WASDE Dates — a small, focused event indicator that displays confirmed USDA WASDE release dates for 2025 on the chart and marks each release day. The indicator is designed to be a lightweight timing tool for traders who want clean visual reminders and optional alerts around USDA WASDE publications.
Features
• Shows official WASDE release dates for 2025 in a compact chart table.
• Draws on-chart markers and a dotted vertical line on WASDE release days.
• Two alert conditions you can enable in TradingView: "WASDE Day Alert" and "WASDE 24h Reminder".
• Simple table position control (Top/Bottom, Left/Right) in the indicator settings.
• Minimal, self-contained code — no external data feeds or permissions required.
How to use
1. Apply the indicator to any chart and timeframe.
2. Use the indicator settings to choose table position.
3. Enable Alerts (if desired) via TradingView Alerts → choose “WASDE Day Alert” or “WASDE 24h Reminder”.
4. This version contains 2025 confirmed dates only — verify dates for live trading and enable alerts as needed.
Design & rationale
This indicator is intentionally not a technical trading signal. It is an event scheduler focused on clarity and low overhead: combine it with your existing setup to avoid being surprised by WASDE publications and to quickly inspect price action around these event dates.
Limitations & disclaimer
• This script shows **confirmed 2025** WASDE dates only. It does not provide trading advice or entry/exit signals. Use at your own risk.
• Double-check official USDA publishing times before executing trades.
• No external links or contact information are included in this description to comply with TradingView publishing rules.
Feature outlook (V2)
Planned V2 (future release): enhanced countdown (days → hours/minutes), optional inclusion of estimated 2026 dates marked as (TBC), and an invite-only/protected advanced version with reaction overlays (T+1/T+3) and extended alert options. V2 will be announced on this script page when ready.
Changelog
v1 — public release: 2025 confirmed dates, release markers, alerts, table position control.
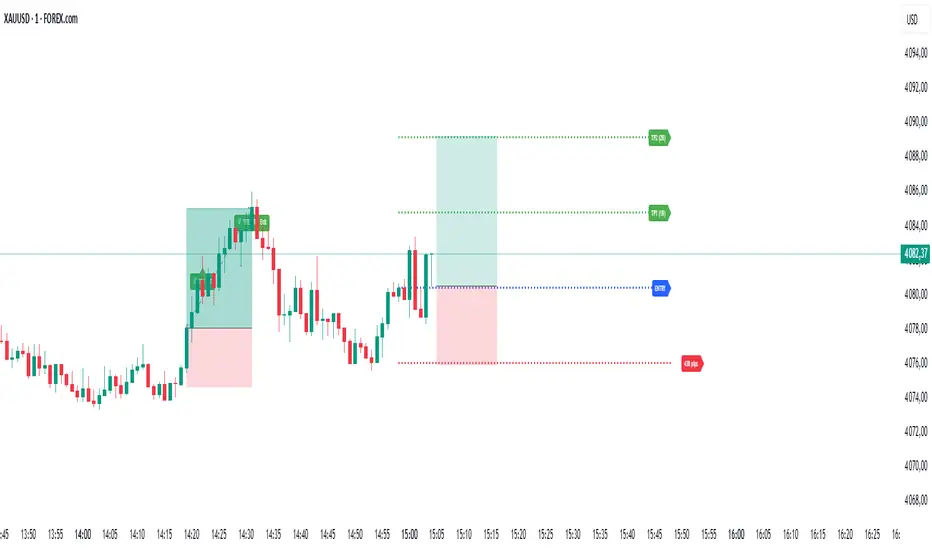
Smart TP Manager V.1.1 (SL trail par TP)🔹 Smart TP Manager V1.1 – Trade Management Advanced
A powerful TradingView tool designed to enhance trade management and protect profits.
Features:
Automatically detect Long/Short signals using EMA crossovers, RSI filter, higher-timeframe EMA trend, and ADX strength.
Calculate and display a dynamic Stop Loss based on ATR.
Automatically set TP1, TP2, TP3 with advanced Breakeven management:
SL moves to Entry after TP1 hit
SL moves to TP1 after TP2 hit, securing partial profits
Track your performance with a comprehensive statistics table (Win/Loss, BE, win rate, net profit in R).
Clear visual display of entries, SL, and TPs using colored lines and labels.
Receive automatic alerts for every signal and target reached.
Optional SL trailing feature to secure profits progressively as targets are hit.
📊 Smart TP Manager V1.1 is your assistant for risk control, trade optimization, and profit protection on TradingView.
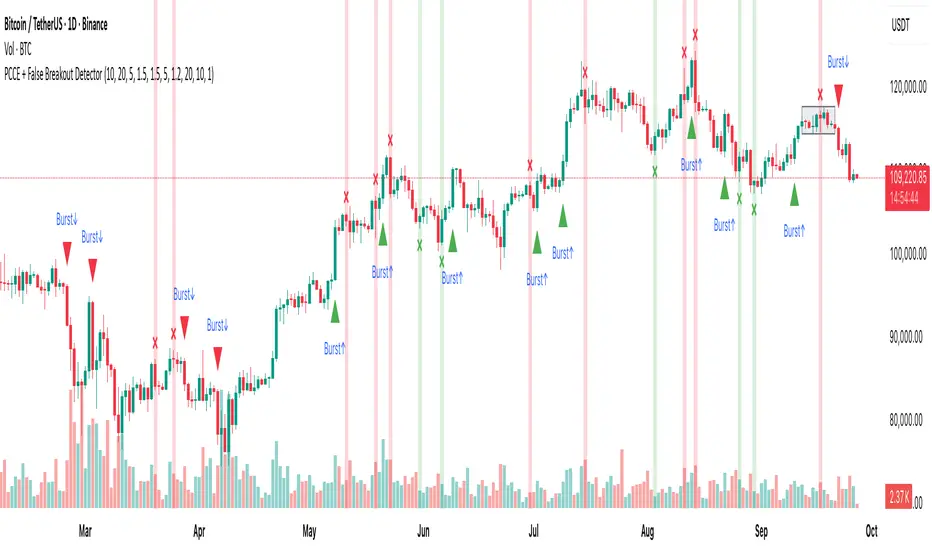
PCCE + False Breakout DetectorPCCE + False Breakout Detector
Type: Invite-Only Indicator (closed source)
Purpose : Detect price compression and the first expansion after it, while flagging failed breakouts (bull/bear traps) for risk control.
1) What’s original here!
This tool integrates three behaviour-driven tests that work in a single decision flow:
A compression score built from:
(a) monotonic body shrink,
(b) wick-dominance, and
(c) relative range contraction versus history.
This is not a bands/oscillator port; it’s a structure-first filter that isolates coils.
A thrusted expansion requirement that combines real-body impulse and relative-volume participation (+ optional EMA alignment) to qualify a breakout beyond the coil envelope.
An immediate post-breakout failure test (trap logic) that checks whether the breakout re-enters the prior swing range within a short window.
Used together, these steps turn raw breaks into contextual, risk-aware events: setup → trigger → validation. That is the value of the combination.
⸻
2) Concepts behind the calculations:
Let body_t = |close_t − open_t|,
uw_t = high_t − max(open_t, close_t) (upper wick),
lw_t = min(open_t, close_t) − low_t (lower wick),
R_t(k) = highest(high, k)_t − lowest(low, k)_t (range over k bars),
MA_body(k) = SMA(body, k), MA_vol(k) = SMA(volume, k).
2.1 Compression (coil) detection
We evaluate within a window k = coilLength:
• Body shrink count: number of consecutive steps where body_(t−i) < body_(t−i−1).
• Wick dominance: AvgWickBody = avg( (uw + lw) / body ) over the window; require AvgWickBody > wickRatioMin.
• Relative range contraction: current R_t(k) must be less than α × avg( R_(t−j)(k) ) computed over a lookback of rangeWindow windows, with α < 1 (tight market).
When all three are true, we mark a coil zone; the coil bounds are High_coil = highest(high, k), Low_coil = lowest(low, k).
2.2 Expansion (“Burst”) confirmation
A breakout is only qualified when all hold on bar close:
• Direction: close > High_coil → up; close < Low_coil → down.
• Body thrust: body_t > MA_body(k) × bodyMult.
• Participation: volume_t > MA_vol(k) × volumeMultiplier.
• Trend alignment (optional): close_t > EMA(emaLen) for up / < EMA for down.
• Cooldown: t − lastSignal > cooldownBars.
If satisfied, print Burst↑ or Burst↓ on that bar.
2.3 Failed breakout (trap) detection
Let H_s and L_s be the prior swing high/low from a lookback rangeLookback (excluding the current bar). Define:
• Bull break attempt: a bar that closed above H_s.
Bull trap: within fakeoutBars bars after that attempt, any close returns below H_s. Mark ❌ red above that bar.
• Bear break attempt: a bar that closed below L_s.
Bear trap: within fakeoutBars bars after that attempt, any close returns above L_s. Mark ❌ green below that bar.
Alerts fire on bar close only.
⸻
3) What you’ll see on the chart
• Coil box: shaded envelope (tight-range bounds).
• Burst labels: Burst↑ / Burst↓ only when thrust + volume (and optional EMA) confirm the break.
• Trap markers: ❌ red (failed bullish breakout) / ❌ green (failed bearish breakout).
• Alerts: “Burst Up” and “Burst Down” (close-based).
⸻
4) How to use it
1. Preparation : When a coil box appears, mark the bounds; expect expansion risk to rise.
2. Trigger : Act only on Burst labels (they already encode body/volume thrust and optional trend).
3. Validation : If a ❌ trap prints shortly after a breakout, treat it as a warning/exit event; breakouts that re-enter the prior swing range are statistically fragile.
4. Context : Works well on 15m–4H where structure is visible. Combine with your own higher-timeframe bias, S/R, liquidity pools, and risk rules.
5. Tuning :
• Tighten/loosen coil sensitivity via coilLength, wickRatioMin, and the range contraction factor.
• Use larger bodyMult / volumeMultiplier to demand stronger breaks.
• cooldownBars controls clustering in fast sessions.
• rangeLookback and fakeoutBars control how strict the trap check is.
⸻
5) Repainting, scope, and limitations
• Burst and trap labels are evaluated on bar close; once printed, they do not repaint. Coil boxes can update while forming; they stabilize once conditions are met.
• Sudden news/illiquid periods can defeat filters; adjust multipliers and cooldown for your instrument.
• This is an indicator, not a strategy; it does not publish PnL, win-rate, or forward promises.
Fetti Fields Header (Presets)This is for individuals that like to customize their charts and add some style and motivation

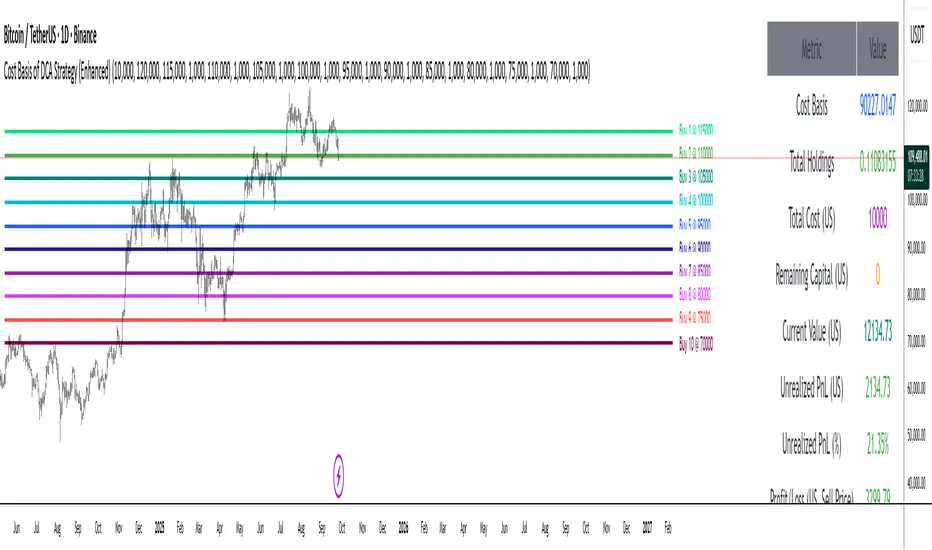
Cost Basis of DCA Strategy (Enhanced)“Cost Basis of DCA Strategy (Enhanced): An Analytical Tool for Smarter DCA Investing”
The indicator designed here serves as a comprehensive analytical tool for evaluating a Dollar-Cost Averaging (DCA) strategy. Instead of merely recording scattered buy transactions, it integrates all purchases into a clear framework that reveals the real cost basis, portfolio performance, and capital allocation. Its primary function is to transform the concept of DCA from a mechanical process into a measurable and strategic decision-making system.
At the foundation of its operation, the user provides essential inputs such as the initial capital, the price and size of each buy transaction, and an optional sell price for hypothetical exit scenarios. With these inputs, the indicator calculates how many units were acquired in total, how much money was spent, and what the average cost per unit—the cost basis—truly is. This cost basis acts as the anchor for evaluating whether the market price has moved in favor or against the investor’s average entry point.
Beyond this, the indicator goes further by calculating both realized and unrealized dimensions of performance. It presents the current market value of holdings based on live price data and contrasts it with the total cost to derive unrealized profit or loss in both absolute terms and percentages. If the user sets a sell price, the tool simulates a full liquidation scenario, displaying the expected profit or loss should all holdings be sold at that level. This dual perspective enables the user to examine their strategy both from a present-value standpoint and a forward-looking one.
In addition, the indicator keeps track of remaining capital—the portion of initial funds not yet deployed into purchases—thus bridging the gap between portfolio construction and financial planning. It also reports the number of buy transactions, reinforcing awareness of execution discipline in DCA.
For visualization, the system is not confined to numbers alone. It marks each buy price directly on the price chart with distinct horizontal lines, labeled for clarity. This allows the trader to see not just statistics in a table but also the spatial relationship between historical entry points and ongoing market dynamics.
In essence, this indicator reframes the practice of DCA into a structured analytical exercise. It empowers investors to understand the true average entry cost, evaluate ongoing performance, and simulate future outcomes under different price scenarios. By doing so, it elevates DCA from a passive habit into an active, data-driven investment methodology, allowing users to make more informed, confident, and strategically grounded decisions.
KD The ScalperWe have to take the trade when all three EMAs are pointing in the same direction (no criss-cross, no up/down, sideways). All 3 EMAs should be cleanly separated from each other with strong spacing between them; they are not tangled, sideways, or messy. This is our first filter before entering the trade. Are the EMAs stacked neatly, and is the price outside of the 25 EMA? If price pulls back and closes near or below the 25 or 50 EMA and breaks the 100 EMA, we don't trade. Use the 100 EMA as a safety net and refrain from trading if the price touches or falls below the 100 EMA.
1. Confirm the trend- All 3 EMAs must align, and they must spread
2. Watch price pull back to the 25th or the 50 EMA
3. Wait for the price to bounce - And re-approach the 25 EMA
Why is this powerful?
Removes 80% of the low-probability Trades
It keeps you out of choppy markets
Avoids Reversal Traps
Anchors us to momentum
We take the entry when the price moves up again and touches the 25 EMA from below, and then when it breaks above the 25 EMA, or even better, when a lovely green bullish candle forms. A bullish candle indicates good momentum. When a bullish candle closes in green, it means the momentum has increased significantly. This is when we enter a long trade, with the stop-loss just below the 50 EMA and the profit target being 1.5 times the stop-loss.
The same rule applies to the bearish trade.

Smart TP Manager V.1.0🔹 Smart TP Manager V1.0 is a complete trade management tool for TradingView.
It allows you to:
Automatically detect Long/Short signals using EMA crossovers, RSI filter, higher-timeframe EMA trend, and ADX.
Calculate and display a dynamic Stop Loss based on ATR.
Automatically set TP1, TP2, TP3 with Breakeven management (risk set to zero after TP1).
Track performance with a statistics table (Win/Loss, BE, win rate, net profit in R).
Get a clear visual display of entries, SL, and TP with colored lines and labels.
Receive automatic alerts for every signal or target reached.
📊 It’s a risk and trade exit management assistant designed to optimize your trades and secure your profits.

Nick2k Trend Tracker MT botNick2k Trend Tracker MT bot
Type: Indicator (signals + PineConnector alerts for EAs)
Markets: Designed for XAUUSD (gold), adaptable to other symbols
Timeframes: Optimized for M5/M15
---
What it does
Nick2k Trend Tracker MT bot identifies trend flips using a percentile-normalized SMA slope with hysteresis, then applies a multi-layer filter suite to avoid false signals in low-quality conditions.
It can optionally auto-manage trades via PineConnector:
Send open orders with SL/TP (ATR- or pip-based)
Breakeven activation
Dual trailing stops (pip-based or ATR-based)
Staged partial closes (up to 3 levels)
The indicator also:
Highlights chop zones in the background
Provides diagnostic labels showing which filters passed/failed
Lets you disable all alerts with one checkbox (visual testing mode)
---
Core logic (simplified)
Trend Engine: SMA slope normalized by a rolling percentile; flips with hysteresis at +0.1/–0.1.
Filters: optional checks for slope strength, ADX, narrow range ratio, ATR squeeze, higher-timeframe slope.
Sessions: entry/management can be gated to London, NY, Tokyo, Sydney sessions and weekdays.
Chop highlight: background shading when ranges/low-volatility are detected for consecutive bars.
---
Visuals
Colored SMA line (gradient by slope)
BUY/SELL labels at valid flip bars
Chop background (yellow overlay)
Filter score/diagnostic label (optional)
---
Alerts & PineConnector integration
Open orders: sent at valid BUY/SELL flips with embedded SL/TP + BE/trailing if enabled
Partial closes: 3 configurable milestones (ATR or pip based, % or fixed lots)
Master toggle: switch all alerts ON/OFF instantly
Alerts are formatted in PineConnector EA syntax for compatibility with MetaTrader auto-trading.
---
Inputs (organized by group)
SMA & Theme (length, colors)
Auto Trading (license, symbol, lots, master toggle)
SL/TP Target Type (prices vs pips)
ATR SL/TP (length, multipliers, rounding)
Breakeven (trigger/offset)
Pip Trailing (trigger/dist/step)
ATR Trailing (TF, period, multiplier, trigger)
Partial Closes (mode, lots or %)
Time Filters (sessions, weekdays)
Filters (Slope, ADX, NRR, ATR squeeze, HTF confirm)
Chop Zone Highlight (on/off, hold bars, color)
---
Why this script is unique (and closed-source)
This is not a simple moving-average crossover. It combines several custom-built methods that are rarely seen in public scripts:
Normalized SMA slope with hysteresis: avoids whipsaws, adapts to volatility regimes.
Multi-filter confirmation: ADX, NRR, ATR squeeze, HTF slope — stacked to improve quality.
Chop detection with persistence: custom counter/hold logic to highlight ranging markets.
Integrated trade management: PineConnector-ready messages with SL/TP, breakeven, dual trailing stops, staged partial closes.
EA-compatible syntax: formatted exactly for PineConnector EAs, including safety toggles.
This represents a full trading framework designed for semi-automated gold scalping, not just a “signal indicator.”
The source is protected to prevent clones and preserve development effort invested in unique logic and PineConnector integration.
---
Recommended starting settings (XAUUSD M5/M15)
Pip size: 0.10
Slope threshold: 0.20 (M5), 0.16–0.20 (M15)
ADX min: 18–22
NRR floor: 2.0–2.4
ATR ratio: 0.65–0.75
ATR SL/TP: SL = 1.5×ATR, TP = 2.5×ATR
Sessions: London & NY
---
Limitations & disclaimer
Not financial advice. Test on demo before live trading.
Performance depends on broker symbols, spread, and volatility regime.
Auto-trading requires PineConnector EA set up correctly.
---
Changelog
v1.0 – Initial release (trend engine, filters, sessions, chop highlight, PineConnector alerts, BE/trailing, partial closes, diagnostics)

PongExperience PONG! The classic arcade game, now on your charts!
With this indicator, you can finally achieve your lifelong dream of beating the Markets. . . at PONG!
Pong is jam-packed with features! Such as:
2 Paddles
A moving dot
Floating numbers
The idea of a net
This indicator is solely a visualization, it serves simply as an exercise to depict what is capable through PineScript. It can be used to re-skin other indicators or data, but on its own, is not intended as a market indicator.
With that out of the way...
> PONG
The Pong indicator is a recreation of the classic arcade game Pong developed to pit the markets against the cold hard logic of a CPU player.
Given the lack of interaction that is capable, the game is not played in the typical sense, by a player and computer or 2 players.
This version of Pong uses the chart price movements to control the "Market" Paddle, and it is contrasted by a (not AI) "CPU" Paddle, which is controlled by its own set of logic.
> Market Paddle
The Market Paddle is controlled by a data source which can be input by the user.
By default (Auto Mode), the Market Paddle is controlled through a fixed length Donchian channel range, pinning the range high to 100 and range low to 0. As seen below.
This can be altered to use data from different symbols or indicators, and can optionally be smoothed using multiple types of Moving Averages.
In the chart below, you can see how the RSI indicator is imported and smoothed to control the Market Paddle.
Note: The Market Paddle follows the moving average. If not desired, simply set the "Smoothing" input to "NONE".
> CPU Paddle
In simple terms, the CPU Paddle is a handicapped Aimbot.
Its logic is, more or less, "move directly towards the ball's vertical location".
If it were allowed to have full range of the screen, it would be impossible for it to lose a point. Due to this, we must slow it down to "play fair"... as fair as that may be.
The CPU Paddle is allowed to move at a rate specified by a certain Percent of its vertical width. By default, this is set to 2%.
Each update, the CPU Paddle can advance up or down 2% of its vertical width. The directional movement is determined based on the angle of the ball, and it's current position relative to the CPU Paddle's position. Given that it is not a direct follow, it may at times seem more... "human".
When a point is scored, the CPU paddle maintains its position, similar to the original Pong game, the paddles were controlled solely by the raw output of the controllers and did not reset.
> Ball
At the start of each point, the ball begins at the center of the screen and moves in a randomly determined angle at its base speed.
The direction is determined by the player who scored the last point. The loser of the last point "serves" the ball.
Given the circumstances, serving is a gigantic advantage. So the loser serving is just another place where the Market is given an advantage.
The ball's base speed is 1, it will move 1 (horizontal) bar on each update of the script. This speed can "technically" increase to infinity over time, if given the perfect rally. This is due to the hit logic as described below.
Note: The minimum ball speed is also 1.
> Bonk Math
When the ball hits a paddle, essentially 3 outcomes can occur, each resulting in the ball's direction being changed from positive to negative.
Action A: Its angle is doubled, and its speed is doubled.
Action B: Its angle is reversed, and its speed is decreased if it is going faster than base speed.
Action C: Its angle is preserved, and its speed is preserved. "Basic Bounce"
Each paddle is segmented into 3 zones, with the higher and lower tips (20%) of the paddles producing special actions.
The central 60% of each paddle produces a basic bounce. The special actions are determined by the trajectory of the ball and location on the paddle.
> Custom Mode
As stated above, the script loads in "Auto Mode" by default. While this works fine to simply watch the gameplay, the Custom Mode unlocks the ability to visualize countless possibilities of indicators and analyses playing Pong!
In the chart below, we have set up the game to use the NYSE TICK Index as our Market Player. The NYSE TICK Index shows the number of NYSE stocks trading on an uptick minus those on a downtick. Its values fluctuate throughout the day, typically ranging between +1000 and -1000.
Therefore, we have set up Pong to use Ticker USI:TICK and set the Upper Boundary to 1000 and Lower Boundary to -1000. With this method, the paddle is directly controlled by the overall (NYSE) market behaviors.
As seen in a chart earlier, you can also take advantage of the Custom Mode to overlay Pong onto traditional oscillators for use anywhere!
> Styles
This version of Pong comes stocked with 5 colorways to suit your chart vibes!
> Pro Tips & Additional Information
- This game has sound! For the full experience, set alerts for this indicator and a notification sound will play on each hit!*
*Due to server processing, the notification sounds are not precisely played at each hit. :(
- In auto mode, decreasing the length used will give an advantage to the market, as its actions become more sporadic over this window.
- The CPU logic system actually allows the market to have a "technical" edge, since the Market Paddle is not bound to any speed, and is solely controlled by the raw market movements/data input.
- This type of visualization only works on live charts, charts without updates will not see any movement.
- Indicator sources can only be imported from other indicators on the same chart.
- The base screen resolution is 159 bars wide, with the height determined by the boundaries.
- When using a symbol and an outside source, be mindful that the script is attempting to pull the source from the input symbol. Data can appear wonky when not considering the interactions of these inputs.
There are many small interesting details that can't be seen through the description. For example, the mid-line is made from a box. This is because a line object would not appear on top of the box used for the screen. For those keen eye'd coders, feel free to poke around in the source code to make the game truly custom.
Just remember:
The market may never be fair, but now at least it can play Pong!
Enjoy!

Sessions - Full HeightEN : Full-height background sessions using bgcolor(). Asia, London, and New York sessions with configurable time windows, colors, and timezone. Open-source for learning and reuse.
RU : Индикатор заливает фон сессий на всю высоту графика (Азия, Лондон, Нью-Йорк). Настраиваемые окна времени и цвета.

Alpha VolumeThis script is a comprehensive trading toolkit designed to integrate position sizing, risk management, and key data metrics directly onto your chart. It goes beyond a simple volume indicator by providing two interactive tables and a special volume signal to aid in trade planning and analysis.
What It Does
The "Alpha Volume" indicator is a multi-functional tool that helps traders make more informed decisions. Its core components are:
- A Position Size Calculator that dynamically determines how many shares to trade based on your account size, risk tolerance, and different stop-loss strategies.
- A Data Metrics Table that displays essential fundamental information like Market Cap, Industry, Sector, and Float shares.
- An Episodic Pivot (EP) signal that highlights bars with exceptionally high volume, pinpointing potentially significant market events.
Key Features
Dynamic Position Sizing: Automatically calculates the ideal trade size based on various stop-loss points:
- The low or high of the day.
- The midpoint of the current candle.
- Three customizable fixed percentage stop-losses (e.g., 0.75%, 1.00%, 1.25%).
Interactive Risk Management: After you enter a trade, you can input your actual entry price and quantity. The script will then calculate:
- The exact stop-loss price required to meet your predefined risk.
- The distance to your stop-loss in both percentage and currency.
- Up to 10 R-Multiple price targets to help with profit-taking.
On-Chart Fundamental Data: The Data Metrics table provides a quick snapshot of the company's financial health and classification, saving you from switching between screens.
- Episodic Pivot Signal: A simple triangle appears below a daily candle when its volume surpasses a user-defined threshold (e.g., 9 million shares), drawing your attention to stocks under significant accumulation or distribution.
How to Use
Pre-Trade Planning:
- In the indicator settings, enter your Capital and define your Risk per trade (either as a percentage like 0.5% or a fixed currency amount like $5000).
- The "Position Size Table" will instantly show you the quantity you can trade based on different potential stop-loss levels. For example, Q shows the quantity if your stop is the day's low, and SQ shows quantities for fixed percentage stops.
Trade Execution & Management:
- Once you're in a trade, enter your Position Opened (PO) price and Quantity Actual (QA) in the settings.
- The second table will update to show your calculated stop-loss (PC), the distance to it (DA), and your R-Multiple targets (RM), giving you a clear plan for managing the trade.
Market Analysis:
- Use the Episodic Pivot signal on the daily chart to identify stocks experiencing unusual volume, which often precedes significant price moves.
- Glance at the Data Metrics Table to quickly understand the company's size (Market Cap) and business (Industry/Sector).

Transaction Value Alert (4Cr+)Transactions with a value of INR 4 crore or above on a one-minute candle indicate FII or DII activity and confirms momentum and is an excellent indicator for the intraday trading

地狱5分钟One-Sentence Summary
A 5-minute overlay indicator that fires confirmed buy / sell arrows when
( custom momentum-exhaustion counter OR adaptive cRSI extreme OR StochRSI extreme )
passes a user-defined sensitivity filter and a minimum-bar-distance gate, then auto-audits each signal in real time.
The Three Engines (TD-Free Wording)
A. Adaptive cRSI
Dominant-cycle RSI with auto-generated dynamic upper/lower bands.
Period, vibration and “levelling” are all adjustable.
B. StochRSI
Classic stochastic of RSI with independent length & smoothing controls.
C. Momentum-Exhaustion Counter
Counts consecutive bars where close is consistently higher (or lower) than the close 4 bars ago.
When the count reaches a user-set threshold (default 9) an “exhaustion” flag is raised.
Signal Workflow
Each engine contributes 0 or 1 point to a bull or bear score.
A raw signal candidate appears when total score ≥ 3 × sensitivity.
After the bar closes and the minimum-signal-distance test is passed, the candidate becomes confirmed.
Entry price, bar index, China-time timestamp, score and exhaustion status are logged.
Real-Time Back-Test
Every confirmed signal is stored in a SignalData array.
After backtest_minutes (user-defined) the script checks if price has moved in the signal’s favour and marks the trade win/loss.
Win-rate, streaks, exhaustion-edge and flat-money P&L (fixed bet & payout) are updated instantly.
Results are aggregated by China calendar day (UTC+8) in a DailyStats array.
Visual Output
Shapes
– Green ▲ = normal long Lime ▲ = exhaustion long
– Red ▼ = normal short Orange ▼ = exhaustion short
Price labels show exact entry.
“B” / “S” characters mark exhaustion bars.
Two live tables display overall stats, exhaustion edge, longest streaks, strategy profit and today’s China-time P&L.
Alert Library (TD-Free)
Alerts fire on:
every confirmed signal (exhaustion vs normal)
exhaustion win-rate ≥ 70 %
overall win-rate ≥ 65 %
win/loss streak milestones
daily profit/loss thresholds
Input Groups
cRSI, StochRSI, exhaustion-counter parameters
Signal sensitivity & minimum distance
OB/OS thresholds for both RSIs
Back-test duration, bet size, payout ratio
Toggle for on-chart tables

Shashwat Khurana (v6) – VWAP ±1SD + RSI + ATR Filter A multi-factor volatility-adjusted mean-reversion model integrating dynamic liquidity thresholds and higher-order momentum filters for asymmetric risk calibration
