ABCD Harmonic Pattern [TradingFinder] ABCD Pattern indicator🔵 Introduction
The ABCD harmonic pattern is a tool for identifying potential reversal zones (PRZ) by using Fibonacci ratios to pinpoint critical price reversal points on price charts.
This pattern consists of four key points, labeled A, B, C, and D. In this structure, the AB and CD waves move in the same direction, while the BC wave acts as a corrective wave in the opposite direction.
The ABCD pattern follows specific Fibonacci ratios that enhance its accuracy in identifying PRZ. Typically, point C lies within the 0.382 to 0.886 Fibonacci retracement of the AB wave, indicating the correction extent of the BC wave.
Subsequently, the CD wave, as the final wave in this pattern, reaches point D with a Fibonacci extension between 1.13 and 2.618 of the BC wave. Point D, which marks the PRZ, is where a potential price reversal is likely to occur.
The ABCD pattern appears in both bullish and bearish forms. In the bullish ABCD pattern, prices tend to increase at point D, which defines the PRZ; in the bearish ABCD pattern, prices typically decrease upon reaching the PRZ at point D.
These characteristics make the ABCD pattern a popular tool for identifying PRZ and price reversal points in financial markets, including forex, cryptocurrencies, and stocks.
Bullish Pattern :
Beaish Pattern :
🔵 How to Use
🟣 Bullish ABCD Pattern
The bullish ABCD pattern is another harmonic structure used to identify a potential reversal zone (PRZ) where the price is likely to rise after a downward movement. This pattern includes four main points A, B, C, and D. In the bullish ABCD, the AB and CD waves move downward, and the BC wave acts as a corrective, upward wave. This setup creates a PRZ at point D, where the price may reverse and move upward.
To identify a bullish ABCD pattern, begin with the downward AB wave. The BC wave retraces upward between 0.382 and 0.886 of the AB wave, indicating the extent of the correction.
After the BC retracement, the CD wave forms and extends from point C down to point D, with an extension of around 1.13 to 2.618 of the BC wave. Point D, as the PRZ, represents the area where the price may reverse upwards, making it a strategic level for potential buy positions.
When the price reaches point D in the bullish ABCD pattern, traders look for upward reversal signals. This can include bullish candlestick formations, such as hammer or morning star patterns, near the PRZ to confirm the trend reversal. Entering a long position after confirmation near point D provides a calculated entry point.
Additionally, placing a stop loss slightly below point D helps protect against potential loss if the reversal does not occur. The ABCD pattern, with its precise Fibonacci structure and PRZ identification, gives traders a disciplined approach to spotting bullish reversals in markets, particularly in forex, cryptocurrency, and stock trading.
Bullish Pattern in COINBASE:BTCUSD :
🟣 Bearish ABCD Pattern
The bearish ABCD pattern is a harmonic structure that indicates a potential reversal zone (PRZ) where price may shift downward after an initial upward movement. This pattern consists of four main points A, B, C, and D. In a bearish ABCD, the AB and CD waves move upward, while the BC wave acts as a corrective wave in the opposite, downward direction. This reversal zone (PRZ) can be identified with specific Fibonacci ratios.
To identify a bearish ABCD pattern, start by observing the AB wave, which forms as an upward price movement. The BC wave, which follows, typically retraces between 0.382 to 0.886 of the AB wave. This retracement indicates how far the correction goes and sets the foundation for the next wave.
Finally, the CD wave extends from point C to reach point D with a Fibonacci extension of approximately 1.13 to 2.618 of the BC wave. Point D represents the PRZ where the potential reversal may occur, making it a critical area for traders to consider short positions.
Once point D in the bearish ABCD pattern is reached, traders can anticipate a downward price movement. At this potential reversal zone (PRZ), traders often wait for additional bearish signals or candlestick patterns, such as engulfing or evening star formations, to confirm the price reversal.
This confirmation around the PRZ enhances the accuracy of the entry point for a bearish position. Setting a stop loss slightly above point D can help manage risk if the price doesn’t reverse as anticipated. The ABCD pattern, with its reliance on Fibonacci ratios and clearly defined points, offers a strategic approach for traders looking to capitalize on potential bearish reversals in financial markets, including forex, stocks, and cryptocurrencies.
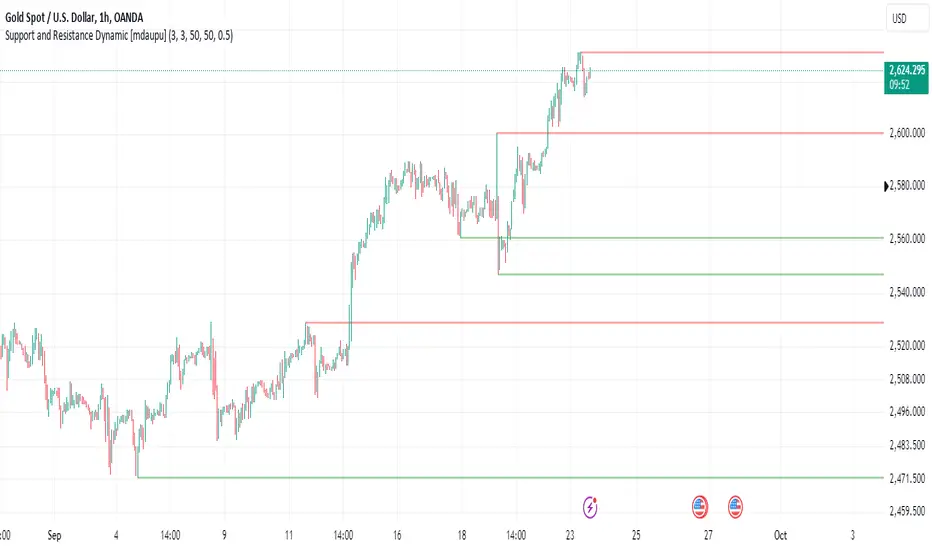
Bearish Pattern in OANDA:XAUUSD :
🔵 Setting
🟣 Logical Setting
ZigZag Pivot Period : You can adjust the period so that the harmonic patterns are adjusted according to the pivot period you want. This factor is the most important parameter in pattern recognition.
Show Valid Forma t: If this parameter is on "On" mode, only patterns will be displayed that they have exact format and no noise can be seen in them. If "Off" is, the patterns displayed that maybe are noisy and do not exactly correspond to the original pattern.
Show Formation Last Pivot Confirm : if Turned on, you can see this ability of patterns when their last pivot is formed. If this feature is off, it will see the patterns as soon as they are formed. The advantage of this option being clear is less formation of fielded patterns, and it is accompanied by the latest pattern seeing and a sharp reduction in reward to risk.
Period of Formation Last Pivot : Using this parameter you can determine that the last pivot is based on Pivot period.
🟣 Genaral Setting
Show : Enter "On" to display the template and "Off" to not display the template.
Color : Enter the desired color to draw the pattern in this parameter.
LineWidth : You can enter the number 1 or numbers higher than one to adjust the thickness of the drawing lines. This number must be an integer and increases with increasing thickness.
LabelSize : You can adjust the size of the labels by using the "size.auto", "size.tiny", "size.smal", "size.normal", "size.large" or "size.huge" entries.
🟣 Alert Setting
Alert : On / Off
Message Frequency : This string parameter defines the announcement frequency. Choices include: "All" (activates the alert every time the function is called), "Once Per Bar" (activates the alert only on the first call within the bar), and "Once Per Bar Close" (the alert is activated only by a call at the last script execution of the real-time bar upon closing). The default setting is "Once per Bar".
Show Alert Time by Time Zone : The date, hour, and minute you receive in alert messages can be based on any time zone you choose. For example, if you want New York time, you should enter "UTC-4". This input is set to the time zone "UTC" by default.
🟣 Conclusion
The ABCD harmonic pattern offers a structured approach in technical analysis, helping traders accurately identify potential reversal zones (PRZ) where price movements may shift direction. By leveraging the relationships between points A, B, C, and D, alongside specific Fibonacci ratios, traders can better anticipate points of market reversal and make more informed decisions.
Both the bearish and bullish ABCD patterns enable traders to pinpoint ideal entry points that align with anticipated market shifts. In a bearish ABCD, point D within the PRZ often signals a downward trend reversal, while in a bullish ABCD, this same point typically suggests an upward reversal. The adaptability of the ABCD pattern across different markets, such as forex, stocks, and cryptocurrencies, further highlights its utility and reliability.
Integrating the ABCD pattern into a trading strategy provides a methodical and calculated approach to entry and exit decisions. With accurate application of Fibonacci ratios and confirmation of the PRZ, traders can enhance their trading precision, reduce risks, and boost overall performance. The ABCD harmonic pattern remains a valuable resource for traders aiming to leverage structured patterns for consistent results in their technical analysis.
Pivot

ICT Setup 02 [TradingFinder] Breaker Blocks + Reversal Candles🔵 Introduction
The "Breaker Block" concept, widely utilized in ICT (Inner Circle Trader) technical analysis, is a crucial tool for identifying reversal points and significant market shifts. Originating from the "Order Block" concept, Breaker Blocks help traders pinpoint support and resistance levels. These blocks are essential for understanding market trends and recognizing optimal entry and exit points.
A Breaker Block is essentially a failed Order Block that changes its role when price action breaks through it. When an Order Block fails to hold as a support or resistance level, it reverses its function, becoming a Breaker Block.
There are two primary types : Bullish Breaker Blocks and Bearish Breaker Blocks. These Breaker Blocks align with the prevailing market trend and indicate potential entry points after a liquidity sweep or a shift in market structure.
Understanding and applying the Breaker Block strategy enables traders to capitalize on the behavior of institutional investors, enhancing their trading outcomes.
Bullish Setup :
Bearish Setup :
🔵 How to Use
The ICT Setup 02 indicator designed to automate the identification of Bullish and Bearish Breaker Blocks. This tool enables traders to easily spot these blocks on a chart and utilize them for entering or exiting trades. Below is a breakdown of how to use this indicator in both bullish and bearish setups.
🟣 Bullish Breaker Block Setup
A Bullish Breaker Block setup is identified in an uptrend, where it serves as a potential entry point. This setup occurs when a Bearish Order Block fails and the price moves above the high of that Order Block. In this scenario, the previously bearish Order Block turns into a Bullish Breaker Block, which now acts as a support level for the price.
To trade a Bullish Breaker Block, wait for the price to retest this newly formed support level. Confirmation of the uptrend can be achieved by analyzing lower time frames for further market structure shifts or other bullish indicators.
A successful retest of the Bullish Breaker Block provides a high-probability entry point for a long trade, as it signals institutional support. Traders often place their stop-loss below the low of the Breaker Block zone to minimize risk.
🟣 Bearish Breaker Block Setup
A Bearish Breaker Block setup, conversely, is used in a downtrend to identify potential sell opportunities. This setup forms when a Bullish Order Block fails, and the price moves below the low of that Order Block.
Once this Order Block is broken, it reverses its role and becomes a Bearish Breaker Block, providing resistance to the price as it pushes downward. For a Bearish Breaker Block trade, wait for the price to retest this resistance level.
A confirmation of the downtrend, such as a market structure shift on a lower time frame or additional bearish signals, strengthens the setup. The Bearish Breaker Block retest provides an opportunity to enter a short position, with a stop-loss placed just above the high of the Breaker Block zone.
🔵 Settings
Pivot Period : This setting controls the look-back period used to identify pivot points that contribute to the detection of Order Blocks. A higher period captures longer-term pivots, while a lower period focuses on more recent price action. Adjusting this parameter allows traders to fine-tune the indicator to match their trading time frame.
Breaker Block Validity Period : This setting defines how long a Breaker Block remains valid based on the number of bars elapsed since its formation. Increasing the validity period keeps Breaker Blocks active for a longer duration, which can be useful for higher time frame analysis.
Mitigation Level BB : This option lets traders choose the level of the Order Block at which the price is expected to react. Options like "Proximal," "50% OB," and "Distal" adjust the zone where a reaction may occur, offering flexibility in setting up the entry and stop-loss levels.
Breaker Block Refinement : The refinement option refines the Breaker Block zone to display a more precise range for aggressive or defensive trading approaches. The "Aggressive" mode provides a tighter range for risk-tolerant traders, while the "Defensive" mode expands the zone for those with a more conservative approach.
🔵 Conclusion
The Breaker Block indicator provides traders with a sophisticated tool for identifying key reversal zones in the market. By leveraging Breaker Blocks, traders can gain insights into institutional order flow and predict critical support and resistance levels.
Using Breaker Blocks in conjunction with other ICT concepts, like Fair Value Gaps or liquidity sweeps, enhances the reliability of trading signals. This indicator empowers traders to make informed decisions, aligning their trades with institutional moves in the market.
As with any trading strategy, it is crucial to incorporate proper risk management, using stop-losses and position sizing to minimize potential losses. The Breaker Block strategy, when applied with discipline and thorough analysis, serves as a powerful addition to any trader’s toolkit.

Swing Percentile Lines [QuantVue]The Swing High/Low Percentile Indicator is designed to help traders identify key price levels based on the most recent swing high and low. By anchoring to the most recent swing high and swing low, the indicator automatically generates percentile lines ( 25%, 50%, 75%) that act as dynamic support and resistance levels.
What Does the Indicator Do?
The Swing High/Low Percentile Indicator works by identifying the most recent significant price swings, whether it's a swing high or swing low. It then calculates the range between these points and divides the distance into percentage-based levels. These levels are plotted on the chart as clear, easy-to-read lines at 25%, 50%, and 75% of the range between the swing high and low.
These percentile lines serve as dynamic price zones where traders can anticipate potential reactions, whether the market is trending or consolidating.
How Can Traders Use the Indicator?
Support and Resistance: The percentile lines act as evolving support and resistance zones. Traders can anticipate price bounces or breaks at these levels, providing opportunities for trend-following or reversal trades.
Trend Identification: The indicator helps traders determine the strength of a trend. In a strong uptrend, price will likely stay above the 50% or 75% lines, while in a downtrend, it may remain below the 50% or 25% lines. This gives traders an edge in recognizing the overall market direction.
Entry and Exit Points: Traders can use the percentile lines to time their entries and exits. For example, entering a trade on a pullback to the 25% or 50% line offers a favorable risk-to-reward ratio. Similarly, the percentile lines serve as natural profit targets, allowing traders to plan exits as the price approaches the 50% or 75% levels.
Risk Management: The clear delineation of price levels makes it easy for traders to set stop-loss orders. For example, if price falls below the 25% line in an uptrend, it may signal weakness, prompting an exit or reduced position size.
Breakout and Breakdown Scenarios: When price breaks above a recent swing high or below a swing low, the percentile lines provide traders with pullback entry opportunities or key levels to watch for continuation of the move.

Polygonal Pivot Bands [FXSMARTLAB]The Polygonal Pivot Bands highlights key price pivots, dynamic support and resistance levels, and recent price action on a trading chart. This indicator connects pivot highs and lows with a zigzag line, extends a real-time dashed line to the latest price point, and plots diagonal support/resistance levels that adapt to price movement. These elements together provide traders with a view of significant price zones and potential trend shifts.
Key Components of the Indicator
Pivots are calculated based on user-defined lengths, specifying how many bars on either side of a high or low are required to validate it as a pivot.
Adjustable left and right pivot lengths allow traders to control the sensitivity of pivot detection, with higher values resulting in fewer, more prominent pivots, and lower values increasing sensitivity to price changes.
Zigzag Line
The zigzag line connects consecutive pivot points, filtering out smaller fluctuations and emphasizing the broader direction of price movement.
Users can customize the line's color and thickness to match their preferences, helping them focus on larger trends and potential reversal points.
By linking pivot highs and lows, the zigzag pattern highlights the overall trend and potential points of reversal.
Real-Time Connector Line
A dashed line extends from the last confirmed pivot to the latest price point, providing a real-time, bar-by-bar update of the current price relative to the previous pivot.
This line does not project future price direction but maintains an up-to-date connection with the current price, showing the distance from the last pivot.
Its color and thickness are customizable for improved visibility on the chart.
Dynamic Support and Resistance Levels
The indicator plots dynamic support and resistanc e levels by connecting recent pivot highs and lows, resulting in lines that may appear diagonal rather than strictly horizontal.
These levels move in line with price action, adapting to the natural direction of trends, and offer visual cues where price may encounter support or resistance.
Colors and thickness of these lines can be set individually, allowing traders to adjust visibility according to their preferences.
Enabling these lines gives traders an ongoing reference for critical price boundaries that align more closely with the overall trend.

5-0 Harmonic Pattern [TradingFinder] 0XABCD 50 Harmonic Detector🔵 Introduction
Harmonic patterns are a powerful tool in technical analysis, widely used to detect reversal points and trend changes. Among these, the 5-0 Harmonic Pattern stands out due to its reliance on specific Fibonacci ratios—1.13, 1.618, 2.24, and 0.45 to 0.55—anchored at points 0, X, A, B, C, and D. This pattern provides a structured approach for identifying critical buy and sell points, helping traders achieve optimal entry and exit levels in volatile markets.
This 5-0 Harmonic Pattern indicator automatically detects and marks bullish and bearish formations on the chart, offering precise trading signals based on established harmonic ratios. With its dynamic signals, the 5-0 pattern enables traders to anticipate market movements and capitalize on favorable price trends.
Especially in fast-moving markets, harmonic patterns, particularly the 5-0 Harmonic Pattern, equip traders with an essential framework for identifying reversal opportunities and refining their trading strategies.
Bullish 5-0 Pattern :
Bearish 5-0 Pattern :
🔵 How to Use
The 5-0 Harmonic Pattern indicator is designed to automatically mark the key levels of the harmonic structure: 0, X, A, B, C, and D. By doing so, it detects both bullish and bearish patterns and helps traders recognize optimal entry and exit points.
Formed through specific Fibonacci levels, this pattern signals potential shifts in trend direction, giving traders critical insights for managing entries and exits effectively. The tool proves valuable in high-volatility settings, enabling traders to leverage these signals for refined decision-making.
🟣 Bullish 5-0 Pattern
A bullish 5-0 pattern materializes when Fibonacci levels indicate a potential price reversal to the upside. With points 0, X, A, B, C, and D in alignment, the indicator highlights this upward momentum by displaying a green arrow as a buy signal on the chart. This marking provides a clear entry point, indicating that prices are likely to rise, making it a prime moment for traders to enter long positions.
Additionally, the bullish 5-0 pattern is equipped with tools for traders to set stop-loss and take-profit points based on harmonic lines within the pattern, which represent support and resistance levels. Using these dynamic points, traders can create a more effective risk-reward setup while following the bullish signals in a standalone harmonic strategy.
🟣 Bearish 5-0 Pattern
The bearish 5-0 pattern functions similarly but signals a likely downturn. This pattern emerges when Fibonacci ratios align at points 0, X, A, B, C, and D, predicting a reversal downward. The indicator generates a sell signal, marked by a red arrow, prompting traders to exit long positions or initiate short trades to capitalize on falling prices.
Traders can utilize this bearish pattern for defining exit strategies and setting key levels for stop-loss and take-profit orders. The bearish 5-0 pattern enhances traders’ abilities to gauge critical price levels and manage trade risk effectively, especially in volatile markets. For traders focused on profiting from downward trends, this indicator serves as a powerful tool for timely entries and exits.
🔵 Setting
🟣 Logical Setting
ZigZag Pivot Period : You can adjust the period so that the harmonic patterns are adjusted according to the pivot period you want. This factor is the most important parameter in pattern recognition.
Show Valid Forma t: If this parameter is on "On" mode, only patterns will be displayed that they have exact format and no noise can be seen in them. If "Off" is, the patterns displayed that maybe are noisy and do not exactly correspond to the original pattern.
Show Formation Last Pivot Confirm : if Turned on, you can see this ability of patterns when their last pivot is formed. If this feature is off, it will see the patterns as soon as they are formed. The advantage of this option being clear is less formation of fielded patterns, and it is accompanied by the latest pattern seeing and a sharp reduction in reward to risk.
Period of Formation Last Pivot : Using this parameter you can determine that the last pivot is based on Pivot period.
🟣 Genaral Setting
Show : Enter "On" to display the template and "Off" to not display the template.
Color : Enter the desired color to draw the pattern in this parameter.
LineWidth : You can enter the number 1 or numbers higher than one to adjust the thickness of the drawing lines. This number must be an integer and increases with increasing thickness.
LabelSize : You can adjust the size of the labels by using the "size.auto", "size.tiny", "size.smal", "size.normal", "size.large" or "size.huge" entries.
🟣 Alert Setting
Alert : On / Off
Message Frequency : This string parameter defines the announcement frequency. Choices include: "All" (activates the alert every time the function is called), "Once Per Bar" (activates the alert only on the first call within the bar), and "Once Per Bar Close" (the alert is activated only by a call at the last script execution of the real-time bar upon closing). The default setting is "Once per Bar".
Show Alert Time by Time Zone : The date, hour, and minute you receive in alert messages can be based on any time zone you choose. For example, if you want New York time, you should enter "UTC-4". This input is set to the time zone "UTC" by default.
Conclusion
The 5-0 Harmonic Pattern indicator serves as a robust solution for technical analysts and traders looking to pinpoint market reversal points. By automatically recognizing 5-0 patterns and generating buy and sell signals based on Fibonacci ratios, this tool supports precise trend analysis and entry/exit timing. The indicator’s adjustable alerts, color themes, and pattern toggles allow for comprehensive customization, ensuring alignment with individual trading strategies.
Harmonic patterns, especially the 5-0 Harmonic Pattern, guide traders in identifying high-accuracy entry and exit points, thus aiding in more informed trading decisions. By combining Fibonacci ratio analysis with real-time signal updates, this indicator provides a well-rounded approach for risk management and capitalizing on trading opportunities. Professional traders can harness this tool to enhance technical analysis precision and capitalize on price trends effectively, maximizing profitability in both bullish and bearish markets.

Support Resistance Pivot EMA Scalp Strategy [Mauserrifle]A strategy that creates signals based on: pivots, EMA 9+20, RSI, ATR, VWAP, wicks and volume.
The strategy is developed as a helper for quick long option scalping. This strategy is primarily designed for intraday trading on the 2m SPY chart with extended hours. However, users can adapt it for use on different symbols and timeframes. These signals are meant as a helper rather than fully automated trading bots.
One of the key elements is its pivot-based calculation, driven by my integrated indicator "Support and Resistance Pivot Points/Lines ". It enables multi-timeframe pivot calculations which are used to generate the signals and offers customizability, allowing you to define rounding methods and cooldown periods to refine pivot levels. The pivots, in combination with EMA crossovers, VWAP trend, and additional filters (RSI, ATR, VWAP, wicks and volume), create an entry and exit strategy for scalping opportunities that is useful for 0/1 DTE options with an average trade time of six minutes with the default setup for SPY. Option trading should be done outside TradingView. At this moment of release there is no option trading support.
All parameters used in the strategy are tweaked based on deep backtests results and real-time behavior. Be mindful that past performance does not guarantee future results.
The strategy is designed for intermediate and advanced users who are familiar intraday option scalping techniques.
How It Works
The strategy identifies entries based on multiple conditions, including: recently above pivot, recent EMA crossovers, RSI range, candle patterns, and VWAP uptrend. It avoids trades below the VWAP lower band due to poor backtesting results in those conditions. It creates a great number of signals when it detects an uptrend, which entails: VWAP and its lower/upper band slopes are going up, and the number of next high pivot points is greater than the number of lower pivot points. This indicates that we hope it will keep going up. In historical testing, this showed favorable results. This uptrend criteria runs on 15m charts max (where up to the VWAP effectiveness is the greatest).
The strategy also checks for candle and volume patterns, identified in backtesting to improve entry levels on historic data. Which include:
A red candle after multiple green ones, hoping to jump on a trend during a small pullback
Zero lower wick
Percentage and volume is up after lower volume candles
Percentage is up and the first and second EMA slopes are going up
Percentage is up, the first EMA is higher than the second, the price low is below the second EMA and price close above it
The VWAP uptrend overrules the candle and volume conditions (thus lots of signals during those moments).
The above is the base for many signals. There is a strict mode that adds extra checks such as:
not trading when there is no next low or high pivot
requiring a VWAP uptrend only
minimum candle percentages
This mode is for analyzing history and seeing performance during these conditions. It is worth it to create a separate alert for strict mode so you are aware of these conditions during trading.
When no stop has been defined, exits will always happen on pivot crossunder confirmations. If a stop is defined (default config), the strategy exits a position when:
the position is negative or no trail has been set
at least 1 bar has past
OR no stop has been defined (overrules previous)
trail has not been activated
The second exit condition happens when the close is below first EMA(9 by default) and when:
the position has been above first EMA
the gap between close and last pivot isn't small
the position is negative or no trail has been set
OR no stop has been defined (overrules above)
trail has not been activated
There are some more variations on this but the above are the most common. These exit conditions are a safety net because the strategy heavily relies on and favors stops. The settings allow changing stops, profit takers and trails. You can configure it to always sell without the conditions above.
The script will paint the pivot lines, trailing activation/stops, EMAs and entry/exits; with extra information in the data panel. For a complete view add VWAP and RSI to your chart, which are available from TradingView official indicator library. The strategy will not rely on those added indicators since VWAP and RSI are programmed in. You can add them to track the behavior of the signals based on these filters you have configured and have a complete view trading this strategy.
As mentioned earlier, the default settings are built for SPY 2m charts, with extended hours and real-time data. Open the strategy on this chart to study how all input parameters are used. If you don't have real-time data you need to adjust the minimum volume settings (set it to 0 at first).
The backtest
The default backtest configuration is set up to simulate SPY option trading.
Start capital is set to 10,000 and we risk around 5% of that per trade (1 contract)
Commission is set to 0.005%. The reason: at the time of this publication the SPY index price is approximately $580. Two ITM 0/1 DTE options contracts, each priced around $280, which is approximately $560. The typical commission for such a trade is around $3. To simulate this commission in the backtest on the SPY index itself, a commission of 0.005% per trade has been applied, approximating the options trading costs.
Slippage of 3 is set reflecting liquid SPY
The bar magnifier feature is turned on to have more realistic fills
Trading
In backtesting, setting commission and slippage to 0 on the SPY 2m chart shows many trades result around breaking even. Personally, I view them as an opportunity and safety net to help manage emotional decisions for exits. The signals are designed for short option scalps, allowing traders to take small profits and potentially re-enter during the strategy’s position window. It's advisable to take small potential profits, such as 4%, whenever the opportunity arises and consider re-entering if the setup still looks favorable, for example price still above ema9. Exiting a long position below ema9 is a common strategy for 2m scalping.
The average trade duration is approximately 6 minutes (3 bars). The choice between ITM (in-the-money), ATM (at-the-money), or OTM (out-of-the-money) options will depend on your trading style. Personally, I’ve seen better results with ITM options because they tend to move more in sync with the underlying index, thanks to their higher delta.
It’s important to note that the signals are designed to be a helper for manual trading rather than to automate a bot. Users are encouraged to take small profits and re-enter positions if favorable conditions persist. Be mindful that past performance does not guarantee future results.
For the default SPY setup the losses will mostly be 4-10% for ITM options. Be mindful of extreme volatile conditions where losses may reach 30% quickly, especially when trading ATM/OTM options.
The following settings can be changed:
8 pivot timeframes with left/right bars and days rendered
Here you can configure the timeframes for the pivots, which are crucial. The strategy wants that a crossover has happened recently (so it might enter after a crossunder if the crossover was recent) or the price is still above the crossed pivot.
When you decide to use a pivot timeframe higher than your chart, make sure it aligns the same starting point as the chart timeframe. As stated in the 43000478429 docs, there is a dependency between the resolution and the alignment of a starting point:
1–14 minutes — aligns to the beginning of a week
15–29 minutes — aligns to the beginning of a month
from 30 minutes and higher — aligns to the beginning of a year
This alignment also affects the setting of rendered days. I recommend a max value of 5 days for 1-14 minutes timeframes.
Also make sure a higher pivot timeframe can be divided by the lower. For instance I had repaint issues using 3m pivots on a 2m chart. But 4m pivots work fine.
Please look up docs 43000478429 to make sure this information is still up to date.
Pivot rounding
The pivot rounding option is used to add pivots based on a rounded price and limit the number of pivots. While this feature is disabled by default it can be useful with tweaking strategy variations, because many orders are placed at rounded levels and tend to act as strong price barriers.
There are multiple rounding methods: round, ceil/floor, roundn (decimal) and rounding to the minimal tick.
The next feature is a powerful extension called "Cooldown rounding":
Pivot cooldown rounding
This rounds new pivot levels for a cooldown period to keep the previous pivot line instead of adding a new line when they match the rounded value within the cooldown period. The existing line will be extended. This feature is useful because it makes sure the initial line is added to the exact high/low pivot level but any future lines within the rounding will just extend the existing line. This limits the number of pivots while still having precise levels (which normal rounding lacks) and allows more precise pivot trading.
This feature also helps ensure that the number of rendered lines will not exceed 500 too much, which is the render limit on TradingView.
You can set a maximum minutes for the cooldown. The default is 3 years which will enable the cooldown rounding permanently on the intraday (due to the max bar limit).
Pivot always added when new higher/lower pivot
When using cooldown rounding, one may find it useful to override this behavior when a new lower or higher pivot level has been reached. When enabled the new level will be added despite the fact that they may be rounded the same in the cooldown check. This is a good balance between limiting pivots but also allowing preciser trading.
VWAP bands multiplier
This is used to tweak the inner VWAP working for the upper and lower band. The default VWAP multiplier (0.9) is set based on backtesting since it performed better on historic data (the strategy does not trade below the lowerband). When you add the VWAP indicator from the TradingView library to the chart, make sure it uses the same multiplier setting as within this strategy so you have a correct view of the conditions the strategy acts on.
ATR EMA smoothing length
Used to tweak the ATR EMA smoothing. By default it is set up to 4 based on deep backtesting historic data.
EMA lengths
Changing the EMA length allows you to fine tune the EMA crossing behavior. By default the strategy is set up to EMA 9 and 20 which are considered commonly used values on the 2-minute chart.
Trading intraday time restrictions
For intraday charts you can configure when the strategy starts trading after market open and when it stops, including a hard sell. This makes sure there are no open positions left for the day during backtesting and can also aid in your trading style. For example some scalpers will not trade in the first two hours. Having no signals during this time can be beneficial. It is possible to configure these settings based on the number of bars or minutes.
Not trading on days the market closes earlier
By default the strategy does not trade on days the market closes earlier in the US. This makes sure there are no open positions left open during backtesting. Make sure to change it when using it on such a day. The days are: day before independence day, day after thanksgiving, Christmas eve and new years eve.
Not trading below VWAP lowerband
Backtesting has shown poor performance when trading below the VWAP lowerband but you are free to allow it to trade in such conditions. Past performance does not guarantee future results.
Minimum volume
A minimum volume can be set up. The current value is based on better deep backtest results for SPY using real-time data (48000). When you do not have a data plan for SPY, please set it to 0 and tweak based on backtests.
Minimum ATRP
The strategy has shown during my trading that it is sensitive to higher ATRP values and more volatile market conditions. There is more chance the index moves and we can profit from this during option scalping (if it moves in your favor). The default is based on SPY backtesting (0.04%), as a balance to have a lot of trades but also capture minimal movement.
RSI range
A RSI range can be set using a minimum and maximum value so we can limit trading during overbought/oversold conditions. Backtesting for SPY has shown the strategy performs better on historic data within a tighter range, so a default range has been set to 40-65.
Allow orders on every tick (no effect on stop/profit/trail)
This setting is used to allow orders on every tick. The strategy has been developed without trading on every tick but you can change this, for example when you have configured a setup different than the default configuration that you know works well with this. The default setup will not work well with it due to too many constant signals.
Stop percentage + ATRP threshold
One of the most important settings for managing the risk. I recommend setting a stop percentage first and later the ATRP threshold where the stop is calculated based on the current ATRP value. The calculated value will only be in effect when it is greater than the normal stop--the normal stop acts as baseline. The default stop is low (0.03). With a default ATRP threshold stop of 1.12, the calculated value overrules the normal stop when the value is greater. 0.03 acts as a minimum value but in reality the stop will most likely be higher on average for SPY with the default ATRP threshold.
For the default SPY setup the losses will be around 4-10% for ITM options. Be mindful of extreme volatile conditions where losses may reach 30% quickly, especially when trading ATM/OTM options.
Profit taker percentage + ATRP threshold
Same principles as the stop percentage above, but for profit taking. There is a very high ATRP threshold of 4 set by default. Backtests showed that trailing stops perform better on historic data.
Trailing stop
Used to set up a trailing stop. A useful feature to secure profit after a run-up, or get out with a small loss after initial activation. It is important to not use too tight values because they will give unrealistic backtest results and trigger too fast in real-time. Both the trail activation level and trail stop itself can be configured with a percentage value and ATRP value. I recommend setting up the ATRP last. By default the values are 0.05 for activation and 0.03 for the stop based on SPY real-time behavior.
Always sell on pivot crossunder confirmation
The strategy includes pivot crossunder confirmations as sell condition. By default it will not sell on every crossunder confirmation but checks for different conditions (explained in detail earlier in this description). You can change this behavior.
Always sell below first EMA when position has been above
The strategy sells below the first EMA when the position has been above it. By default it will not always sell but checks for different conditions (mentioned earlier in this description). You can change this behavior.
Buy modes pivot
By default the strategy buys between pivots as long as there has been a pivot crossover and EMAs crossover recently or price is still above it. You can change the behavior so it only buys on pivot crossovers or pivot crossover confirmations. Backtesting on the default setup shows decreased performance but for other strategy variations and pivot setups this feature can be useful since many scalpers do not buy between pivots.
Strict mode
There is a strict mode that adds extra checks such as not trading when there is no next low or high pivot, requiring a VWAP uptrend only and minimum candle percentages. This mode is for analyzing history and seeing performance during these conditions. It is worth it to create a separate alert for strict mode so you are aware of these conditions during trading. The deep backtests improved with these setting but past performance does not guarantee future results.
In the strict mode section you can override the stop, minimum ATRP, set up a minimum percentage, only trade VWAP uptrends and to not trade candles without a wick.
A summary and some extra detail
At the time of release only long trades are supported
The strategy is meant for quick scalping but one might find other uses for it
Enable extended hours on intraday charts so it captures more pivots
It does not trade extended hours (pre and post market) since options do not trade during those times
real-time data is recommended and required if a symbol has delayed data by default
You can configure that it trades minutes after market open and hard sells minutes after market open
The entries have a specific label text, example: "833 LE1 / 569.71 / P:569.8". This means: / / . The condition number is only for development/debug purposes for me when you have an issue.
The strategy cannot be tweaked to work on multiple symbols and timeframes with a single config. So you will have to make a config for every timeframe and symbol. I recommend using the Indicator Templates feature of TradingView. This way you can save the settings per timeframe and symbol
The strategy is per default config very dependent on (trailing) stops because it trades between pivots too. It wants that a pivot and EMA crossover has happened more recently than a crossunder. But you can change this behavior to always force crossover buys and crossunder sells.
It’s recommended to set up alerts to notify you of entry and exit signals. Watching the chart alone might cause you to miss trades, especially in fast-moving markets.
Only a max of 500 lines can be rendered on the chart, but the strategy will function with more under the hood. When you exceed 500 you will notice the beginning of the chart has no pivots, but beneath everything functions for backtesting.
Changing settings
Changing the settings for a different symbol and/or timeframe can be a challenging task. Here's a how-to you could use the first time to help you get going:
Set commission and slippage to 0. I prefer to do this so it is more clear whether you are balancing on break-even trades
Enable the pivot timeframe equal or above your chart timeframe. Avoid repainting as discussed earlier by choosing timeframes that align with the same timeframe
Set all volume, ATR, stop, profit takers and trail values to 0
Make sure strict mode is disabled at the bottom of the settings
You now have a clean state and you should see the backtest results purely based on pivot and EMA conditions
Tweak the stop and profit taker, beginning with the simple values and then ATRP threshold
At the last moment tweak the trailing stops. Tight trailing stops create an unrealistic backtest so you will need to tweak them based on real-time behavior of the symbol you're using which you will have to monitor during signals while the market is open. The default values are low (2m intraday SPY). Only with the bar magnifier feature it is somewhat possible to tweak realistic with history data. The tighter they are, the more unrealistic your backtest results. As a starting point, set the trailing stop low and find the highest activation level that doesn't change the results drastically, then increase the stop to the value you think reflects real-time behavior.
Keep refining by testing it during real-time behavior. Does it exit too early according to your own judgment? You need to increase the stop and maybe the activation level.
I hope you will find this useful!
DISCLAIMER
Trading is risky & most day traders lose money. This indicator is purely for informational & educational purposes only. Past performance does not guarantee future results.

Central Pivot Point Cross & Retrace Strategy // AlgoFyreThe Central Pivot Point Cross & Retrace Strategy uses pivot points for trend identification and trade entry. It combines accumulation/distribution indicators with pivot point levels to generate signals. The strategy incorporates dynamic position sizing based on a fixed risk amount and allows for both long and short positions with customizable stop-loss levels.
TABLE OF CONTENTS
🔶 ORIGINALITY
🔸Pivot Point-Based Trading
🔸Accumulation/Distribution
🔸Dynamic Position Sizing
🔸Customizable Risk Management
🔶 FUNCTIONALITY
🔸Indicators
🞘 Pivot Points
🞘 Accumulation/Distribution
🔸Conditions
🞘 Long Entry
🞘 Short Entry
🞘 Take Profit
🞘 Stop Loss
🔶 INSTRUCTIONS
🔸Adding the Strategy to the Chart
🔸Configuring the Strategy
🔸Backtesting and Practice
🔸Market Awareness
🔸Visual Customization
🔶 CONCLUSION
▅▅▅▅▅▅▅▅▅▅▅▅▅▅▅▅▅▅▅▅▅▅▅▅▅▅▅▅▅▅▅▅▅▅▅▅▅▅▅▅▅▅▅▅▅
🔶 ORIGINALITY The Central Pivot Point Cross & Retrace Strategy uniquely combines pivot point analysis with accumulation/distribution indicators to identify optimal entry and exit points. It employs dynamic position sizing based on a fixed risk amount, ensuring consistent risk management across trades. This approach allows traders to adapt to varying market conditions by adjusting position sizes according to predefined risk parameters, enhancing both flexibility and control in trading decisions. The strategy's integration of customizable stop-loss levels further refines its risk management capabilities.
🔸Pivot Point-Based Trading This strategy utilizes daily pivot points to identify key support and resistance levels, providing a framework for trend identification and trade entry. The central pivot point serves as the intraday point of balance between buyers and sellers, with the largest amount of trading volume assumed to take place in this area.
🔸Accumulation/Distribution The strategy incorporates the Accumulation/Distribution (A/D) line, an underrated volume-based indicator, to establish the main trend. The A/D line is used in conjunction with a trend based indicator like the 200-period Exponential Moving Average (EMA) to confirm trend direction and strength.
🔸Dynamic Position Sizing Position sizes are calculated dynamically based on a fixed risk amount, allowing traders to maintain consistent risk exposure across trades.
🔸Customizable Risk Management Traders can set flexible risk-reward ratios and adjust stop-loss and take-profit levels, tailoring the strategy to their risk tolerance and market conditions. The strategy recommends taking partial profits at S1 or R1 levels and moving the stop-loss to break-even for remaining positions.
🔶 FUNCTIONALITY The Central Pivot Point Cross & Retrace Strategy leverages pivot points and accumulation/distribution indicators to identify optimal trading opportunities. This strategy is designed to capitalize on price movements around key pivot levels by dynamically adjusting position sizes based on predefined risk parameters. It allows traders to manage risk effectively while taking advantage of both long and short positions.
🔸Indicators 🞘 Pivot Points: Calculates daily pivot points (PP, R1, R2, S1, S2) to identify key support and resistance levels. The central pivot point is crucial for determining market bias and entry points.
🞘 Accumulation/Distribution: Uses the A/D line and with a trend based indicator like the 200 EMA to determine market direction and trend strength. This combination helps eliminate noise and provides more reliable trend signals. We recommend using the Adaptive MAs (Hurst, CVaR, Fractal) // AlgoFyre , but any moving average could be used.
🔸Conditions 🞘 Long Entry: Initiates a long position when the price crosses above the central pivot point (PP), retraces back to it and the A/D line is above its 200 EMA, indicating an uptrend. A limit entry order is set at the PP for entering the long trade.
🞘 Short Entry: Initiates a short position when the price crosses below the central pivot point (PP), retraces back to it and the A/D line is below its 200 EMA, indicating a downtrend. A limit entry order is set at the PP for entering the short trade.
🞘 Take Profit: 50% of the position is closed as profit when R1 for Longs and S1 for Shorts is reached. The position is fully closed when R2 for Longs and S2 for Shorts is reached.
🞘 Stop Loss: Stop loss is set via strategy settings. When the first 50% take profit for both long and shorts is taken, stop loss for both will be moved to break-even/entry.
🔶 INSTRUCTIONS
The Central Pivot Point Cross & Retrace Strategy can be set up by adding it to your TradingView chart and configuring parameters such as the accumulation/distribution source, stop-loss percentage, and risk management settings. This strategy is designed to capitalize on price movements around key pivot levels by dynamically adjusting position sizes based on predefined risk parameters. Enhance the accuracy of signals by combining this strategy with additional indicators like trend-following or momentum-based tools. Adjust settings to better manage risk and optimize entry and exit points.
🔸Adding the Strategy to the Chart Go to your TradingView chart.
Click on the "Pine Editor" button at the bottom of the chart.
Copy and paste the strategy code into the Pine Editor.
Click "Add to Chart" to apply the strategy.
Add the technical indicator "Accumulation/Distribution" to the chart.
Add the trend indicator " Adaptive MAs (Hurst, CVaR, Fractal) // AlgoFyre " or any other MA to the chart and move it to the "Accumulation/Distribution" pane.
Set the source of your trend indicator to "Accumulation/Distribution".
🔸Configuring the Strategy Open the strategy settings by clicking on the gear icon next to its name on the chart.
Accumulation/Distribution Source: Select the source for the accumulation/distribution indicator.
Accumulation/Distribution EMA Source: Select the source for the trend indicator.
Stop Loss Percentage: Set the stop loss distance from the pivot point as a percentage.
Risk Amount: Define the fixed risk amount for position sizing.
Base Order Size: Set the base order size for position calculations.
Number of Positions: Specify the maximum number of positions allowed.
Time Frame: Adjust the time frame based on the currency pair or asset being traded (e.g., 15-minute for EUR/USD, 30-minute for GBP/USD).
🔸Backtesting and Practice Backtest the strategy on historical data to understand how it performs in various market environments.
Practice using the strategy on a demo account before implementing it in live trading.
Test different time frames and asset pairs to find the most suitable combinations.
🔸Market Awareness Keep an eye on market news and events that might cause extreme price movements. The strategy reacts to price data and might not account for news-driven events that can cause large deviations.
Remember that this strategy is not recommended for stocks due to the A/D line's inability to account for gaps in its calculation.
🔸Visual Customization Visualization Settings: Customize the display of entry price, take profit, and stop loss levels.
Color Settings: Switch to the AlgoFyre theme or set custom colors for bullish, bearish, and neutral states.
Table Settings: Enable or disable the information table and adjust its position.
🔶 CONCLUSION
The Central Pivot Point Cross & Retrace Strategy provides a robust framework for capitalizing on price movements around key pivot levels by combining pivot point analysis with accumulation/distribution indicators. This strategy leverages pivot point crossovers to identify entry points and utilizes the A/D line crossover with its 200 EMA for trend confirmation, ensuring trades align with prevailing market conditions. By incorporating dynamic position sizing based on a fixed risk amount, traders can effectively manage risk and adapt to varying market conditions. The strategy's focus on trading around the central pivot point and its customizable stop-loss and take-profit levels further enhance its risk management capabilities, making it a versatile tool for both trending and ranging markets. With its strategic blend of technical indicators and risk management, the Central Pivot Point Cross & Retrace Strategy offers traders a comprehensive approach to optimizing trade execution and maximizing potential returns across various currency pairs and commodities.

Alternative Shark Harmonic Pattern [TradingFinder] ALT Shark🔵 Introduction
The Alternative Shark harmonic pattern, similar to the original Shark harmonic pattern introduced by Scott Carney, is a powerful tool in technical analysis used to identify potential reversal zones (PRZ) in financial markets.
These harmonic patterns help traders spot key turning points in market trends by relying on specific Fibonacci ratios. The Alternative Shark pattern is particularly unique due to its distinct Fibonacci retracements within the PRZ, which differentiate it from the standard Shark pattern and provide traders with more precise entry and exit signals.
By focusing on harmonic patterns and utilizing tools like the Harmonic Pattern Indicator, traders can easily identify both the Shark and Alternative Shark patterns, making it easier to find PRZs and capture potential trend reversals. This enhanced detection of potential reversal zones allows for better trade optimization and improved risk management.
Incorporating the Alternative Shark pattern into your technical analysis strategy enables you to enhance your trading performance by identifying market reversals with greater accuracy, improving the timing of your trades, and reducing risks associated with sudden market shifts.
🟣 Understanding the Types of Alternative Shark Pattern
The Alternative Shark harmonic pattern, much like the original Shark pattern, forms at the end of price trends and is divided into two types: Bullish and Bearish Alternative Shark patterns.
Bullish Alternative Shark Pattern :
This pattern typically forms at the end of a downtrend, signaling a potential reversal into an uptrend. Traders can use this pattern to identify buy entry points. The image below illustrates the core components of the Bullish Alternative Shark Pattern.
Bearish Alternative Shark Pattern :
Conversely, the Bearish Alternative Shark Pattern appears at the end of an uptrend and signals a potential reversal to a downtrend. This variation allows traders to adjust their strategies for selling. The image below outlines the characteristics of the Bearish Alternative Shark Pattern.
🟣 Differences Between Shark and Alternative Shark Patterns
Although both patterns share similar structures and serve as tools for identifying price reversals, there is one key difference between them :
AB to XA Ratio : In the Shark pattern, the AB leg retraces between 1 and 2 of the XA leg, whereas in the Alternative Shark pattern, this retracement is reduced to 0.382 to 0.618 of the XA leg. This difference in the retracement ratio leads to slightly different trade signals and can affect the timing of entry and exit points.
Other ratios and reversal signals remain consistent between the two patterns, but this difference in the AB to XA ratio provides traders with more nuanced opportunities to optimize their trades.
🔵 How to Use
🟣 Trading with the Bullish Alternative Shark Pattern
The Bullish Alternative Shark Pattern functions similarly to the traditional Bullish Shark, acting as a reversal pattern that helps traders recognize the end of a downtrend and the beginning of an uptrend.
The main distinction lies in the reduced AB retracement, which can offer more refined entry signals. Once the pattern completes, traders can look to enter buy trades and place a stop-loss below the lowest point of the pattern for effective risk management.
🟣 Trading with the Bearish Alternative Shark Pattern
The Bearish Alternative Shark Pattern operates much like the Bearish Shark pattern but with the adjusted AB to XA ratio. This difference provides traders with unique entry points for sell trades. Once the pattern is fully identified, traders can enter short positions, placing a stop-loss above the highest point of the pattern to safeguard against market fluctuations.
🔵 Setting
🟣 Logical Setting
ZigZag Pivot Period : You can adjust the period so that the harmonic patterns are adjusted according to the pivot period you want. This factor is the most important parameter in pattern recognition.
Show Valid Forma t: If this parameter is on "On" mode, only patterns will be displayed that they have exact format and no noise can be seen in them. If "Off" is, the patterns displayed that maybe are noisy and do not exactly correspond to the original pattern.
Show Formation Last Pivot Confirm : if Turned on, you can see this ability of patterns when their last pivot is formed. If this feature is off, it will see the patterns as soon as they are formed. The advantage of this option being clear is less formation of fielded patterns, and it is accompanied by the latest pattern seeing and a sharp reduction in reward to risk.
Period of Formation Last Pivot : Using this parameter you can determine that the last pivot is based on Pivot period.
🟣 Genaral Setting
Show : Enter "On" to display the template and "Off" to not display the template.
Color : Enter the desired color to draw the pattern in this parameter.
LineWidth : You can enter the number 1 or numbers higher than one to adjust the thickness of the drawing lines. This number must be an integer and increases with increasing thickness.
LabelSize : You can adjust the size of the labels by using the "size.auto", "size.tiny", "size.smal", "size.normal", "size.large" or "size.huge" entries.
🟣 Alert Setting
Alert : On / Off
Message Frequency : This string parameter defines the announcement frequency. Choices include: "All" (activates the alert every time the function is called), "Once Per Bar" (activates the alert only on the first call within the bar), and "Once Per Bar Close" (the alert is activated only by a call at the last script execution of the real-time bar upon closing). The default setting is "Once per Bar".
Show Alert Time by Time Zone : The date, hour, and minute you receive in alert messages can be based on any time zone you choose. For example, if you want New York time, you should enter "UTC-4". This input is set to the time zone "UTC" by default.
🔵 Conclusion
The Alternative Shark harmonic pattern, despite its structural similarity to the traditional Shark pattern, introduces a key difference in the AB to XA ratio, making it a valuable addition to the trader’s toolkit. This subtle variation enables traders to pinpoint reversal points with greater accuracy and fine-tune their trading strategies.
As with any technical pattern, it is crucial to use the Alternative Shark pattern in combination with other technical indicators and strong risk management practices. Incorporating this pattern into a broader trading strategy can help traders enhance their ability to detect and capitalize on market reversals more effectively.

ATR Range Pivot LinesDescription:
This Pine Script calculates and plots pivot lines based on ATR (Average True Range) value and closing price. It uses the previous trading day's ATR value to set static pivot levels for the current trading day. These pivot lines help traders identify potential support and resistance levels based on historical volatility. The script includes two main pivot lines—ATR High and ATR Low —and two midpoint lines between them for additional context. Labels are added to show the exact pivot values, with options to customize label positions.
Intended Use:
The script is designed to help traders forecast potential price ranges for the current trading day based on the previous day’s volatility. By adding and subtracting the previous day's ATR from the prior close, the script identifies key levels where price action may encounter support or resistance. It is useful for setting realistic price targets or entry/exit points. Since the ATR-based pivot lines are static for the entire day, they provide a reliable range for intraday trading strategies.
Disclosure:
This script was generated using AI. It is recommended to review and test the script thoroughly before applying it in live trading scenarios.

Divergence Indicator Multi [TradingFinder] MACD AO RSI DIV Chart🔵 Introduction
🟣 What is Divergence in Financial Markets?
Divergence in technical analysis happens when the price of a stock moves in a direction opposite to certain indicators. This is a crucial concept in financial markets as it can signal either a trend reversal or a continuation of the current correction in the trend. Understanding divergence helps traders and analysts make more informed decisions.
🟣 Positive Regular Divergence (RD+)
A positive regular divergence occurs at the end of a downtrend, where two price lows form. This divergence appears when the price chart shows a new low, but the indicator does not follow, signaling potential buying opportunities.
Positive divergence indicates increased buying pressure and reduced selling pressure, making it a useful signal for forecasting price increases.
🟣 Negative Regular Divergence (RD-)
A negative regular divergence is seen during an uptrend when two price highs form. The price chart records a new high, but the indicator does not reflect this change, suggesting that a market downturn is likely.
This type of divergence shows strong selling pressure and weaker buying activity, which can help identify selling opportunities.
Both positive and negative divergences are powerful tools for identifying potential trend reversals and key support and resistance levels. For example, when an indicator trends upward while the price moves downward, this creates divergence, warning traders to reconsider their investment strategy.
🟣 Different Types of Divergence in Trading
1. Regular Divergence :
o Positive Regular Divergence (RD+)
o Negative Regular Divergence (RD-)
2. Hidden Divergence :
o Positive Hidden Divergence (HD+)
o Negative Hidden Divergence (HD-)
3.Time Divergence.
Note : This guide focuses specifically on Regular Divergence.
🟣 What is Regular Divergence?
Regular Divergence, often referred to as convergence, occurs when price action and indicators show conflicting patterns, usually signaling the end of a trend. Detecting regular divergence helps traders anticipate potential trend reversals or the formation of reversal patterns.
🔵 How to Use
To optimize the detection of divergence, you can adjust the Fractal Period to specify the length of time for identifying divergence patterns.
Additionally, with the Divergence Detection Method, you can select oscillators like the MACD, RSI, or AO to base divergence detection on.
Divergence in MACD :
MACD divergence occurs when the price chart forms an opposite pattern compared to the MACD line, indicating a potential price reversal.
Divergence in RSI :
In a downtrend, if the price chart forms two consecutive lows with the second lower than the first, but the RSI shows two lows with the second higher, this indicates positive regular divergence, which is a buy signal.
On the other hand, during an uptrend, if the price forms two highs with the second higher than the first, but the RSI shows the second high lower, this points to negative regular divergence, indicating a sell signal.
Divergence in AO (Awesome Oscillator) :
The AO indicator calculates histograms using the difference between 5-period and 34-period simple moving averages. It compares peaks and troughs of these histograms with price movements, detecting divergence and plotting lines and arrows to signal divergence.
🔵 Table
The following table breaks down the main features of the oscillator. It covers four critical categories: Exist, Consecutive, Divergence Quality, and Change Phase Indicator.
Exist : If divergence is detected, a "+" will appear in this row.
Consecutive: Shows the number of consecutive divergences that have formed in a short period.
Divergence Quality : Evaluates the quality of the divergence based on the number of occurrences. One is labeled "Normal," two are "Good," and three or more are considered "Strong."
Change Phase Indicator : If a phase change is detected between two oscillation peaks, this is marked in the table.

Trademania - PVSRA IndicatorTrademania - PVSRA Indicator
The Trademania - PVSRA Indicator is based on a proven MT4 indicator suite that has been in use since 2013. Over time, it has been expanded with additional features and tools. Originally developed for the Forex market, it also works well for cryptocurrencies, stocks, and other assets. The goal of this indicator is to combine classic chart analysis with PVSRA analysis, allowing for a clean mixed chart analysis. Traders gain access to a wide range of important information and can use it to form their trading assumptions. The indicator is designed to make it as simple as possible: identifying price levels at the breakout of key support/resistance, for confirmations above/below an imbalance, or recognizing and validating standard structures.
Important: This indicator is designed to be used across all timeframes. It works equally well for scalping on lower timeframes and for larger timeframes, such as spot trading on the 4H or daily chart.
The following core features are available:
- PVSRA Candles
- Dynamic Zones for PVSRA Candles (Imbalance)
- Market sessions with high/low points
- Integrated EMAs (daily, weekly, higher time frames)
- Fully customizable EMAs
- Pivot points with mid/50% level
- Price ranges from yesterday and last week
- Average daily range (also available for weekly and monthly)
- Psychological levels (for Forex)
- Daily open
- High/Low Point of Control (POC) indicators for wicks and candle bodies
- WIL (Weekly Interest Level) - High/Low of the Asian session
- On-chart labels for nearly all elements
Key Features:
- PVSRA, integrated POC levels, and WIL levels distinguish this indicator.
- Integrated EMAs and the daily, weekly, high time frame EMAs can be supplemented or replaced by custom EMAs for maximum flexibility.
Special Feature:
- Lite Mode for better visibility and simplified chart analysis.
Instructions and Notes
PVSRA Candles
Display volume or tick volume on the chart.
- Candles with more than 200% average volume of the last 10 candles, where the product of candle spread and volume is greater than the last 10 candles/timeframes, are shown in green (bullish) and red (bearish).
- Blue and purple candles show the same with 150% average volume of the last 10 candles.
**Note:** To obtain valid information, the trading volume should be as large as possible. If you're viewing the chart of an exchange with low trading volume, you can use the PVSRA override to display the volume from another exchange. For example, you can view the Phemex chart but display the tick/volume of the Binance chart as PVSRA/Vector candles.
Dynamic Zones for PVSRA Candles (Imbalance)
Zones that match the color of the respective vector candle display imbalance on the chart.
- In PVSRA analysis, it is assumed that such imbalances will be revisited and corrected. It can be customized whether this should happen with candle wicks or just the candle bodies.
Market Sessions with High/Low Points (DST)
Relevant market sessions: Sydney/NZX, Tokyo, Hong Kong, EU, New York, as well as the Brinks sessions pre EU/NY, are marked with high/low points and labeled on the chart.
- In PVSRA/Mixed analysis, these represent important liquidity zones of the individual trading sessions, often serving as key support/resistance levels.
WIL (Weekly Interest Level) - High/Low of the Asian Session
The new WIL levels represent the market open/Asian session of the new trading week: Sydney open to Hong Kong close.
- This forms an important price range for the trading week and is always a key breakout zone or rejection area in mixed analysis. Additional liquidity is needed to break through these levels.
- Higher effort against the start of the week – an imbalance (above/below).
High/Low Point of Control (POC) Indicators for Wicks and Candle Bodies
Additionally, the indicator includes pivot-based POC markers at key highs/lows on the chart.
- A POC is generated from the candle footprint (1000 resolution) and displayed on the chart.
- **Note:** If the POC is in a wick, it is shown as a line; if the POC is only in the candle body, it is displayed in small text.
- In mixed analysis, POCs in volume-heavy wicks are always a key indication of price levels that will be revisited and a potential enhancer for a wick-fill upwards or downwards.
EMA/Pivot Points/Psychological Levels Classic/Average Ranges:
Daily/ADR - Weekly/AWR / High/Low values for day/week, as well as the daily open of the current trading day, form the foundation of the indicator.
- Base structures that account for imbalance must break certain price levels to confirm or invalidate a previous movement (bullish or bearish).
- 13/50/200/800 EMA retrace: Breaking these in either direction without addressing an imbalance on the opposite side requires confirmation after the break.
- Pivot-level trading operates on the same principle.
- **Note:** Pivot levels in this indicator have additional M-levels, which represent 50% markers to provide better insights into potential retraces or upward moves.
- For example: Breaking M1, retracing, and confirming at M1 with a target at M2.
To recognize a standard 3-level rise or retrace scenario in mixed analysis, as well as a potential extended chart progression, these levels are essential.
**Note:** Average ranges such as High/Low ADR are particularly important levels where interruptions are expected. Profit-taking, long/short, is common at these points, independent of standard structures. This also applies to the high/low levels of the last trading day and the weekly versions of these levels.
The daily open helps identify possible SPOT/Futures gaps (depending on the asset, such as a missing futures market over the weekend: NAS/DAX).
Important:
The Lite Mode is designed to help traders reduce the chart to essential core functions (PVSRA/EMA/WIL/Psy/Daily Open/Hi-Lo) to apply classic TA effectively and strengthen a mixed analysis or challenge certain assumptions regarding confirmation and imbalance.
**Note:** It is recommended to additionally use a MACD indicator to identify potential trends and momentum.
- For example, a positive MACD trend supporting a 50 EMA breakout with a target of the 200 EMA under positive imbalance (standard mixed pattern).
To cater to personal preferences or trading strategies, it is possible to add custom EMA values to the indicator without the need for a second or third separate indicator.
All functions are fully customizable within the indicator settings.

Support and Resistance DynamicThis indicator is designed to plot horizontal lines on significant Support and Resistance based on custom user-defined lookback periods. It helps traders identify key levels of support and resistance, improving their ability to detect potential trend reversals or breakout zones.
Key Features:
1. Custom Number of Support and Resistance Lines:
- The script allows users to independently control the number of horizontal lines for Support and Resistance, helping to focus on the most important levels.
2. Adjustable Lookback Period
- Customize the lookback periods for detecting support and resistance, giving you the flexibility to capture different swing points in various market conditions.
3. Minimum Difference Filter:
- The script includes a customizable minimum difference percentage filter to ensure only significant pivots are plotted, avoiding clutter and focusing on more meaningful levels.
4. Automatic Line Extension:
- Pivot high and low lines automatically extend to the right, clearly marking key levels until they are broken or surpassed by price action.
This tool is ideal for technical traders who rely on support and resistance zones for making trading decisions. Whether you are swing trading, day trading, or scalping, these key levels can help enhance your chart analysis.
How to Use:
- Customize the number of support and resistance lines to suit your strategy.
- Adjust the lookback settings to match your timeframe or market conditions.
- Fine-tune the minimum difference percentage to filter out noise and focus on stronger support and resistance.
This script provides a dynamic and customizable way to visualize support and resistance, helping you spot key turning points and make informed trading decisions.
Absolute ZigZagThis ZigZag Indicator is a bit unique in it's kind.
It uses my own Absolute ZigZag Lib to calculate the pivots:
Instead of using percentages or looking more than 1 bar left or right, this Zigzag library calculates pivots by just looking at the current bar highs and lows and the ones of one bar earlier. This is a very fast and accurate way of calculating pivots.
The library also features a solution for bars that have both a higher high and a higher low like seen below.
You can also use your own colors for the labels and the lines:
You can also quickly select a one-colored theme without changing all colors at once:

Pivot Data [QuantVue]The Pivot Data Indicator is designed to provide traders with valuable insights by identifying and analyzing pivot points on the price chart. It calculates both pivot highs and lows, then presents detailed statistics on the distance and time between these pivots.
a pivot point is defined as a specific point on the chart where the price either reaches a high or a low, with no bars higher or lower than it for a set number of bars on both sides (left and right). Essentially, it's a local high or low point, with the market moving in the opposite direction after the pivot forms.
For example:
A pivot high occurs when there are no bars with higher prices for a specified number of bars before and after that point.
A pivot low occurs when there are no bars with lower prices for the same number of bars on either side.
The number of bars to the left and right is adjustable via the Pivot Lookback Bars setting, allowing you to define how many bars are used to determine these pivot points.
Key features include:
Pivot Highs and Lows Identification: Automatically marks significant pivot highs and lows based on a user-defined lookback period, helping traders identify potential trend reversals or continuation points.
Prediction Labels: Provides forecasted pivot levels based on historical pivot price and time patterns, with options to show predictions for pivot highs, lows, or any pivot point.
Customizable Table Display: Displays a table summarizing important statistics, such as the average price percentage and the number of bars between pivots, along with the distance and time from the most recent pivot.
Traders can use this tool to map out potential levels of support and resistance based on historical data on pivot points.

Bat Harmonic Pattern [TradingFinder] Bat Chart Indicator🔵 Introduction
The Bat Harmonic Pattern, created by Scott Carney in the 1990s, is a sophisticated tool in technical analysis, used to identify potential reversal points in price movements by leveraging Fibonacci ratios.
This pattern is classified into two primary types: the Bullish Bat Pattern, which signals the end of a downtrend and the beginning of an uptrend, and the Bearish Bat Pattern, which indicates the conclusion of an uptrend and the onset of a downtrend.
🟣 Bullish Bat Pattern
The Bullish Bat Pattern is designed to identify when a downtrend is likely to end and a new uptrend is about to begin. The key feature of this pattern is Point D, which typically aligns near the 88.6% Fibonacci retracement of the XA leg.
This point is considered a strong buy zone. When the price reaches Point D after a significant downtrend, it often indicates a potential reversal, presenting a buying opportunity for traders anticipating the start of an upward movement.
🟣 Bearish Bat Pattern
In contrast, the Bearish Bat Pattern forms when an uptrend is nearing its conclusion. Point D, which also typically aligns near the 88.6% Fibonacci retracement of the XA leg, serves as a critical point for traders.
This point is regarded as a strong sell zone, signaling that the uptrend may be ending, and a downtrend could be imminent. Traders often open short positions when they identify this pattern, aiming to capitalize on the anticipated downward movement.
🔵 How to Use
The Bat Pattern consists of five key points: X, A, B, C, and D, and four waves: XA, AB, BC, and CD. Fibonacci ratios play a crucial role in this pattern, helping traders pinpoint precise entry and exit points. In both the Bullish and Bearish Bat Patterns, the 88.6% retracement of the XA leg is a critical level for identifying potential reversal points.
🟣 Bullish Bat Pattern
Traders typically enter buy positions after Point D forms, expecting the downtrend to end and a new uptrend to start. This point, located near the 88.6% retracement of the XA leg, serves as a reliable buy signal.
🟣 Bearish Bat Pattern
Traders usually open short positions after identifying Point D, expecting the uptrend to end and a downtrend to begin. This point, also near the 88.6% retracement of the XA leg, acts as a valid sell signal.
🟣 Trading Tips for the Bat Pattern
Accurate Fibonacci Point Identification : Accurately identify Points X, A, B, C, and D, and calculate the Fibonacci ratios between these points. Point D should ideally be near the 88.6% retracement of the XA leg.
Signal Confirmation with Other Tools : To enhance the pattern's accuracy, avoid trading solely based on the Bat Pattern.
Risk Management : Always use stop-loss orders. In a Bullish Bat Pattern, place the stop-loss below Point X, and in a Bearish Bat Pattern, above Point X. This helps limit potential losses if the pattern fails.
Wait for Price Movement Confirmation : After identifying Point D, wait for the price to move in the anticipated direction to confirm the pattern's validity before entering a trade.
Set Realistic Profit Targets : Use Fibonacci retracement levels to set realistic profit targets, such as 38.2%, 50%, and 61.8% retracement levels of the CD leg. This strategy helps maximize profits and prevents premature exits.
🔵 Setting
🟣 Logical Setting
ZigZag Pivot Period : You can adjust the period so that the harmonic patterns are adjusted according to the pivot period you want. This factor is the most important parameter in pattern recognition.
Show Valid Forma t: If this parameter is on "On" mode, only patterns will be displayed that they have exact format and no noise can be seen in them. If "Off" is, the patterns displayed that maybe are noisy and do not exactly correspond to the original pattern.
Show Formation Last Pivot Confirm : if Turned on, you can see this ability of patterns when their last pivot is formed. If this feature is off, it will see the patterns as soon as they are formed. The advantage of this option being clear is less formation of fielded patterns, and it is accompanied by the latest pattern seeing and a sharp reduction in reward to risk.
Period of Formation Last Pivot : Using this parameter you can determine that the last pivot is based on Pivot period.
🟣 Genaral Setting
Show : Enter "On" to display the template and "Off" to not display the template.
Color : Enter the desired color to draw the pattern in this parameter.
LineWidth : You can enter the number 1 or numbers higher than one to adjust the thickness of the drawing lines. This number must be an integer and increases with increasing thickness.
LabelSize : You can adjust the size of the labels by using the "size.auto", "size.tiny", "size.smal", "size.normal", "size.large" or "size.huge" entries.
🟣 Alert Setting
Alert : On / Off
Message Frequency : This string parameter defines the announcement frequency. Choices include: "All" (activates the alert every time the function is called), "Once Per Bar" (activates the alert only on the first call within the bar), and "Once Per Bar Close" (the alert is activated only by a call at the last script execution of the real-time bar upon closing). The default setting is "Once per Bar".
Show Alert Time by Time Zone : The date, hour, and minute you receive in alert messages can be based on any time zone you choose. For example, if you want New York time, you should enter "UTC-4". This input is set to the time zone "UTC" by default.
🔵 Conclusion
The Bat Harmonic Pattern is a powerful tool in technical analysis, offering traders the ability to identify critical reversal points using Fibonacci ratios. By recognizing the Bullish and Bearish Bat Patterns, traders can anticipate potential trend reversals and make informed trading decisions.
However, it is essential to combine the Bat Pattern with other technical analysis tools and confirm signals for better trading outcomes. With proper use, this pattern can help traders minimize risk and optimize their entry and exit points in the market.

Ultra High/LowThe Ultra High/Low script helps traders track key price levels by automatically marking significant highs and lows on a chart, highlighting potential reversal points for future trading decisions.
Introduction
The Ultra High/Low script identifies and marks significant highs and lows on a trading chart. These are specific points where the price reached a peak or bottomed out before reversing. The script draws lines at these levels, which can be extended, and it also labels the exact price at these points. This makes it easy for traders to see where the price has changed direction previously, helping them make more informed trading decisions.
Detailed Description
In more detail, the Ultra High/Low script is designed using Pine Script™, a programming language used for creating custom indicators and strategies on the TradingView platform. Here's how it works:
..........
Detection of Pivot Highs and Lows
The script identifies "pivot highs" and "pivot lows." These are points on the chart where the price reached a local maximum or minimum, surrounded by lower highs (for pivot highs) or higher lows (for pivot lows).
The user can customize how many bars to the left and right of the high or low the script should consider to confirm a pivot (Length argument in the settings).
The script uses Pine Script functions for pivot detection. ta.pivothigh() and ta.pivotlow() .
......
Drawing Lines and Labels
Once a pivot is identified, the script draws a dashed line from the pivot point to the current price bar. This line helps visualize where significant price reversals have occurred.
The script also adds a label next to these lines showing the exact price of the pivot point. This label also shows "PDH" (Previous Day High) or "PDL" (Previous Day Low) if the pivot is PDH or PDL. Same for "PWH" (Previous Week High) and "PWL" (Previous Week Low).
......
Purging and Extending Lines
If the price crosses a pivot line after it has been drawn, the script can either delete the old line (purged line) or keep it and add additional indicators to show that the line has been liquidated.
The script also has options to extend the lines into the right.
......
Custom Inputs
The script offers several customizable options, like the color of the lines and labels, whether to show the exact price or not, and whether to extend the lines. This allows traders to tailor the indicator to their specific needs and preferences.
..........
Overall, the Ultra High/Low script is a powerful visual aid for identifying critical price levels that may influence future price movements, making it easier for traders to make decisions based on historical price behavior.

Liquidity Founder The Liquidity Swings indicator aids traders in detecting liquidity swings within the market, providing essential insights for making well-informed trading decisions. Key features include:
How this Indicator work - this indicator search pivot point that is used to determine the levels at which price may face support or resistance. The Pivot Points indicator consists of a pivot point (PP) level and several support (S) and resistance (R) levels. if input number of bar selected 3 than it will look back 3 candle and wait for next 3 candle to make pivot high and low after it identify pivot it draw a line and extend until it no longer intersects with the high or low prices
What is different in my indicator compared to a normal pivot point and what Makes This Indicator Original :
1) Swing High and Low Logic:It avoids marking consecutive pivot highs until a new pivot low is formed, reducing market noise and highlighting significant trend reversals.
2)Volume Integration: By incorporating volume data, the indicator ensures that pivot points are validated with sufficient market activity, enhancing their reliability as support and resistance levels.
3) Multi-Time Frame Analysis:The ability to input and analyze multiple time frames allows the indicator to draw strong support and resistance levels that are relevant across different trading periods, making it versatile for various trading strategies.
🟠 Liquidity Swings indicator
✅Visualization of Liquidity Zones:Accumulation Areas: Identifying regions where liquidity is gathering.liquidity Sweeps: Pinpointing areas where liquidity is being cleared.
✅Pivot and Volume Analysis:Price Pivots: Monitoring significant pivots in price.
Volume Correlation: Linking price pivots with volume to highlight zones of potential support and resistance.
✅Market Dynamics Understanding:Enables traders to visualize and understand market dynamics more effectively.Assists in pinpointing potential support and resistance levels based on liquidity swings.
⭐Example -EurUsd 1 minutes chart developed Potential Support and Resistance Zone
⭐⭐⭐Key Features:
1) Adjustable Time Frame: Allows traders to analyze different periods by modifying the time frame setting.
2) Swing Look back Period: Sets the period for identifying potential price swings, enhancing flexibility in analysis.
🟠 Understanding Strong Support :These are identified by dense clusters of green lines, indicating high concentrations of buy orders that have not yet been executed. These areas suggest strong buying interest which can potentially halt further price declines.
⭐ Example -below chart image BtcUsd 5 minutes 2 line are still not touched by price
⭐⭐⭐Reasons for Strong Support:
✅Untouched Liquidity Lines: These green lines represent pending buy orders, indicating robust buying interest at these levels.
✅Accumulation of Orders: Many buy orders are aggregated in these zones, capable of preventing further price drops when approached.
✅ Historical Performance: These areas have previously prevented price declines, establishing them as reliable support zones.
✅ Market Confidence: Close clustering of green lines signifies widespread trader belief in favorable buying conditions, reinforcing support strength.
🟠 Understanding Strong Resistance :Highlighted by dense clusters of red lines, denoting substantial sell orders that did not executed. These zones signify significant selling interest which can impede further price increases.
⭐ Example -below chart image Btcusd 3 minutes 3 line did touched by price previously .price touched that area and retraced because of unfilled liquidity
⭐⭐⭐ Reasons for Strong Support:
✅ Untouched Liquidity Lines: These green lines represent pending buy orders, indicating robust buying interest at these levels.
✅ Accumulation of Orders: Many buy orders are aggregated in these zones, capable of preventing further price drops when approached.
✅ Historical Performance: These areas have previously prevented price declines, establishing them as reliable support zones.
✅ Market Confidence: Close clustering of green lines signifies widespread trader belief in favorable buying conditions, reinforcing support strength.
⭐⭐⭐ Usage of the Liquidity Founder Indicator ⭐⭐⭐
👍 Identifying Liquidity Zones: Pinpoints areas with dense clusters of pending buy (green) or sell (red) orders, providing initial entry points where significant buying or selling interest is concentrated.
👍 Avoiding Market Traps: Helps traders steer clear of market fluctuations or false breakouts by focusing on stable liquidity zones.
How to Use this indicator for Maximum benefit -
1) When the price approaches a cluster of resistance levels, traders should look for a candle showing rejection (e.g., a bearish reversal candle) to enter a short trade.
2)When the price approaches a cluster of support levels, traders should look for a candle showing rejection (e.g., a bullish reversal candle) to enter a long trade.
3) The identified liquidity levels offer a clear understanding of significant support and resistance areas, helping traders make more informed trading decisions.
4) Fake breakouts above resistance or below support clusters. If the price breaks above resistance and then falls back below, it can be a signal to enter a short trade vice versa if price break support cluster and back again above support cluster it can be a long trade

Pivot Point Profile [LuxAlgo]The Pivot Point Profile indicator groups and displays data accumulated from previous pivot points, providing a comprehensive method for prioritizing and displaying areas of interest directly given by swing highs and lows.
Users have access to common settings present in other profile-type indicators.
🔶 USAGE
The Pivot Point Profile is particularly helpful in identifying highly active reversal zones that have been visited multiple times by price. Because of this, we could generally expect these areas to serve as future points of interest, often acting as support or resistance when re-visited.
The profile displays data associated with both Pivot Highs and Pivot Lows. Each row consists of pivot high and pivot low counts side-by-side, forming the total width of the row.
By analyzing the row as a whole, we can gain a better understanding of WHERE to look for interactions.
By analyzing the pivot counts independently, we can gain a better understanding of WHAT to expect when returning to these areas.
For example:
If a row in the profile contains entirely Pivot Lows, this could be seen as an indication to look for buyers to hold that level for a continuation upwards. A break of this level could be interpreted as a lack of interest from previous buyers at this level, indicating a further move down.
🔹 Concentrated Areas
Each row in the profile displays the current count of high pivots and low pivots within the selected lookback. The largest count for each pivot direction is identified as a "Concentrated Area (CA)", these CAs are highlighted over the chart with a line displaying the average of all pivots within that CA. The CA Average is the average of all pivot points (in the majority direction) within the given row.
These can hold more importance as potential support/resistance areas.
Note: The CA Threshold can be manually adjusted to highlight all rows based on a user-selected value.
🔶 DETAILS
🔹 Calculation
The idea behind the Pivot Point Profile is a new analysis method for pivot points, taking the idea of a volume profile and adapting it to display pivot points instead of volume. By using this data, in theory, we should be able to better prioritize zones to anticipate reversals, as well as identify key levels to watch for buyer & seller interactions to use as confirmations in direction.
The (vertical) width of each row is the product of the script's "Row Size", this is the number of rows that the profile will consist of. With a max of 250, the profile can be decently granular. That being said, A more granular profile will have fewer overlapping pivot points. By decreasing the row size (Using fewer rows in the profile) you will increase the tolerance for grouping pivot points. Potentially leading to a more comprehensive Profile. Inversely, By reducing the tolerance for grouping, you will better visualize only similar highs and lows but may have noisier data to sift through.
The Profile is calculated based on a "Lookback" parameter, using only the lookback amount of previous high and low pivots to calculate the profile. Configuring this parameter alongside "Pivot Length", will allow for great control over the frame of reference of the profile.
Note: This indicator is capable of utilizing the full chart history of pivot points, this can be done by enabling the "Use Full Chart History" setting, this will cause the script will calculate from everything it has access to on your current chart.
🔹 Display
The Pivot Point Profile display can be customized to fit a various range of chart styles and visual needs. The specific settings to adjust these can be located in the "Profile Display" Section of the User Inputs.
Profile Width: Sets the Left to Right Width of the Profile. This is the maximum width that the profile will occupy and will scale to fit within this width.
Profile Offset: Sets the distance of the Profile's Axis from the current chart candle. This moves the entire profile left and right to enable to user to set the distance between the profile and the current candle.
Direction: Changes the display direction of the profile, allowing for "Left", "Right", or "Center" display styles.
🔶 SETTINGS
🔹 Pivot Point Parameters
Pivot Type: Choose between "Fractal Pivots" or "SMC Structure" to use as the basis for pivots.
Length: Sets the length for the pivot calculations.
🔹 Profile Calculations Parameters
Lookback: Sets the number of pivots to calculate within, in increments of high and low pairs. (Setting this to 1 = 1 Pivot High & 1 Pivot Low)
Use Full Chart History: Disregards the set lookback and instead uses all available chart data to calculate from.
Row Size: Sets the total number of rows to calculate the profile with.
🔹 Profile Display
Profile Width: Sets the max left & right width (in bars) that the profile will occupy.
Profile Offset: Sets the distance of the profile axis from the last chart bar.
Direction: Sets the display direction
🔹 Concentrated Areas
Highlight CAs: Extends the rows left from concentrated areas.
CA Threshold: Manually set the threshold for determining concentrated areas, when disabled, only the largest rows will be displayed.
CA Averages: Toggles the concentrated area averages for each pivot direction.
Note: CA Averages can be displayed independently without CA Highlights being displayed, and vice versa.

ICT KillZones + Pivot Points [TradingFinder] Support/Resistance 🟣 Introduction
Pivot Points are critical levels on a price chart where trading activity is notably high. These points are derived from the prior day's price data and serve as key reference markers for traders' decision-making processes.
Types of Pivot Points :
Floor
Woodie
Camarilla
Fibonacci
🔵 Floor Pivot Points
Widely utilized in technical analysis, floor pivot points are essential in identifying support and resistance levels. The central pivot point (PP) acts as the primary level, suggesting the trend's likely direction.
The additional resistance levels (R1, R2, R3) and support levels (S1, S2, S3) offer further insight into potential trend reversals or continuations.
🔵 Camarilla Pivot Points
Featuring eight distinct levels, Camarilla pivot points closely correspond with support and resistance, making them highly effective for setting stop-loss orders and profit targets.
🔵 Woodie Pivot Points
Similar to floor pivot points, Woodie pivot points differ by placing greater emphasis on the closing price, often resulting in different pivot levels compared to the floor method.
🔵 Fibonacci Pivot Points
Fibonacci pivot points combine the standard floor pivot points with Fibonacci retracement levels applied to the previous trading period's range. Common retracement levels used are 38.2%, 61.8%, and 100%.
🟣 Sessions
Financial markets are divided into specific time segments, known as sessions, each with unique characteristics and activity levels. These sessions are active at different times throughout the day.
The primary sessions in financial markets include :
Asian Session
European Session
New York Session
The timing of these major sessions in UTC is as follows :
Asian Session: 23:00 to 06:00
European Session: 07:00 to 14:25
New York Session: 14:30 to 22:55
🟣 Kill Zones
Kill zones are periods within a session marked by heightened trading activity. During these times, trading volume surges and price movements become more pronounced.
The timing of the major kill zones in UTC is :
Asian Kill Zone: 23:00 to 03:55
European Kill Zone: 07:00 to 09:55
New York Kill Zone: 14:30 to 16:55
Combining kill zones and pivot points in financial market analysis provides several advantages :
Enhanced Market Sentiment Analysis : Aligns key price levels with high-activity periods for a clearer market sentiment.
Improved Timing for Trade Entries and Exits : Helps better time trades based on when price movements are most likely.
Higher Probability of Successful Trades : Increases the accuracy of predicting market movements and placing profitable trades.
Strategic Stop-Loss and Profit Target Placement : Allows for precise risk management by strategically setting stop-loss and profit targets.
Versatility Across Different Time Frames : Effective in both short and long time frames, suitable for various trading strategies.
Enhanced Trend Identification and Confirmation : Confirms trends using both pivot levels and high-activity periods, ensuring stronger trend validation.
In essence, this integrated approach enhances decision-making, optimizes trading performance, and improves risk management.
🟣 How to Use
🔵 Two Approaches to Trading Pivot Points
There are two main strategies for trading pivot points: utilizing "pivot point breakouts" and "price reversals."
🔵 Pivot Point Breakout
When the price breaks through pivot lines, it signals a shift in market sentiment to the trader. In the case of an upward breakout, where the price crosses these pivot lines, a trader might enter a long position, placing their stop-loss just below the pivot point (P).
Conversely, if the price breaks downward, a short position can be initiated below the pivot point. When using the pivot point breakout strategy, the first and second support levels can serve as profit targets in an upward trend. In a downward trend, these roles are filled by the first and second resistance levels.
🔵 Price Reversal
An alternative method involves waiting for the price to reverse at the support and resistance levels. To implement this strategy, traders should take positions opposite to the prevailing trend as the price rebounds from the pivot point.
While this tool is commonly used in higher time frames, it tends to produce better results in shorter time frames, such as 1-hour, 30-minute, and 15-minute intervals.
Three Strategies for Trading the Kill Zone
There are three principal strategies for trading within the kill zone :
Kill Zone Hunt
Breakout and Pullback to Kill Zone
Trading in the Trend of the Kill Zone
🔵 Kill Zone Hunt
This strategy involves waiting until the kill zone concludes and its high and low lines are established. If the price reaches one of these lines within the same session and is strongly rejected, a trade can be executed.
🔵 Breakout and Pullback to Kill Zone
In this approach, once the kill zone ends and its high and low lines stabilize, a trade can be made if the price breaks one of these lines decisively within the same session and then pulls back to that level.
🔵 Trading in the Trend of the Kill Zone
Kill zones are characterized by high trading volumes and strong trends. Therefore, trades can be placed in the direction of the prevailing trend. For instance, if an upward trend dominates this area, a buy trade can be entered when the price reaches a demand order block.

Pivot Points Level [TradingFinder] 4 Methods + Reversal lines🔵 Introduction
"Pivot Points" are places on the price chart where buyers and sellers are most active. Pivot points are calculated based on the previous day's price data and serve as reference points for traders to make decisions.
Types of Pivot Points :
Floor
Woodie
Camarilla
Fibonacci
🟣 Floor Pivot Points
Floor pivot points are widely used in technical analysis. The central pivot point (PP) serves as the main level of support or resistance, indicating the potential direction of the trend.
The first to third levels of resistance (R1, R2, R3) and support (S1, S2, S3) provide additional signals for potential trend reversals or continuations.
Floor Pivot Points Formula :
Pivot Point (PP): (H + L + C) / 3
First Resistance (R1): (2 * P) - L
Second Resistance (R2): P + H - L
Third Resistance (R3): H + 2 * (P - L)
First Support (S1): (2 * P) - H
Second Support (S2): P - H + L
Third Support (S3): L - 2 * (H - P)
🟣 Camarilla Pivot Points
Camarilla pivot points include eight levels that closely align with support and resistance. These points are particularly useful for setting stop-loss and profit targets.
Camarilla Pivot Points Formula :
Fourth Resistance (R4): (H - L) * 1.1 / 2 + C
Third Resistance (R3): (H - L) * 1.1 / 4 + C
Second Resistance (R2): (H - L) * 1.1 / 6 + C
First Resistance (R1): (H - L) * 1.1 / 12 + C
First Support (S1): C - (H - L) * 1.1 / 12
Second Support (S2): C - (H - L) * 1.1 / 6
Third Support (S3): C - (H - L) * 1.1 / 4
Fourth Support (S4): C - (H - L) * 1.1 / 2
🟣 Woodie Pivot Points
Woodie pivot points are similar to floor pivot points but place more emphasis on the closing price. This method often results in different pivot levels than the floor method.
Woodie Pivot Points Formula :
Pivot Point (PP): (H + L + 2 * C) / 4
First Resistance (R1): (2 * P) - L
Second Resistance (R2): P + H - L
First Support (S1): (2 * P) - H
Second Support (S2): P - H + L
🟣 Fibonacci Pivot Points
Fibonacci pivot points use the standard floor pivot points and then apply Fibonacci retracement levels to the range of the previous trading period. The common retracement levels used are 38.2%, 61.8%, and 100%.
Fibonacci Pivot Points Formula :
Pivot Point (PP): (H + L + C) / 3
Third Resistance (R3): PP + ((H - L) * 1.000)
Second Resistance (R2): PP + ((H - L) * 0.618)
First Resistance (R1): PP + ((H - L) * 0.382)
First Support (S1): PP - ((H - L) * 0.382)
Second Support (S2): PP - ((H - L) * 0.618)
Third Support (S3): PP - ((H - L) * 1.000)
These pivot point calculations help traders identify potential support and resistance levels, enabling more informed decision-making in their trading strategies.
🔵 How to Use
🟣 Two Methods for Trading Pivot Points
There are two primary methods for trading pivot points: trading with "pivot point breakouts" and trading with "price reversals."
🟣 Pivot Point Breakout
A breakout through pivot lines provides a significant signal to the trader, indicating a change in market sentiment. When an upward breakout occurs and the price crosses these lines, a trader can enter a long position and place their stop-loss below the pivot point (P).
Similarly, if a downward breakout happens, a short order can be placed below the pivot point.
When trading with pivot point breakouts, if the upward trend breaks, the first and second support levels can be the trader's profit targets. In a downward trend, the first and second resistance levels will serve this role.
🟣 Price Reversal
Another method for trading pivot points is waiting for the price to reverse from the support and resistance levels. To execute this strategy, one should trade in the opposite direction of the trend as the price reverses from the pivot point.
It's worth noting that although traders use this tool in higher time frames, it yields better results in shorter time frames such as one-hour, 30-minute, and 15-minute intervals.

Fundur - Easy ZonesFundur Easy Zones Trading Indicator
The Fundur Easy Zones trading indicator is designed to simplify market analysis by visually marking critical trading zones. This tool helps traders identify optimal buy and sell areas based on historical price action, making it easier to make informed trading decisions.
Calculation Methodology
The Easy Zones indicator employs pivot point calculations combined with price action analysis and the Average True Range (ATR) to determine key trading zones. These zones are calculated by analyzing market volatility and price movements within each timeframe, allowing the identification of significant discount and premium levels.
Pivot Points: The indicator calculates pivot points based on the average of high, low, and close prices from previous periods. These pivot points serve as the foundational levels from which discount and premium zones are derived.
Price Action Analysis: Historical price data is scrutinized to identify patterns and behaviors that signify potential reversal points. This analysis helps in pinpointing zones where the market is likely to experience significant support (discount) or resistance (premium).
Average True Range (ATR): ATR is used to measure market volatility. By incorporating ATR into the calculations, the indicator adjusts the zone boundaries to reflect current market conditions, ensuring that the zones remain relevant and accurate. Higher ATR values indicate greater volatility and wider zones, while lower ATR values result in narrower zones.
Discount and Premium Levels: Based on the pivot points and ATR, the indicator calculates various tiers of discount and premium levels. These tiers (D1, D2, D3 for discounts and P1, P2, P3 for premiums) represent increasing levels of price deviation from the mean, providing traders with clear entry and exit points.
Features Overview
Zones Settings:
Zones History Length: Adjust the number of historical zones displayed on the chart to analyze past price behavior.
Levels Line Width: Customize the thickness of the zone lines for better visibility.
Structure Settings:
Show Fair Value: Display the fair value zone, providing a visual reference for equilibrium price levels. The fair value is calculated based on the median price over the selected period.
DP (Discount and Premium) Settings:
Enable Discount and Premium Levels: Activate the display of critical buy (discount) and sell (premium) zones. These zones are determined using price deviation analysis from the mean, identifying significant discount (support) and premium (resistance) levels.
Tiered Levels: Visualize up to three levels of discount and premium zones, each with specific target prices (TP1, TP2, TP3), representing different levels of price deviation significance.
Highlight Buy and Sell Zones:
Enable Background: Highlight the background of buy and sell zones for enhanced clarity.
Label Settings:
Enable All Labels: Ensure all labels are visible for quick reference.
Show Descriptive Title: Display titles for each zone, making it easier to understand the context.
Show Take Profit Targets (TP): Clearly mark take profit targets within each zone.
Show Price: Display price levels for each zone for precise entry and exit points.
Symbols Settings:
Fair Value, Premium, and Discount Indicators: Customize symbols to represent gaining or losing fair value, premium, and discount levels, enhancing visual cues for market sentiment.
How to Use the Easy Zones Indicator
Identifying Entry Points:
Use the Discount Zones to identify optimal buy areas. The levels (D1, D2, D3) represent increasing levels of discount, with D1 being the least discounted and D3 the most.
Place buy orders at or near these zones to take advantage of potential price reversals.
Identifying Exit Points:
Use the Premium Zones to identify optimal sell areas. The levels (P1, P2, P3) represent increasing levels of premium, with P1 being the least and P3 the highest.
Place sell orders at or near these zones to maximize profits on upward price movements.
Using Fair Value:
The Fair Value Zone provides a balanced price level where the market is likely to return. Use this as a reference point for setting realistic entry and exit targets.
Strategic Planning:
Combine Discount and Premium Zones with the Fair Value Zone to create a strategic trading plan.
Monitor the zones for price reactions and adjust your trading strategy accordingly.
Best Practices
Historical Analysis:
Regularly review historical price actions within the marked zones to understand market behavior.
Customization:
Adjust the settings to suit your trading style and market conditions. Experiment with different zone lengths and line widths for optimal clarity.
Risk Management:
Always use stop-loss orders in conjunction with the identified zones to manage risk effectively.
By integrating the Fundur Easy Zones indicator into your trading strategy, you can enhance your market analysis, make more informed decisions, and ultimately improve your trading performance.

CPR By Ask Dinesh Kumar(ADK)Simple CPR Indicator to increase probability of profitable trades:
The Central Pivot Range (CPR) is a trading tool used by traders to identify potential support and resistance levels in the market. Here's a simplified explanation of how traders can potentially profit using the Central Pivot Range with 10 lines:
1. *Understanding CPR*: CPR consists of three lines: the pivot point (PP), upper resistance level (R1), and lower support level (S1). Additionally, traders often add five more of profitable tradeslines above and below the PP to create a 10-line CPR.
2. *Identify Trend*: Determine the prevailing market trend. If the market is bullish, traders will look for buying opportunities near support levels. If the market is bearish, they'll seek selling opportunities near resistance levels.
3. *Entry Points*: Look for entry points near the support (S1) or resistance (R1) levels within the CPR. These levels can act as potential turning points where price may reverse.
4. *Risk Management*: Set stop-loss orders to manage risk. Stop-loss orders should be placed slightly below support levels for long positions and slightly above resistance levels for short positions.
5. *Profit Targets*: Determine profit targets based on the distance between entry point and the next support or resistance level. Some traders use a risk-reward ratio to ensure potential profits outweigh potential losses.
6. *Confirmation*: Use additional technical indicators or price action patterns to confirm potential entry or exit points within the CPR.
7. *Monitor Price Action*: Continuously monitor price action around the CPR levels. Traders should be prepared to adjust their positions if price breaks through support or resistance levels convincingly.
8. *Trade Management*: Once in a trade, actively manage it by adjusting stop-loss orders, trailing stops, or taking partial profits as price moves in the desired direction.
9. *Market Conditions*: Consider broader market conditions, such as economic indicators, geopolitical events, or news releases, which can impact price movements and the effectiveness of CPR.
10. *Practice and Analysis*: Practice using CPR on historical price charts and analyze past trades to refine strategies and improve decision-making skills.
Remember, trading involves risks, and no strategy guarantees profits. It's essential to thoroughly understand the concepts behind CPR and practice disciplined risk management to increase the likelihood of successful trades.
How does central pivot range work:
Sure here's a concise explanation of how the Central Pivot Range (CPR) works in 10 points:
1. *Calculation*: CPR is calculated using the previous day's high (H), low (L), and close (C) prices.
2. *Pivot Point (PP)*: The central point of CPR is the average of the previous day's high, low, and close prices: PP = (H + L + C) / 3.
3. *Upper Resistance Levels (R1, R2, R3)*: These are potential price levels above the pivot point where resistance may occur. They are calculated by adding a multiple of the range (H - L) to the pivot point: R1 = (2 * PP) - L, R2 = PP + (H - L), R3 = PP + 2 * (H - L).
4. *Lower Support Levels (S1, S2, S3)*: These are potential price levels below the pivot point where support may occur. They are calculated similarly to resistance levels but subtracting multiples of the range from the pivot point: S1 = (2 * PP) - H, S2 = PP - (H - L), S3 = PP - 2 * (H - L).
5. *Trading Signals*: Traders use CPR to identify potential support and resistance levels where price may reverse or stall.
6. *Range Bound Markets*: In range-bound markets, traders may buy near support levels (S1, S2, S3) and sell near resistance levels (R1, R2, R3).
7. *Breakout Trading*: When price breaks through a CPR level convincingly, it may indicate a potential trend continuation or reversal, providing breakout trading opportunities.
8. *Volume and Momentum*: Traders often look for confirmation from volume and momentum indicators when price approaches CPR levels.
9. *Intraday Trading*: CPR can be applied to intraday timeframes as well, providing shorter-term traders with potential trading levels for the day.
10. *Dynamic Indicator*: CPR is dynamic and recalculates daily based on new price data, allowing traders to adapt their strategies to current market conditions.
Understanding how to interpret CPR levels and integrate them into a trading strategy can help traders identify potential entry and exit points in the market.
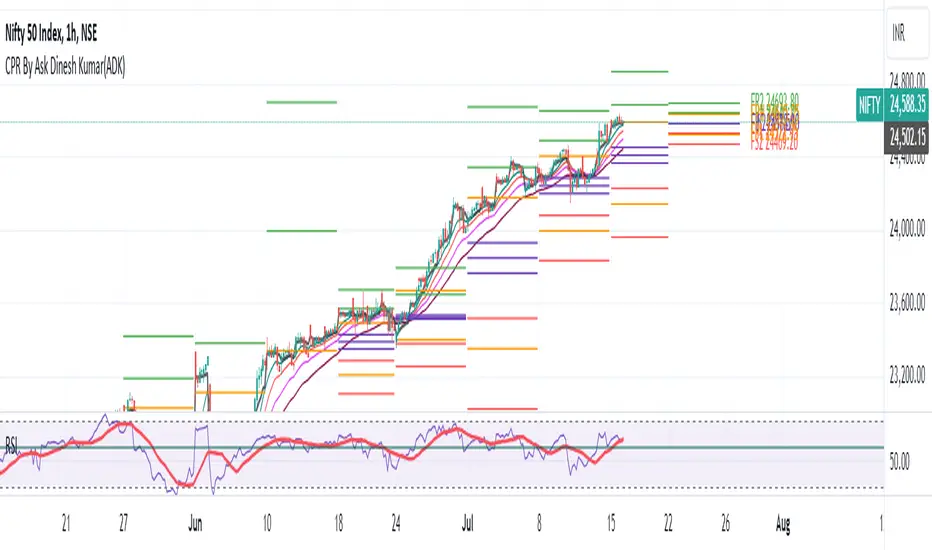
Support and Resistance [CryptoSea]The Support and Resistance Indicator is a powerful tool developed by CryptoSea for traders seeking to identify key market levels with precision. This script leverages advanced pivot and volume analysis to highlight support and resistance zones on the price chart.
Key Features
Multi-Source Pivot Analysis: Choose between wicks or body prices for calculating pivot points, providing flexibility in market analysis.
Volume Spike Detection: Automatically identifies volume spikes using a customizable threshold multiplier, enhancing the accuracy of support and resistance levels.
Dynamic Box Display: Configurable options for extending and graying out boxes based on price interaction, ensuring a clear visual representation of active and invalidated zones.
In the example below, we see a resistance box formed based on wick highs and a volume spike. The box extends to where we see price rejecting from it. In the settings you can change this so the box will stop if price touches it if you prefer.
How it Works
Pivot Point Calculation: The script determines pivot highs and lows using either wicks or body prices over a specified term (Short, Medium, Long), corresponding to 5, 15, or 30 bars.
Volume Analysis: Calculates average volume over twice the pivot length and identifies volume spikes exceeding the user-defined threshold, crucial for confirming support and resistance levels.
Box Management: Maintains arrays of support and resistance boxes, limiting the number based on user settings (All, Recent Few, Recent Several).
Settings Explained
Source: Choose between 'Wicks' or 'Bodies' to determine whether pivot points are calculated using candle wicks or body prices.
Pivot Term: Select 'Short' (5 bars), 'Medium' (15 bars), or 'Long' (30 bars) to adjust the distance for pivot calculation. Longer terms take more bars to confirm support/resistance.
Volume Threshold (multiplier): Set a multiplier of average volume to detect volume spikes, essential for validating support/resistance levels.
Extend Until Price Hits: Enable this to extend support/resistance boxes until the price touches them, providing dynamic levels.
Gray Out Boxes Once Hit: Enable this to gray out the boxes once the price interacts with them, indicating that they are no longer active.
Max Boxes Displayed: Choose 'All', 'Recent Few' (up to 3 boxes each for bull and bear), or 'Recent Several' (up to 10 boxes each for bull and bear) to control the number of visible boxes.
Invalidate Condition: Select 'Touch' to invalidate a box when the price touches it or 'Through' to invalidate when the price passes entirely through the box.
Candle Colors: Option to color candles based on neutral, bullish, or bearish conditions for easier visual analysis.
Application
Strategic Planning: Assists traders in pinpointing potential entry and exit points by marking significant support and resistance zones.
Trend Confirmation: Validates trend strength and potential reversals with volume-based analysis of support and resistance levels.
Customizable Settings: Tailors analysis to various trading strategies with extensive input settings for pivot source, term, volume threshold, and display preferences.
The Support and Resistance Indicator by is an essential addition to any trader’s toolkit, offering robust and customizable market level analysis for improved trading decisions.
