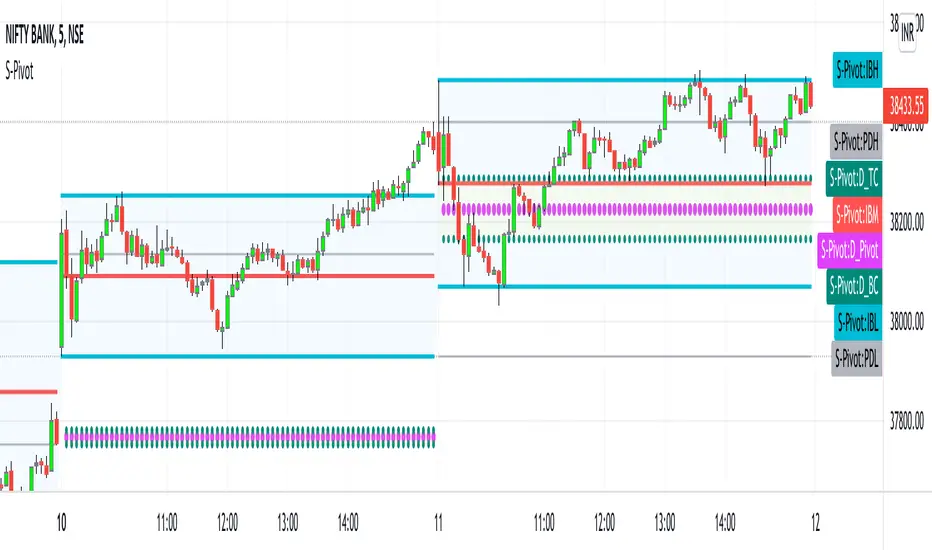
CPR_Previous Day Ranges_Initial BalanceHello Traders,
This script best works on Indian Index (Tested on BANKNIFTY & NIFTY)
This indicator can be used only for day trading (intraday: ex: 5min, 15min Timeframes) on indices.
This script helps to plot
1. Central Pivot Range(CPR)
2. Previous Day Ranges (PDH & PDL)
3. Initial Balance(IB)
brief description of indicators:
1. CPR: Central Pivot Range --> This indicator helps to identify key price points to set up trades. CPR is beneficial for intraday trading.
2.Previous Day Ranges: These ranges will help to understand the current day market.
PDH: Previous Day High value on current day
PDL: Previous Day Low value on current day
3.Initial Balance(IB):This indicator will help in day trading. IB will plot current day first 1hr high, low & mid values.
Disclaimer: This indicator can be used as refrence only. This has been tested on Banknifty and Nifty indices on day trading 5 minutes and 15 minutes timeframe. Understand yourself to knowledge of different trading methods.
Punti Pivot
Simple Daily Weekly Monthly YearlySimple price line of the previous daily, weekly, monthly, and yearly opens and closes.
By default your will get the open and close of the last period of the time frame. If you're in March, you will get the open and close of Febraury. If it is calendary day 20, you will get the open and close of day 19 (or previous market day).
Script can be modified to see the most recent opens and closes by switching the period on a desired time range to 0. This will make so that if you're in March, you will get the open of March and it's most recent close price even if the month isn't over.
Colors can be changed to your liking via the settings for the indicator.
To show the price labels on your y-axis, go to Main Chart Settings -> Scales -> "Last Value Indicator Label" and click the checkbox. Also, might be helpful to check the "Indicator Name Label" under the same settings.
The line plots need to be completely transparent, otherwise they will show up and crowd the price chart.

ATR Volume DivergenceThe indicator measures ATR relative to VOLUME of each candle, marks the candles where there is more volume than in the previous one, but a lower ATR - signifying a compression in price movement - resistance. It also marks the candle where there is a greater ATR than in the previous candle, but lower volume - signifying an expansion in price movement - vacuum.
P.S. Bring indicator to FRONT to see the colored candles clearly

Trends & Pivots [SignalCave]Trends & Pivots Indicator helps you to identify primary and secondary trends and potential support/resistance zones.
Trend detection have three modes which are “Aggressive, Moderate and Conservative” . You can customize the mode on settings screen.
Alerts are available for various conditions such as "Uptrend Shift, Downtrend Shift, Primary Uptrend Begin, Primary Downtrend Begin, Secondary Uptrend Begin, Secondary Downtrend Begin"
Type asset name on symbol search area.
Adjust your timeframe that you wish to track.
Click "Create Alert"
Select one of the condition that you wish to get inform from create alert panel.
Select "Once Per Bar Close" option.
Click "Create" .

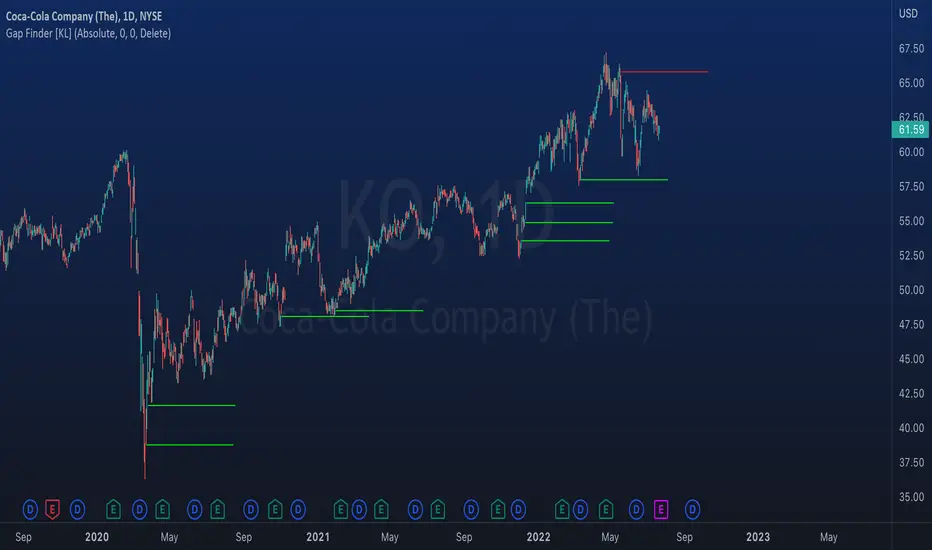
Indicator: Gap Finder [KL]
About gaps:
A gap is a “jump” in a security’s price between the Open and the Prior Close . Gaps are very common in stocks during opening hours, especially when accompanied by catalysts.
What this indicator does:
This script will identify gaps that remained unfilled for at least one candle.
It is very common for gaps to be filled on the first candle, these gaps are arguably less meaningful, so they are ignored by the indicator to reduce the number of lines drawn.
Applications:
Since most gaps eventually get filled, the question is a matter of when . If going with the trend, a trader will open a long/short position when seeing an up/down gap. When going against the trend, then short/long the stock on up/down gaps and consider taking profits when price returns to where the gap originally occurred.
Originally intended for 1D timeframes, but gaps can occur in all timeframes. Applications are limitless.
SmartProfit - Trend Indicator (Main Version) - RUSmartProfit - Trend Indicator (Main Version) detects trend direction and gives trading signals for Short and Long positions.
You can use "SmartProdit - Trend Indicator" for any timeframe, from daily, 4h, to fewer ones, even minute timeframe.
We recommend using those timeframes:
4h. and 3h. - for swing trading
15min. и 30min. - for scalping
"SmartProfit - Trend Indicator" features:
1. Sell and Buy signals ( For setup, we have three parameters: HB, sensitivity, and stop )
2. TakeProfit values for Long and Short signals ( Prices for profit fixing )
3. Profit table ( Show profit of current indicator settings for chosen time range )
4. Current position table ( Show data for the current position in real-time. At this table you have all that you need to enter the position )
5. Trend lines ( Draw Global and local trend lines. )
6. Fibonacci levels ( Automatically draw global and local Fibonacci levels )
7. Fibonacci channel ( Automatically draw global and local Fibonacci channels )
8. Auto setting - sorts out more than 6000 variants of settings at one loop and gives the best one.
For best results, you should set up an indicator for each trading pair. For setup, we have three parameters: HB, sensitivity, and stop. We have an additional feature for auto setting, which sorts out more than 6000 variants of settings at one loop and give the best one.
For work with indicators we made 3 strategies:
First - we enter the position after the signal is approved. Close and reenter to position with approved signal for another side.
Second and third - the same, we enter the position after the signal is approved, but we use TakeProfit and StopLoss values to fix the position.
"SmartProdit - Trend Indicator" определяет направления тренда и дает торговые сигналы для входа в Короткую или Длинную позицию.
Индикатор позволяет торговать на любых Таймфреймах , как на дневных, так и на более мелких временных интервалах, вплоть до минутных.
Мы рекомендуем использовать Таймфреймы:
4ч. или 3ч. - для Свинг-торговли
15мин. и 30мин. - для Скальпинга
Подробнее о функционале индикатора SmartProfit:
1. Сигналы Покупки или Продажи ( Для настройки используется уникальные параметры HB и Чувствительность )
2. Значения TakeProfit для Long и Short сигналов ( Зоны фиксации прибыли )
3. Таблица прибыльности ( Отображает прибыльность текущей настройки на выбранном интервале времени )
4. Таблица Текущей позиции ( Показывает текущую позицию в режиме реального времени - в ней есть всё, что нужно для входа в позицию )
5. Трендовые линии ( Рисует как Глобальные, так и локальные трендовые линии, в зависимости от настроек )
6. Уровни Фибоначчи ( Автоматически строит уровни Фибоначчи, как Глобальные так и Локальные )
7. Каналы по Фибоначчи ( Автоматически строит каналы по Фибоначчи, как Глобальные так и Локальные )
8. Автоподсчет всех настроек индикатора - автоматически делает подбор более 6000 вариаций настроек за раз и выдаёт лучшие под каждый актив. Вам не надо тратить недели и месяцы чтобы вручную подбирать настройки, наш инструмент подберет лучшие настройки для Вас.
Для более лучших результатов, для каждого актива индикатор настраивается отдельно !
Для настройки индикатора используются три Уникальных параметра:
HB, Чувствительность, Стоп.
Для работы с индикатором разработаны три стратегии:
Первая - мы входим в позицию при закреплении сигнала и переворачиваемся (то есть выходим из позиции и заходим в противоположную сторону) по обратному сигналу.
По 2-ой и 3-ей стратегии мы также входим после закрепления сигнала, но для фиксации прибыли используем зоны TakeProfit, указанные индикатором.
Подробнее о всех возможностях стратегий, а также настройке и работе с индикатором, вы узнаете из нашей инструкции, которую выдаем персонально.
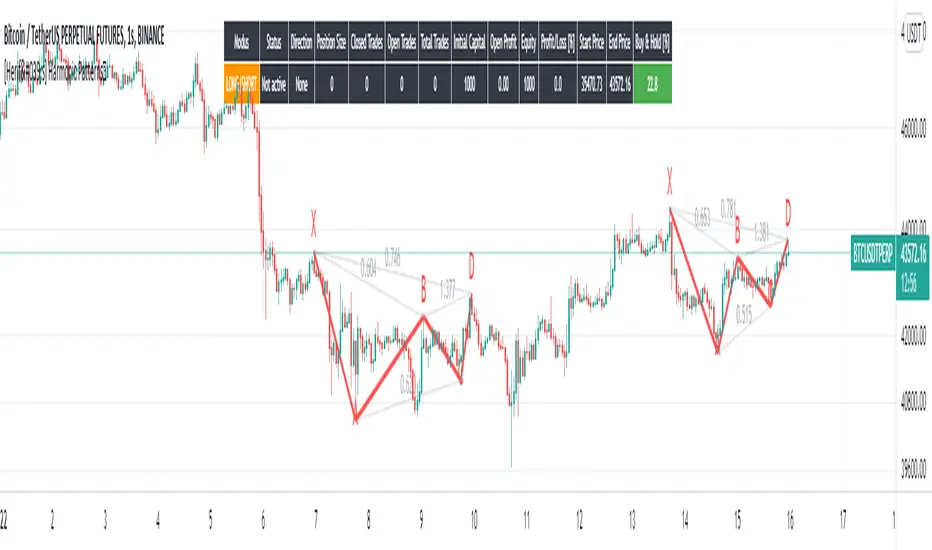
[Herif's] Harmonic PatternsFollowing things are displayed by default on the chart with harmonic patterns strategy. It can be use with automate trading platforms 3commas, zignally, frostybot, alertatron, wunderbit etc...
Bullish and bearish 5-point patterns are based on various Fibonacci retracement levels and signify potential reversal zones (PRZ).
As they become 80% complete, the dashed-line pattern will appear, displaying the PRZ and giving you time to prepare for a reversal.
Different combinations of specific fib retracements and extensions result in different patterns, and each is named for identification.
Bullish patterns signify a potential turn to the upside are colored green.
Bearish patterns signify a potential turn to the downside are colored red.
1- Live harmonic patterns which are still in trade with XABCD and ratio with labels.
2- Position Entry, Stop and Target levels on chart for all patterns.
3- Trades Stat table - Waves stat tables
in Settings:
Error Percent - This is error tollerance for matching pattern ratios. Cannot expect price ratios to be exactly as per books. Hence, adding few error tolerance will help identify patterns better.
When there are multiple patterns on chart, Entry, Stop, and Target labels and lines are created with specific distance from each other to provide clarity to the users.
Trailing and Targets
1-Trailing Start Stage - Defines when to start trailing stop-loss. It is recommended to set this value to either Target 1 or Target 2. Disabling the trailing or setting too far away may lead to being in trade on ranging market for too long. This may also result in drawing errors related to distance from current bar.
2- Custom Target Levels - Target and stop levels are set to optimal values based on individual patterns. If you want to override these levels, use the available input option to override targets and chose your custom Target1, Target2, Target3 and Target4
All Patterns you can enable or disable
Classic Patterns : Gartley, Bat, Butterfly, Crab, Deep Crab, Cypher, Shark, Nenstar
Anti Patterns: Anti Nenstar, Anti Shark, Anti Cypher, Anti Crab, Anti Butterfly, Anti Bat, Anti Gartley, Navarro 200
I will plan some updates and i will post some screen shots for settings as soon as possible.
Pivot Point BreakoutThis is a strategy taken from Perry Kaufman's book, Trading Systems and Methods.
Just like the title says, it's a breakout strategy. It works by buying when the current high is higher than the last pivot high, and selling when the low is lower than the last pivot low.
It does not have a good success probability, and relies on the good reward to risk ratio. Definitely not recommended for someone with weak hands.

ZigZag WavesHello All,
I am here with a new idea and script, " Zigzag Waves ". This indicator creates 3 Zigzags with different lengths, keeps the lengths of each zigzag wave and calculates/draws average waves for each zigzag. optionally it can reset the wave when zigzag direction changes and new highest/lowest found. And optionally it draws Exponential Moving Average(EMA) of the sum of waves. This idea is very new and at the moment there is no optimization for the Zigzag Periods. Maybe we altogether can improve the idea and find the best zigzag periods for different symbols and time frames.
Using the options You can play with the periods, add/remove EMA, set its color and reset the waves on new Highest/Lowest. As far as I see resetting the waves on new Highest/Lowest may bring better results.
if we enable "Reset the waves on new Highest/Lowest":
Using different periods and EMA length:
P.S. if you have ideas to improve this script, drop a comment under the script please.
Enjoy!

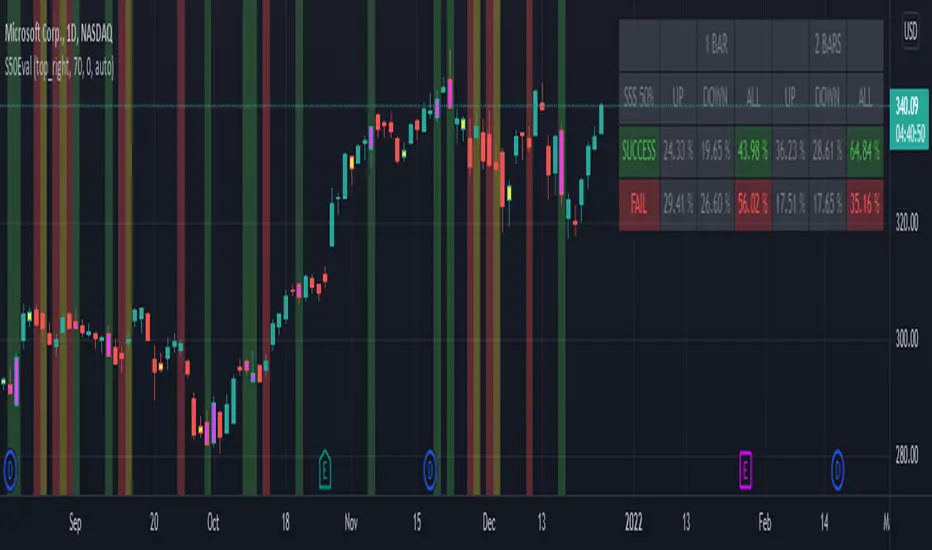
[BM] SSS 50% Rule EvaluatorSara Strat Sniper 50% Rule Evaluator
█ OVERVIEW
This indicator is based on Sara Strat Sniper's - 50% Rule for trading Outside Bars and helps you to evaluate the historical success rate of that rule.
█ FEATURES
Calculation
• You can choose to evaluate only the current bar to see if it forms an outside bar (success) or not (fail), but you can also choose to include the next bar to see if that one forms a compound outside bar.
• You can enable a start and/or end date to limit the calculation period.
Table
• Show or hide the table with the calculation results.
• Show or hide the calculation details (up/down data).
• Position of the table, opacity, cell width and text size can be customized.
Colors
• Table colors can be customized.
• You can choose to show the inside/outside bars in customizable bar colors.
• You can choose to identify successful/failed/recovered outside bars in customizable background colors.
█ LIMITATIONS
• This script uses a special characteristic of the `security()` function allowing the inspection of intrabars — which is not officially supported by TradingView.
• Intrabar inspection only works on some chart timeframes: 5, 10, 15, 30, 45 and 195 minutes, 1, 2, 3, 4, 5, 6, 7 and 8 hours, 1, 2, 3, 4 and 5 days, 1, 2, 3 and 4 weeks, 1, 2, 3, 4, 5, 6, 7, 8, 9, 10, 11 and 12 months. The script’s code can be modified to run on other resolutions.
• There is a limit to how far back intrabar calculations can be performed, and is dependant on both the intrabar resolution and your subscription (which determines the number of available bars).
[AXSUSDT] Multi signal Autotrade Binance* Commission: 0.06 and Autotrades Binance setting:
* Risk: 1%/trades and Stoploss moving formular:
1. H4 timeframe: Supertrend indicator
...Uptrend when closes candles is above the green line.
...Downtrend when closes candles is below the red line.
2. Pivot H/L:
- UPTREND:
... HH (Higher High) - HL (Higher Low)
... HH (Đỉnh sau cao hơn) - LH (Đáy sau cao hơn)
- DOWNTREND:
... LL (Lower Low) - LH (Lower High)
... LL (Đáy sau thấp hơn) - LH (Đỉnh sau thấp hơn)
3. Keltner Channels for detemined a trend & open trades: No repainting by checking previous closes candles.
* KELTNER BASIS = EMA(50)
- Zone for UPTREND: closes candle crossover Keltner Channels Upper 1, 2, 3
- Zone for DOWNTREND: closes candle crossunder Keltner Channels Lower 1, 2, 3
- Zone for opentrades: Keltner Channels Lower 1, Basis, Upper 1.
a. Open trades at Basis:
b. Open trades at Upper 1/Lower 1:
c. Open trades at SELL Upper 1/ BUY Lower 1:

Gann FanHello All,
For long time I have been getting many requests about Gann Fan indicator. now we have linefill() function in Pine Language and I think it's right time to make Gann Fan Indicator. Many Thanks to Pine Team for adding many new features to the Pine Language!
How this indicator works:
- It calculates midline (1/1)
- By using midline it calculates other lines (1/2, 1/3, 1/4...etc)
- It calculates highest/lowest Pivot Points in last 280 bars.( by default it's 280 bars, you can change it and pivot period )
- It checks the location of highest/lowest Pivot Points
- After the calculation of the Gann Fan lines, it draws lines, puts Labels and paints the zones between the lines according to the colors set by the user
Long time ago I created a special algorithm for calculating the line with 45 degree and I used it for "1/1" line. Anybody who needs it can use this algorithm freely ;)
Options:
You can change following items;
- The colors
- Transparency. Possible values for transparency are from 0 (not transparent) to 100 (invisible)
- Line styles
- Loopback Period (by default it's 280)
- Pivot Period (by default it's 5)
- Enable/disable Labels
- Label location (by default it's 50
Tradingview Gann Fan page : The Gann Fan is a technical analysis tool created by WD Gann. The tool is comprised of 9 diagonal lines (extending indefinitely) designed to show different support and resistance levels on a chart. These angles -drawn from main tops and bottoms- divide time and price into proportionate parts and are often used to predict areas of support and resistance, key tops and bottoms and future price moves. Please note that the chart needs to be scaled properly to ensure the market has a square relationship....
Enjoy!

SMART4TRADER - BREAKOUTThis indicator shows the breakthrough of extremes for the selected period. The default period is set = 3
The indicator checks on the current bar whether the maximum or minimum prices for the selected period are broken
----------------
Данный индикатор показывает прорыв экстремумов за выбранный период. По-умолчанию выставлен период = 3
Индикатор проверяет на текущем баре пробиты ли максимальные или минимальные значения цен за выбранный период

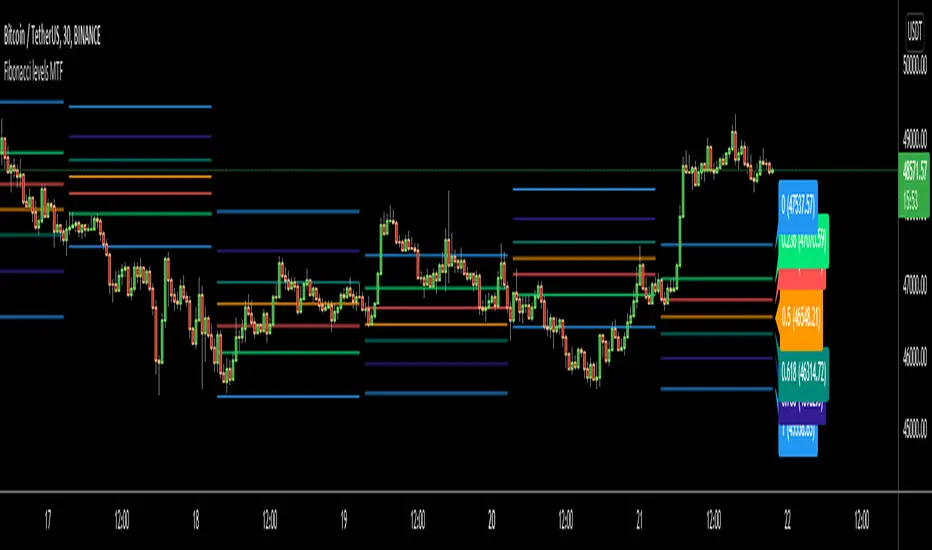
Fibonacci levels MTFHello All,
I got some requests for a script that shows Fibonacci Levels of Higher Time Frame Candles. so I made/published this script. I hope it would be useful for you.
Options:
You can set Higher Time Frame, by default it's 1 Day.
Optionally it can use Current or Last Candle of higher time frame to calculate/show its Fibonacci Levels.
It can show higher time frame candles at the background optionally. You can change its colors.
You can enable/disable/change each Fibonacci levels and their colors.
You can enable/disable Fibonacci Labels that is shown at the right ride and see only Fibonacci lines/levels
example, Fibonacci levels with higher time frame candles:
P.S. if you have ideas to improve this script, drop a comment under the script please
Enjoy!
ZigZag OrderBlock Retracement█ INTRODUCTION
What is an OrderBlock? It is simply Price where Banks (or Large Financial Entities) have Bought or Sold heavily (Support or Resistance Institutional Zone).
Our job as a trader is to monitor what the Banks and/or Large Investors are doing then patiently wait and have the opportunity to surf in their direction.
Large Financial Entities Buy during Price drops to get the best purchase Price. The Bank are acting a bit like us in our everyday life,
When we want Buying something, we always try to Buy it at the best price. And when we Sell, take the example of a used Car, we will systematically
try to Sell it at the highest possible Price. The Price of convertible Cars goes down during the Winter and goes up during the Summer.
So to make the best operation, if you Buy a second-hand convertible you will prefer to Buy it during the Winter and Sell it immediately in the Summer
and not Vice versa. So the way Large Institution act is exactly the same, it will expect the Price to Buy the fall and they will wait until
the Price rises in order to Sell. This is how the Profits will be made. The mistake that many Traders makes when they Trade emotionally is to act
in the opposite way of what they will do in everyday life. When we trade emotionally, we see the Price fall, instead of Buying while the Price drops we Sell.
In a similar emotional based act when the Price goes up we Buy, while when the Price goes up it's the best opportunity to Sell. So all the big moves
that you can watch on your different Instruments are the result of Banks or other Large Financial Entities. As Individuals, we do not have the necessary
“Strike Force” to create this type of movement. However, it is important to note that when Banks or Large Entities create this type of movement,
they do so despite theirs willing, they would love to be able to hide but luckily for us they can’t. When Billions of Dollars are Invested in Trades,
the effect can’t be concealed and as a result we will observe the impact on the market then as an Individual we’ll be able to see that on our Charts.
There are many ways to locate these areas of interest. But as they say, all roads lead to Rome. The purpose remains the Price Study
and in particular the movements of strong amplitude on the Chart. Large Financial Entities will keep acting in the same Price areas, Or at least we can say
that there's a high probability for them to intervene in these zones. Therefore, rather than chasing the Price moves and then to endure a counter move,
we will patiently wait until the Price returns to these areas on the basis that Banks and, or Large Entities will accumulate on their Positions
and are going to Sell and Buy in the same Price areas. Keep in mind that this logic works no matter what TimeFrame is used. However when the have Analysis
on Small TimeFrame (between M15 and H1) will make the movements observed between 20 and 50 Pips. Whereas if we look at H4 or Daily,
we can really see movements of 100 or even 200 Pips.
█ OVERVIEW
The ZigZag Indicator is used to illustrate Trend Lines without taking into account intermediate Retracements.
In a way, it allows you to get to the point by giving a simplified view of the evolution of Prices by eliminating "parasitic" movements, and thus to Position
and unwind Positions at the appropriate times. It is part of the category of Trend Indicators. We will simply define a Level of Price variation below which
they will not be taken into account by the indicator. This will eliminate all minor fluctuations, depending on the desired sensitivity.
The Indicator can only have 2 directions, Up or Down. For example, setting the Indicator to 5% (ZigZag Length ) will eliminate all variations below 5%.
If the Trend is Bullish and the Indicator therefore oriented in the same direction, Prices will have to fall by at least 5% for the direction
of the ZigZag to reverse Downward. Why using ZigZag to search for our OrderBlock? ZigZag makes it possible to clearly identify the current Trend as well
as significant Reversals and therefore have a much clearer vision of the actions carried out by Banks / Large Entities. However, it is drawn up
a posteriori and therefore does not make it possible to predict the evolution of Prices. The turning points are Indicated with a delay proportional
to the chosen sensitivity. The indicator calculates the Lowest Price over the given Period and eliminates Prices that are below the minimum requested
Array Size. Then, it calculates the Highest Price over the given Period and eliminates the Prices that are below the minimum requested Array Size.
Finally, it draws the Trend Line that connects the High and Low points determined previously and use the sum of the two to determinate the Range area.
█ HOW TO INTERPRET?
• The Indicator creates Lines that demonstrate past Retracements and current Pivots Levels to get a clearer view of the next Retracement area
using the Lines from the Last High and Low Pivots to determine which Take-Profit or Stop-Loss set.
• The "OrderBlocks" are detected based on the Pivots founds. You can display the Prices and use theses to help you set your Take-Profit during Retracement.
• Possibility to display the Levels of detected Pivots point. This can permit to dispense with the use of Elliot Waves or the use of a Fibonacci.
• Donchian ZigZag Channels to be sure to always have seen the extremities of the Top, Bottom and Range area.
• The ZigZag Length is set to 5 by default. You will have to adjust it according to selected TimeFrame or Financial Instrument used.
• The ZigZag has 3 adjustable colors:
-Green = Bullish Trend
-Red = Bearish Trend
-Orange = Range Zone
It is not advisable to enter Position when the ZigZag color indicates a Range Zone.
- OrderBlocks
- ZigZag + Pivots Point
- Donchian ZigZag Channel
█ ALERTS
Following the request of many users on our other script concerning the late arrival of Alerts for detected OrderBlocks (on Institutional OrderBlock Pressure), we fixed this problem here with the arrival INSTAN and CONFIRM ALERTS .
█ NOTES
- This script is not beginner's Level and is intended for Traders with advanced knowledge of ZigZag and the work of Michael j. Huddleston on the OrderBlocks.
Good Trade everyone and remember, risk management remains the most important!

[Crypto] Dow theory strategy - Commission: 0.06 = Binance future fee.
- Autotrade by webhook to Binance future options:
1. Trend Identification:
a. UPTRENDTREND:
- HH_Trend: Higher High trend.
- HL_Trend: Higher Low trend.
b. DOWNTREND:
- LL_Trend: Lower Low trend.
- LH_Trend: Lower Low trend.
2. Open trades conditions:
a. LONG OPEN CONDITION: Điều kiện MUA.
- HH_E: Higher High entries.
- HL_E: Higher Low entries.
b. SHORT OPEN CONDITION: Điều kiện BÁN.
- LL_E: Lower Low entries.
- LH_E: Lower Low entries.
3. Stop loss and Take profit:
Stoploss, Profit = Entry Price +- ATR(20) * 5
4. Summary every year:
- 2021 to 15 Dec, 2021
- 2020 to 2021:
- 2019 to 2020:
- 2018 to 2019:
- 2017 to 2018:
- 2016 to 2017:
- 2015 to 2016:
- 2014 to 2015:
- 2013 to 2014:
5. Summary long-range:
- 2019 to 15 Dec, 2021:
- 2016 to 2019:
- 2013 to 2016:
6. List of other pairs:

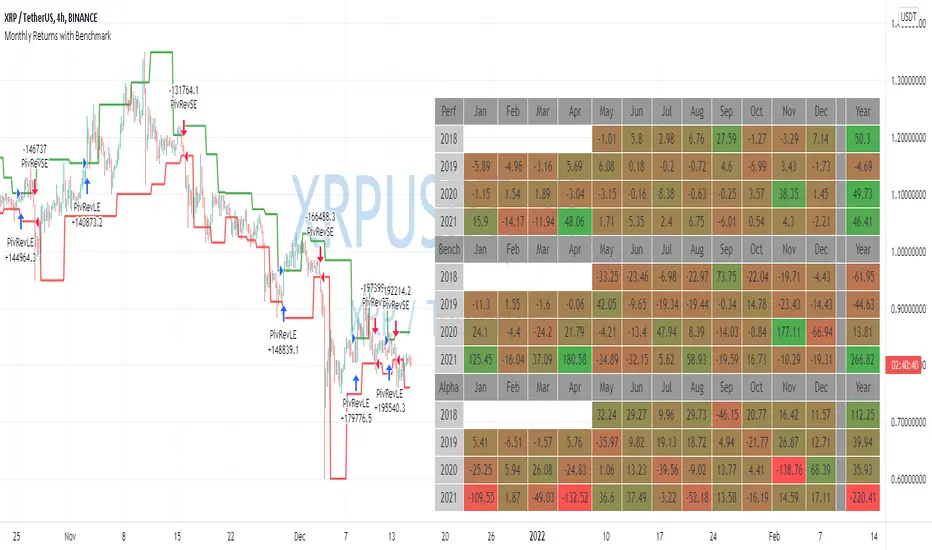
Monthly Returns with BenchmarkI keep working on trying to make TradingView strategies look fancier.
A few months ago I published the first version of the Monthly Returns for Strategies in Pine Script. I received quite a lot of good feedback and quite a lot of requests to update it.
This is a more advanced version of the Monthly Returns, in it, you can:
Display monthly returns of your strategy, benchmark, and alpha over this benchmark.
Select benchmark to be another instrument
Select the date from which you want to compute monthly returns
Show/hide benchmark and alpha
Choose colors for gradient for gain/loss values
Use it with any type of strategy
Use it with replay
I hope it will be useful for you.
It's not about the strategy itself but the way you display returns on your chart. So pls don't critique my choice of the strategy and its performance 🙂
Disclaimer
Please remember that past performance may not be indicative of future results.
Due to various factors, including changing market conditions, the strategy may no longer perform as well as in historical backtesting.
This post and the script don’t provide any financial advice.
The Divergent - Advanced Divergence IndicatorAutomated divergence detection with unparalleled customizability for any market on TradingView.
This is the Basic (Free) version of The Divergent - Advanced Divergence Indicator .
Features :
1. Divergence detection for any market & any timeframe
Bitcoin? Tesla? Gold? You name it. The Divergent will spot divergences for you on any market and any timeframe.
2. Choose from 2 built-in oscillators
The Basic version of The Divergent comes with 2 built-in oscillators: MACD and RSI
3. Automated detection of Regular Bullish and Regular Bearish divergences
The Basic version of The Divergent can detect two types of divergences: Regular Bullish and Regular Bearish
4. Complete control over every aspect of divergence detection
The Divergent exposes over 40 different settings to allow you fine tune the divergence detection algorithm.
- Oscillator (MACD / RSI)
- Detect Regular Bullish Divergences
- Detect Regular Bearish Divergences
- Pivot Detection Source (Price / Oscillator)
- Source smoothing
- Candle Pivot Detection Mode (Bodies / Wicks)
- Pivot Lookback Right
- Pivot Lookback Left
- Divergence Max. Length
- Divergence Min. Length
- Number of Historic Pivots to Compare
- Pivot Correction
- Restrict Starting Pivot to a Single Divergence
- Allow Early Detection of Divergences
- Line of Sight filter
- Minimum Pivot Change filter
- Pivot Candle Color filter
- Moving Average Filter
- MACD settings
- RSI settings
5. Divergence statistics
6. Fully documented
The Divergent has each and every of its inputs documented via tooltips inside the settings panel. Simply hover your mouse over the ( i ) icon next each the input field to learn more about the purpose of the configuration.
---

Dynamic Fibonacci Pivot Points & EMA CrossoversI have created this script for those who face difficulties drawing Fibonacci levels as this script is Dynamic so it automatically calculates the ranges based on current High and Lows. I have also added Standard Fibonacci Pivot Points so that we can easily see the confluences between Dynamic and Standard pivot points. Apart from this I have also added EMA Crossovers so that we can easily identify trend changes. You can modify this script as per your own.


Daily Settlement (BM&FBOVESPA B3 FUTURES)This script is simple designed to plot the daily settlement to any Securities traded on B3, Brazilian stock exchange.
The daily settlement is an important price where position traders are adjusted every day. This adjustment is defined by the exchange itself every day at approximately 4 pm, with an average of all trades in this window.
We consider that the settlement is a region of "money spent", where every day, some player "woke up" in long or in short at that price. As this is a region of "money spent", traders should give significant attention when traded at this price.

Spartan Trade Master 1.0Dear Traders/investors,
Make use of the Trade setup for intraday/Scalping/Swing Trading using Pivot Points , Along with CPR , EMA And Zone confirmation.
Advantages and Top Features:
-> CPR
-> Camarilla and standard Pivot Points
-> 20/50/100/200 EMA
-> Boring Candle
-> Next Day CPR & Camarilla
-> Multi Timeframe Analysis Using single chart
-> Previous Day High And Low
-> Supply and Demand Zones Based on Timeframes
How to Use?
Camarilla Trade Setup:
Green Zone: Reversal Buy Zone
Red Zone: Reversal Sell Zone
CPR Trade Setup:
1. Narrow CPR indicates Trending market
2. Wide CPR indicates sideways market
CPR + Camarilla confirmation:
Whenever there is a Narrow CPR we need to look for Breakout Trades.
Whenever there is a Wide CPR we need to look for Reversal Trade.
EMA : Exponential moving average tries to reduce confusion and noise of everyday price action.
Boring candle: Helps to identify any explosive or non-explosive moves, during marking of demand and supply zones.

Weekly Fibonacci MatrixThe weekly Fibonacci Matrix builds a matrix based on specific time and price criteria. It is paired with higher and lower timeframe matrices to identify key entry and exit points for day trades and intraweek swing trades.
This is part of a full suite of tools I have developed for matrix analysis and ORB breakouts.
