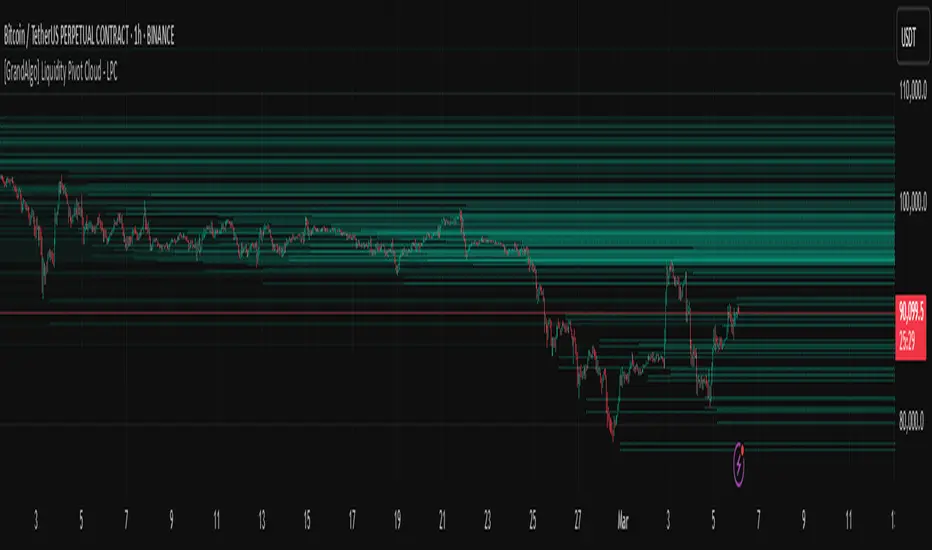
[GrandAlgo] Liquidity Pivot Cloud - LPCLiquidity Pivot Cloud (LPC) is a visualization tool that extends all pivot levels to the right, creating a structured liquidity map across the chart. Instead of treating pivot points as static levels, LPC transforms them into a dynamic cloud, highlighting key areas where price has historically reacted.
Key Features:
Extended Pivot Levels – Automatically stretches all pivot highs and lows, forming a continuous liquidity zone.
Clear Structure – Provides an organized view of price action, making it easy to identify reaction zones.
Dynamic Liquidity Map – Helps traders spot potential liquidity sweeps and areas of price absorption.
How to Use:
Identify Liquidity Zones – Areas with multiple overlapping pivots signal strong liquidity pools.
Look for Reactions – Price often consolidates, wicks, or reverses around extended pivot clouds.
Combine with Confluence – Use alongside Fair Value Gaps, Institutional Price Blocks, or Market Structure shifts for higher probability setups.
LPC aligns with smart money concepts by revealing key liquidity areas where stop hunts, liquidity grabs, and institutional activity are likely to occur. It helps traders see where price is likely to be drawn before a major move, making it a valuable tool for those trading liquidity-based strategies.
Pivotpointshighlow
Fractal Breakout Trend Following System█ OVERVIEW
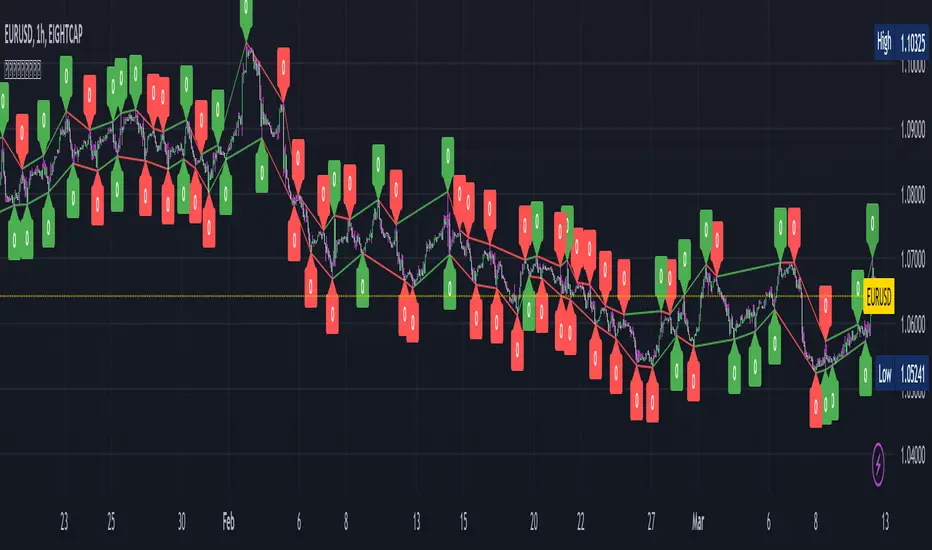
The Fractal Breakout Trend Following System is a custom technical analysis tool designed to pinpoint significant fractal pivot points and breakout levels. By analyzing price action through configurable pivot parameters, this indicator dynamically identifies key support and resistance zones. It not only marks crucial highs and lows on the chart but also signals potential trend reversals through real-time breakout detections, helping traders capture shifts in market momentum.
█ KEY FEATURES
Fractal Pivot Detection
Utilizes user-defined left and right pivot lengths to detect local highs (pivot highs) and lows (pivot lows). This fractal-based approach ensures that only meaningful price moves are considered, effectively filtering out minor market noise.
Dynamic Line Visualization
Upon confirmation of a pivot, the system draws a dynamic line representing resistance (from pivot highs) or support (from pivot lows). These lines extend across the chart until a breakout occurs, offering a continuous visual guide to key levels.
Trend Breakout Signals
Monitors for price crossovers relative to the drawn pivot lines. A crossover above a resistance line signals a bullish breakout, while a crossunder below a support line indicates a bearish move, thus updating the prevailing trend.
Pivot Labelling
Assigns labels such as "HH", "LH", "LL", or "HL" to detected pivots based on their relative values.
It uses the following designations:
HH (Higher High) : Indicates that the current pivot high is greater than the previous pivot high, suggesting continued upward momentum.
LH (Lower High) : Signals that the current pivot high is lower than the previous pivot high, which may hint at a potential reversal within an uptrend.
LL (Lower Low) : Shows that the current pivot low is lower than the previous pivot low, confirming sustained downward pressure.
HL (Higher Low) : Reveals that the current pivot low is higher than the previous pivot low, potentially indicating the beginning of an upward reversal in a downtrend.
These labels provide traders with immediate insight into the market structure and recent price behavior.
Customizable Visual Settings
Offers various customization options:
• Adjust pivot sensitivity via left/right pivot inputs.
• Toggle pivot labels on or off.
• Enable background color changes to reflect bullish or bearish trends.
• Choose preferred colors for bullish (e.g., green) and bearish (e.g., red) signals.
█ UNDERLYING METHODOLOGY & CALCULATIONS
Fractal Pivot Calculation
The script employs a sliding window technique using configurable left and right parameters to identify local highs and lows. Detected pivot values are sanitized to ensure consistency in subsequent calculations.
Dynamic Line Plotting
When a new pivot is detected, a corresponding line is drawn from the pivot point. This line extends until the price breaks the level, at which point it is reset. This method provides a continuous reference for support and resistance.
Trend Breakout Identification
By continuously monitoring price interactions with the pivot lines, the indicator identifies breakouts. A price crossover above a resistance line suggests a bullish breakout, while a crossunder below a support line indicates a bearish shift. The current trend is updated accordingly.
Pivot Label Assignment
The system compares the current pivot with the previous one to determine if the move represents a higher high, lower high, higher low, or lower low. This classification helps traders understand the underlying market momentum.
█ HOW TO USE THE INDICATOR
1 — Apply the Indicator
• Add the Fractal Breakout Trend Following System to your chart to begin visualizing dynamic pivot points and breakout signals.
2 — Adjust Settings for Your Market
• Pivot Detection – Configure the left and right pivot lengths for both highs and lows to suit your desired sensitivity:
- Use shorter lengths for more responsive signals in fast-moving markets.
- Use longer lengths to filter out minor fluctuations in volatile conditions.
• Visual Customization – Toggle the display of pivot labels and background color changes. Select your preferred colors for bullish and bearish trends.
3 — Interpret the Signals
• Support & Resistance Lines – Observe the dynamically drawn lines that represent key pivot levels.
• Pivot Labels – Look for labels like "HH", "LH", "LL", and "HL" to quickly assess market structure and trend behavior.
• Trend Signals – Watch for price crossovers and corresponding background color shifts to gauge bullish or bearish breakouts.
4 — Integrate with Your Trading Strategy
• Use the identified pivot points as potential support and resistance levels.
• Combine breakout signals with other technical indicators for comprehensive trade confirmation.
• Adjust the sensitivity settings to tailor the indicator to various instruments and market conditions.
█ CONCLUSION
The Fractal Breakout Trend Following System offers a robust framework for identifying critical fractal pivot points and potential breakout opportunities. With its dynamic line plotting, clear pivot labeling, and customizable visual settings, this indicator equips traders with actionable insights to enhance decision-making and optimize entry and exit strategies.

Intelligent Support & Resistance Lines (MTF)This script automatically detects and updates key Support & Resistance (S/R) levels using a higher timeframe (MTF) approach. By leveraging volume confirmation, levels are only identified when significant volume (relative to the SMA of volume) appears. Each level is drawn horizontally in real time, and whenever the market breaks above a resistance level (and retests it), the script automatically converts that resistance into support. The opposite occurs if the market breaks below a support level.
Key Features:
Multi-Timeframe (MTF) Data
Select a higher timeframe for more robust S/R calculations.
The script fetches High, Low, Volume, and SMA of Volume from the chosen timeframe.
Automatic Role Reversal
Resistance becomes Support if a breakout retest occurs.
Support becomes Resistance if a breakdown retest occurs.
Dynamic Line Width & Labeling
Each S/R line’s thickness increases with additional touches, making frequently tested levels easier to spot.
Labels automatically display the number of touches (e.g., “R 3” or “S 2”) and can have adjustable text size.
Volume Threshold
Only significant pivots (where volume exceeds a specified multiplier of average volume) are plotted, reducing noise.
Horizontal Offset for Clarity
Lines are drawn with timestamps instead of bar_index, ensuring that old levels remain visible without chart limitations.
Adjustable Maximum Levels
Maintain a clean chart by limiting how many S/R lines remain at once.
How It Works:
Pivot Detection: The script identifies swing highs and lows from the higher timeframe (timeframeSR).
Volume Check: Only pivots with volume ≥ (SMA Volume * volumeThreshold) qualify.
Line Creation & Updates: New lines are drawn at these pivots, labeled “R #” or “S #,” indicating how many times they’ve been touched.
Role Reversal: If price breaks above a resistance and retests it from above, that line is removed from the resistance array and re-created in the support array (and vice versa).
Inputs:
Timeframe for S/R: Choose the higher timeframe for S/R calculations.
Swing Length: Number of bars to consider in a pivot calculation.
Minimum Touches: Minimum required touches before drawing or updating a level.
Volume Threshold (Multiplier): Determines how much volume (relative to SMA) is needed to confirm a pivot.
Maximum Number of Levels: Caps how many S/R lines can be shown at once.
Color for Resistance & Color for Support: Customize your preferred colors for lines and labels.
Label Size: Select from "tiny", "small", "normal", "large", or "huge" to resize the labels.
Disclaimer:
This script is intended for educational purposes and should not be interpreted as financial or investment advice. Always conduct your own research or consult a qualified professional before making trading decisions.

Pivot Point Profile [LuxAlgo]The Pivot Point Profile indicator groups and displays data accumulated from previous pivot points, providing a comprehensive method for prioritizing and displaying areas of interest directly given by swing highs and lows.
Users have access to common settings present in other profile-type indicators.
🔶 USAGE
The Pivot Point Profile is particularly helpful in identifying highly active reversal zones that have been visited multiple times by price. Because of this, we could generally expect these areas to serve as future points of interest, often acting as support or resistance when re-visited.
The profile displays data associated with both Pivot Highs and Pivot Lows. Each row consists of pivot high and pivot low counts side-by-side, forming the total width of the row.
By analyzing the row as a whole, we can gain a better understanding of WHERE to look for interactions.
By analyzing the pivot counts independently, we can gain a better understanding of WHAT to expect when returning to these areas.
For example:
If a row in the profile contains entirely Pivot Lows, this could be seen as an indication to look for buyers to hold that level for a continuation upwards. A break of this level could be interpreted as a lack of interest from previous buyers at this level, indicating a further move down.
🔹 Concentrated Areas
Each row in the profile displays the current count of high pivots and low pivots within the selected lookback. The largest count for each pivot direction is identified as a "Concentrated Area (CA)", these CAs are highlighted over the chart with a line displaying the average of all pivots within that CA. The CA Average is the average of all pivot points (in the majority direction) within the given row.
These can hold more importance as potential support/resistance areas.
Note: The CA Threshold can be manually adjusted to highlight all rows based on a user-selected value.
🔶 DETAILS
🔹 Calculation
The idea behind the Pivot Point Profile is a new analysis method for pivot points, taking the idea of a volume profile and adapting it to display pivot points instead of volume. By using this data, in theory, we should be able to better prioritize zones to anticipate reversals, as well as identify key levels to watch for buyer & seller interactions to use as confirmations in direction.
The (vertical) width of each row is the product of the script's "Row Size", this is the number of rows that the profile will consist of. With a max of 250, the profile can be decently granular. That being said, A more granular profile will have fewer overlapping pivot points. By decreasing the row size (Using fewer rows in the profile) you will increase the tolerance for grouping pivot points. Potentially leading to a more comprehensive Profile. Inversely, By reducing the tolerance for grouping, you will better visualize only similar highs and lows but may have noisier data to sift through.
The Profile is calculated based on a "Lookback" parameter, using only the lookback amount of previous high and low pivots to calculate the profile. Configuring this parameter alongside "Pivot Length", will allow for great control over the frame of reference of the profile.
Note: This indicator is capable of utilizing the full chart history of pivot points, this can be done by enabling the "Use Full Chart History" setting, this will cause the script will calculate from everything it has access to on your current chart.
🔹 Display
The Pivot Point Profile display can be customized to fit a various range of chart styles and visual needs. The specific settings to adjust these can be located in the "Profile Display" Section of the User Inputs.
Profile Width: Sets the Left to Right Width of the Profile. This is the maximum width that the profile will occupy and will scale to fit within this width.
Profile Offset: Sets the distance of the Profile's Axis from the current chart candle. This moves the entire profile left and right to enable to user to set the distance between the profile and the current candle.
Direction: Changes the display direction of the profile, allowing for "Left", "Right", or "Center" display styles.
🔶 SETTINGS
🔹 Pivot Point Parameters
Pivot Type: Choose between "Fractal Pivots" or "SMC Structure" to use as the basis for pivots.
Length: Sets the length for the pivot calculations.
🔹 Profile Calculations Parameters
Lookback: Sets the number of pivots to calculate within, in increments of high and low pairs. (Setting this to 1 = 1 Pivot High & 1 Pivot Low)
Use Full Chart History: Disregards the set lookback and instead uses all available chart data to calculate from.
Row Size: Sets the total number of rows to calculate the profile with.
🔹 Profile Display
Profile Width: Sets the max left & right width (in bars) that the profile will occupy.
Profile Offset: Sets the distance of the profile axis from the last chart bar.
Direction: Sets the display direction
🔹 Concentrated Areas
Highlight CAs: Extends the rows left from concentrated areas.
CA Threshold: Manually set the threshold for determining concentrated areas, when disabled, only the largest rows will be displayed.
CA Averages: Toggles the concentrated area averages for each pivot direction.
Note: CA Averages can be displayed independently without CA Highlights being displayed, and vice versa.

Swing DistanceHello fellas,
This simple indicator helps to visualize the distance between swings. It consists of two lines, the highest and the lowest line, which show the highest and lowest value of the set lookback, respectively. Additionally, it plots labels with the distance (in %) between the highest and the lowest line when there is a change in either the highest or the lowest value.
Use Case:
This tool helps you get a feel for which trades you might want to take and which timeframe you might want to use.
Side Note: This indicator is not intended to be used as a signal emitter or filter!
Best regards,
simwai

Market Pivot Levels [Past & Live]Market Levels provide a robust view of daily pivot points of markets such as high/low/close with both past and live values shown at the same time using the recently updated system of polylines of pinescript.
The main need for this script arose from not being able to use plots for daily points because plots are inherently once drawn can't be erased and because we can't plot stuff for previous bars after values are determined we can't use them reliably. And while we can use traditional lines, because we would have extremely high amount of lines and we would have to keep removing the previous ones it wouldn't be that effective way for us. So we try to do it with the new method of polylines .
Features of this script:
- Daily High/Low Points
- Yesterday High/Low/Close Points
- Pre-Market High-Low points.
Now let's preview some of the important points of code and see how we achieve this:
With the code below we make sure no matter which chart we are using we are getting the extended hours version of sessions so our calculations are made safely for viewing pre-market conditions.
// Let's get ticker extended no matter what the current chart is
tc = ticker.new(syminfo.prefix, syminfo.ticker, session.extended)
Coding our own function to calculate high's and low's because inbuilt pinescript function cannot take series and we send this function to retrieve our high's and lows.
// On the fly function to calculate daily highlows instead of tv inbuilt because tv's length cannot take series
f_highlow(int last) =>
bardiff = last
float _low = low, float _high = high
for i = bardiff to 0 by 1
if high > _high
_high := high
if low < _low
_low := low
With doing calculations at the bars of day ending points we can retrieve the correct points and values and push them for our polylines array so it can be used in best way possible.
// Daily change points
changeD = timeframe.change("D")
// When new day starts fill polyline arrays with previous day values for polylines to draw on chart
// We also update prevtime values with current ones after we pushed to the arrays
if changeD
f_arrFill(cpArrHigh, cpArrLow, prevArrh, prevArrl, prevArrc, prevMarh, prevMarl)
valHolder.unshift(valueHold.new(_high, _low, _high, _close, _low, time, pr_h, pr_l))
The rest of the code is annotated and commented. You can let me know in comments if you have any questions. Happy trading.

Market Smith IndicatorsMarket Smith has a collection of tools that are useful for identifying stocks. On their charts they have a 21/50/200 day moving averages, high and low pivot points, a relative strength line, and a relative strength rating. This script contains indicators for the following:
21/50/200 Day Moving Averages
High and Low pivot points
A Relative Strength line
A Relative Strength rating
21/50/200 Day Moving Averages
The 21/50/200 Day moving averages are simple moving averages. They are visible in any chart increment but to use them properly you need to set you charts to be by day. Labels will appear on the right of the lines to show that they are representative of 21/50/200 day moving averages.
High and Low pivot points
The High and Low pivot points are green for high pivot points and red for low points. They are show in the Market Smith style with the numbers simply above the pivot points.
Relative Strength line
The Relative Strength line is a line that shows the strength of the stock compared to the S&P 500. In this case we utilize the SPX ticker to compare the stock to. This line is almost identical to the Market Smith tool and is an excellent tool to determine how a stock is doing compared to the market. When movements in the stock and shown with sideways trending of the RS line that means that the stock is following the market. When a stock is outperforming the market the RS line will follow.
Relative Strength rating
Thank you to ©Fred6724 for the RS Rating inspiration. They wrote excellent open source code for a RS Rating comparable to Market Smith. As the RS Rating in Market Smith is not open source it is difficult to know exactly how it is being calculated. After simplifying Fred's code and building upon a few ideas I had I compared the RS Rating to multiple Market Smith Ratings. The rating is close but often off by multiple points. If there is anyone who has a better idea on how to get this rating or how to improve on the code please send me a PM or fork this project. This rating is a good indicator to see how a certain stock compares to other stocks in the market. In Market Smith they are able to utilize their database to compare it to all other stocks. Since we do not have access to the same tools we are only able to compare it to the percentage of stocks above the 200, 150, 100, 50, and 20 day moving average.
Using these tools together are a small fraction what make people like Bill O'neill and Jim Roppel so successful. I plan on updating the RS Rating as I continue to work on this project so if there is anyone who has ideas then please send me a PM. Ultimately the goal of this project is to have a solution that is identical to Market Smith.

K's Pivot PointsPivot points are a popular technical analysis tool used by traders to identify potential levels of support and resistance in a given timeframe. Pivot points are derived from previous price action and are used to estimate potential price levels where an asset may experience a reversal, breakout, or significant price movement.
The calculation of pivot points involves a simple formula that takes into account the high, low, and close prices from the previous trading session or a specific period. The most commonly used pivot point calculation method is the "Standard" or "Classic" method. Here's the formula:
Pivot Point (P) = (High + Low + Close) / 3
In addition to the pivot point itself, several support and resistance levels are calculated based on the pivot point value.
K's Pivot Points try to enhance them by incorporating multiple elements and by applying a re-integration strategy to validate two events:
* Found_Support: This event represents a basing market that is bound to recover or at least shape a bounce.
* Found_Resistance: This event represents a toppish market that is bound to consolidate or at least shape a pause.
K's Pivot Points are calculated following these steps:
1. Calculate the highest of highs for the previous 24 periods (preferably hours).
2. Calculate the lowest of lows for the previous 24 periods (preferably hours).
3. Calculate a 24-period (preferably hours) moving average of the close price.
4. Calculate K's Pivot Point as the average between the three previous step.
5. To find the support, use this formula: Support = (Lowest K's pivot point of the last 12 periods * 2) - Step 1
6. To find the resistance, use this formula: Resistance = (Highest K's pivot point of the last 12 periods * 2) - Step 2
The re-integration strategy to find support and resistance areas is as follows:
* A support has been found if the market breaks the support and shapes a close above it afterwards.
* A resistance has been found if the market surpasses the resistance and shapes a close below it afterwards.
The lookback period (whether 24 and 12) can be modified but the default versions work well.

Pivot Average [Misu]█ This Indicator is based on Pivot Points.
It aggregates closed Pivot Points to determine a " Pivot Average " line.
Pivot Points here refer to highs and lows.
█ Usages:
Pivot Average can be used as resistance or breakout area.
It is also very usefull to find battle zones.
It can also be used as a trend indicator: when the price is below, trend is down, when price is above, trend is up.
Mixed with momentum/volatility indicator it is very powerfull.
█ Parameters:
Deviation: Parameter used to calculate pivots.
Depth: Parameter used to calculate pivots.
Length: History Lenght used to determine Pivot Average.
Smoothing MA Lenght: MA lenght used to smooth Pivot Average.
Close Range %: Define price percentage change required to determine close pivots.
Color: Color of the Pivot Average.

Customizable Pivot Support/Resistance Zones [MyTradingCoder]This script uses the standard pivot-high/pivot-low built-in methods to identify pivot points on the chart as a base calculation for the zones. Rather than displaying basic lines, it displays a zone from the original pivot point to the closest part of the available body on the same candle. The script comes in handy by utilizing Pinescripts available input.source() function to allow for an external indicators output value to be used within the indicator. Make sure to read all of the TOOLTIPS in the indicator settings menu to get a full understanding of what each setting does, and how it can affect the results that end up on the chart.
By enabling the custom filter in the indicator settings, you will notice you have the ability to filter out zones using an external indicator such as an RSI. Maybe you only want zones to be calculated/drawn when the RSI is overbought or oversold, or maybe you only want the zones to calculate/draw if the Supertrend is green or red. The list of possible filters that you can implement is too many to count. Feel free to play around with the indicator however you like, and configure something that you find to be the most useful for your trading.
On top of everything listed above, the indicator has pre-programmed built-in alertconditions so that you can potentially automate trading, or get a notification to your cell phone when a zone is being touched/broken.

Pivot Points with Slopes - By Necromancer█ OVERVIEW
- This script draws array-based Pivot Points with the calculated slope on the next connecting point.
- The script works left to right, but could be be modified.
- Looks best with Label-Style on Diamonds, without Slope Text drawn.
█ Thank You!
- Many more to come which will utilize these fundamentals!
🅝🅔🅒🅡🅞🅜🅐🅝🅒🅔🅡
Support and Resistance Multiperiod (Zig Zag Based)Support and Resistance Multiperiod (Zig Zag Based)
What is the indicator?
• The indicator is a multi period (up to 5 lengths) Support and Resistance indicator calculated based on Zig Zag.
Who can use?
Scalpers to Long term investors
What timeframe to use?
• Any timeframe
What are the lines?
• Green lines are Support levels.
• Orange lines are Resistance levels.
How to use?
• Buy Low and Sell High.
• Brighter zones means strong Support or Resistance.
• Weaker zones appear lighter.
• Brighter zones are formed by overlapping of lines from multiple levels of support or resistance.
Indicator Menu
• The indicator can input 5 different Lengths.
• The default settings uses 13, 21, 52, 100 & 200.
• Every option are customizable.

Pivot Reversal AlertsPivot Reversal Study script, for generating Alerts and visual plotting of Pivot Reversal lines on the charts. Use a Strategy script (like Figs & Dates), for backtesting different settings on various time frames and charts.

The Multi-day Central Pivot RangeThe indicator is a Multi-day CPR.
It shows CPR range as per yesterday's HLC and also CPR range for last n number of trading sessions.
For example: If you mention the value as two in Multi-day CPR (blue color) then it calculates the CPR using HLC of the last two trading sessions.
Also, the daily CPR is designed in such a way to highlight Virgin CPR (purple color) separately from the normal CPR(fuchsia color) .

The Golden PivotsThe Golden Pivots indicator is a combination of the following:
1. Central Pivot Range
2. Floor Pivots
3. Camarilla Pivots
4. Monthly, Weekly, Daily Highs and lows
5. Candlestick Setups
All the pivot calculations are based on Secret of Pivot Boss book by Frank Ochoa.
One can also view tomorrow's central pivot range by today end of the day.
