BOSS| FIBONACCIBOSS PRO TRADING SYSTEM INDICATORS
Used to determine directional movement and potential Fibonacci support/resistance levels.
Pivot Points use the prior period's high, low and close to estimate future support and resistance levels.
Set alerts for each individual fib and pivot, or set one alert for any fib or pivot cross.
Use Daily for lower time frames
Use Weekly for higher timeframes
Use monthly for 12H and up
Indicator Is a part of our PRO trading system.
Purchase System Here: bosscripts.com
Pivotsupport

Trend Direction Helper (ZigZag and S/R and HH/LL labels)Hey everyone
First of all, I'd like to thank Ricardo Santos, Backtest Rookies for the inspiration for this script.
Actually, most of it is coming from them and I only mixed them up (and added my secret sauce ^^). If some of you are not thinking about a trading secret sauce, please get serious for a moment :)
Some of you asked me how I do to set the trend direction. You all understood that if you get an UP label, then the price should go up and vice-versa for down.
But it's not so easy to define the good signals for each asset and each timeframe. I'm going to repeat what I said yesterday because ... well... that's what trading is about
So quoting myself here "The inputs set by default will have to be changed for your asset/timeframe and can't be generic for everything. You have to play with the inputs until the signals will make sense to you
The indicator/strategy with a unique configuration that you'll never check or update according to the market condition DOES NOT exit. "
BUT... a bit of patience and practice and you might do wonders.
The Method
I never realized until now but by connecting the higher highs/lower lows, I was drawing zigzag lines.
The Zig Zag Master is Ricardo Santos . Please give him a follow, he's awesome
For those who don't want to draw on the chart or (my preferred choice) need some inspiration to define your trend directions, this script is for YOU (and your family, your pet, your girlfriend/boyfriend, ...)
I think that each asset/timeframe chart has its own history. What worked in a post could work in the future.
In that regard, if a trend direction worked in the past, that's the parameter that I'll use to trade with it in a demo account and make sure it's relevant. If not then I will adjust
If you're trading with new indicators or a new method right away on your real trading account, you're gonna have a bad time imgflip.com
Lines EVERYWHERE
The script draws the classical horizontal pivots + the zig zag lines + the Higher Highs/Lower Lows label in just 1 script. I'm very excited to share a script (on which I coded 100 lines out of 500) but no one else did it
The horizontal pivots part are coming from Backtest Rookies
For more security, you can add a pullback on a moving average after getting a signal. Pullbacks are necessary to limit any eventual loss or maximize your gains by getting in the trend sooner.
I really give you a solid method and a great script in my opinion. 6 years of experience given away for FREE :p (when Dave will start thinking as a business man instead :O)
Does it repaint ?
Getting this question twice a day. You guys are obsessed with the repainting :)
Short answer, yes because it will calculate the pivots and zig zags whenever new higher highs/lower lows will be formed.
However, the trend direction code is based on the candle close so it shouldn't repaint. If it does, please let me know
See you all on Monday
Love you all
Dave
____________________________________________________________
Be sure to hit the thumbs up. Building those indicators take a lot of time and likes are always rewarding for me :) (tips are accepted too)
- If you want to suggest some indicators that I can develop and share with the community, please use my personal TRELLO board
- I'm an officially approved PineEditor/LUA/MT4 approved mentor on codementor. You can request a coaching with me if you want and I'll teach you how to build kick-ass indicators and strategies
Jump on a 1 to 1 coaching with me
- You can also hire for a custom dev of your indicator/strategy/bot/chrome extension/python
Disclaimer:
Trading involves a high level of financial risk, and may not be appropriate because you may experience losses greater than your deposit. Leverage can be against you.
Do not trade with capital that you can not afford to lose. You must be aware and have a complete understanding of all the risks associated with the market and trading. We can not be held responsible for any loss you incur.
Trading also involves risks of gambling addiction.
Please notice I do not provide financial advice - my indicators, strategies, educational ideas are intended to provide only some source code for anyone interested in improving their trading
The proprietary indicators and strategies developed by Best Trading Indicator, the object of intellectual property rights are and remain the exclusive property of Best Trading Indicator, at the exclusion of images and videos and texts free of rights or provided by the Company or external legal or physical person.
No assignment of intellectual property rights is carried out through these Terms and Conditions.
Any total or partial reproduction, modification or use of these properties for any reason whatsoever is strictly prohibited without the express written authorization of the Company.

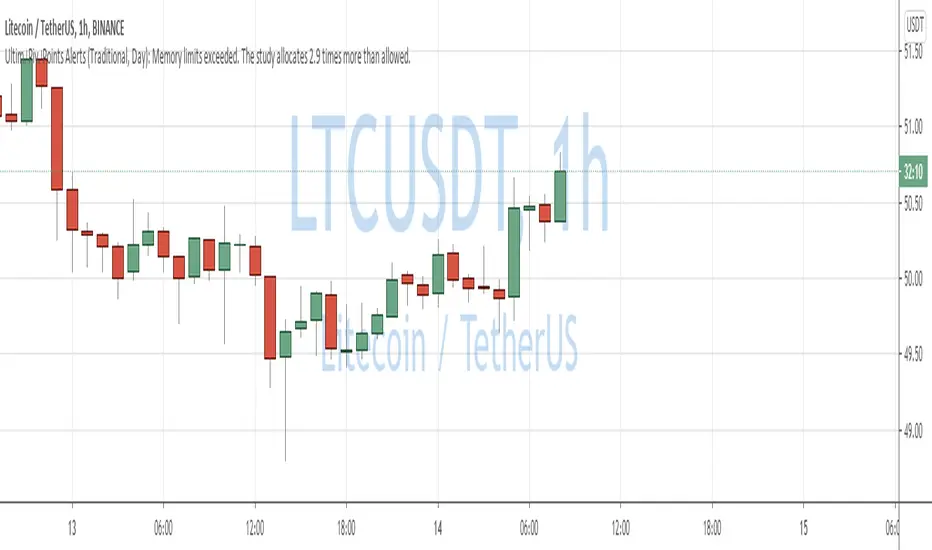
QuantNomad - Ultimate Pivot Points AlertsCreated a universal script for pivot points alerts.
In the script, you can choose one of 4 pivot point types: Traditional, Fibonacci, Woodie, and Camarilla.
You are able to create separate alerts for every level or create one for price crossing any level.
For separate levels, you can choose: "Cross", "Crossover" and "Crossunder".
You can also choose to show/hide:
Historical Levels
Levels Values
Current Levels - Levels calculated on the current period, on close of the period they will become valid levels for next periods. These levels do not participate in alerts calculations.
Because of some TradingView limitations, alerts won't be fired for the first bar of the session.
In the script used new v4 plotting features, so will be able to plot levels and labels nicely. Unfortunately, there is a limit on the number of consecutive lines you can plot on the plot (around 50), so historical lines in the past will disappear after 6-7 periods.
And remember:
Past performance does not guarantee future results.
Pivot Ranges AlertsThis script calculates the ranges of pivots and shows alerts when they are touched.
Requested by Jonathan - (jthurrott)

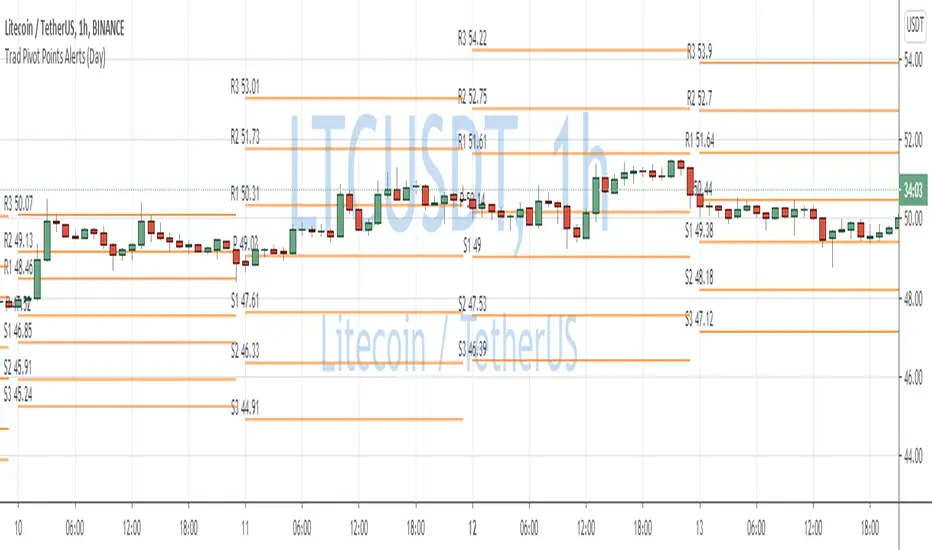
Traditional Pivot Points AlertsCreated a script for alerts on Traditional Pivot Points.
You will be able to create separate alerts for every level or create one for price crossing any level.
Because of some TradingView limitations, alerts won't be fired for the first bar of the session. Will try to solve that in the new versions.
In the script used new v4 plotting features, so will be able to plot levels and labels nicely. Unfortunately, there is a limit on the number of consecutive lines you can plot on the plot (around 50), so lines in the past will disappear.
You can enable/disable in params displaying level itself on the chart.
And remember:
Past performance does not guarantee future results.
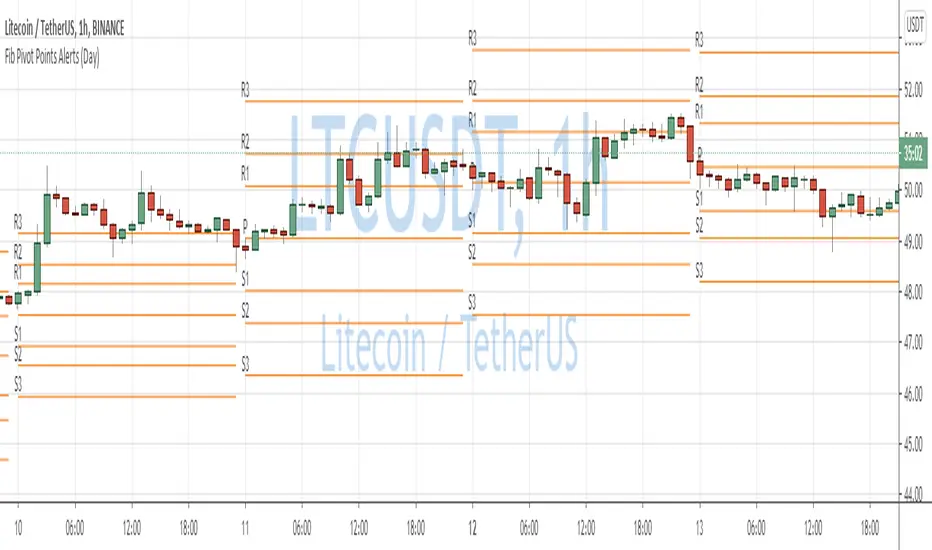
Fibonacci Pivot Points AlertsCreated a script for alerts on Fibonacci Pivot Points.
You will be able to create separate alerts for every level or create one for price crossing any level.
Because of some TradingView limitations, alerts won't be fired for the first bar of the session. Will try to solve that in the new versions.
In the script used new v4 plotting features, so will be able to plot levels and labels nicely. Unfortunately, there is a limit on the number of consecutive lines you can plot on the plot (around 50), so lines in the past will disappear.
And remember:
Past performance does not guarantee future results.
Higher High Lower Low Strategy (With Source Code)This script finds pivot highs and pivot lows then calculates higher highs & lower lows. And also it calculates support/resistance by using HH-HL-LL-LH points.
Generally HH and HL shows up-trend, LL and LH shows down-trend.
If price breaks resistance levels it means the trend is up or if price breaks support level it means the trend is down, so the script changes bar color blue or black. if there is up-trend then bar color is blue, or if down-trend then bar color is black. also as you can see support and resistance levels change dynamically.
If you use smaller numbers for left/right bars then it will be more sensitive.
source code of :

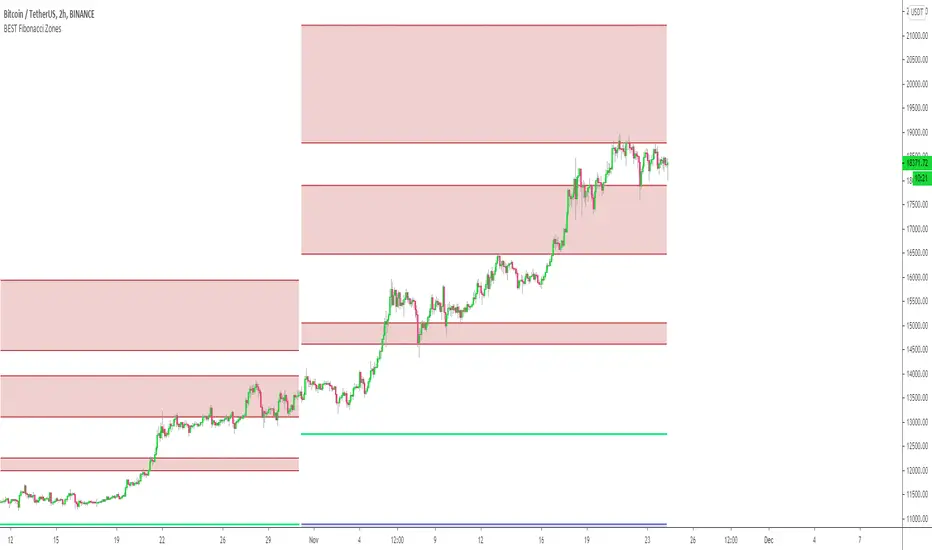
Automatic Multi-timeframes fibonacci zonesHello traders
This is a fancy indicators that will draw for you the fibonacci zones on either daily/weely/monthly timeframes
I use those zones to define my take profit levels for my intraday trading
Hope it will help
Love you all
David
QuantNomad - Pivot Points AlertsVery simple scripts that will allow you to receive alerts for new Pivot Lows/Highs Points.
A solid arrow points to actual point low/high point, transparent - to the bar, you'll receive alerts for (Shifter by rightBars).
And remember:
Past performance does not guarantee future results.


(JS) Pivot Point RSILet me start by saying I really enjoyed putting this together - and also that it initially wasn't my idea, a friend of mine suggested it to me earlier today and I was intrigued by the concept.
So this is exactly what it sounds like - Pivot Points RSI.
I plan on adding the R4S4 and R5S5 in the future, though it only goes to 3 at the moment.
However I did include halfway points between existing pivots.
This RSI calculates prior closes + highs + lows based on the intraday (or week, or month, depending on chart resolution) indicator values, then takes that info and creates pivots on the RSI to plot potential RSI support and resistance. This is a pretty great concept and I plan on putting it to use in the future myself.
Includes 3 color schemes.

(JS) Multi-Time Frame Pivot Point DetectorSick of flipping through Pivot Point settings to change the time frame?
Or to hide certain ones because it screws up the auto-zoom?
Or are you just wishing there was something out there that was simple and effective?
Well - me too, that's why I made this automatic Pivot Points detector. Right now it only goes to S3/R3 (will expand in the future), but I made this specifically for my day trading template.
So this automatically detects the nearest Pivot Points above and below price - and it does Daily, Weekly, and Monthly, so there should be 6 lines showing at all times.
Speaking of which....
Blue - Daily
Green - Weekly
Red- Monthly
You'll also notice a really thick line will appear time to time - that thick line (on all time frames is the Pivot line, so obviously above it is the resistance lines and below it lies the support lines.
All you have to do is turn it on and you'll be completely aware of your surroundings across multiple time frames all at once, hope you like it!
RyuPivot🔰 Pivot Points Standard Traditional Pivot Levels
📌Shows the same pivot levels from the Pivot Points Standard (Pivots) indicator on the Traditional settings. But with 3 indicators in one, can show the daily, weekly, and monthly levels all in one indicator. This indicator only shows the current pivot level and not the previous ones and will auto adjust update to the newest one. The current pivot line levels are shown across the chart.
📌Features
🔹P-D = Pivot Daily Timeframe
🔹P-W = Pivot Weekly Timeframe
🔹P-M = Pivot Monthly Timeframe
🔹S1, S2, S3, S4, S5 Pivot Supports with each timeframe D/W/M
🔹R1, R2, R3, R4, R5 Pivot Resistances with each timeframe D/W/M
🔹Can show/hide any timeframe Daily, Weekly, Monthly, or all
🔹Option to show/hide the 4th and 5th support/resistance levels
🔹Can adjust the line width for each timeframe
🔹Can show/hide pivot text labels
🔹Can adjust pivot text labels position offset
📌Default set Daily Pivots off, can use for trading lower timeframes for scalps. Shows Monthly and Weekly pivots with Pivot support/resistance levels 4 and 5 default on, optionally can hide. Default line width set with Monthly largest at 3, Weekly at 2, and Daily smallest at 1; can adjust to preference and can change color in the style tab. Note, for the Daily Pivots levels for S4, S5, R4, and R5 text labels are not shown since ran out of room to add more, but the line levels are still shown.

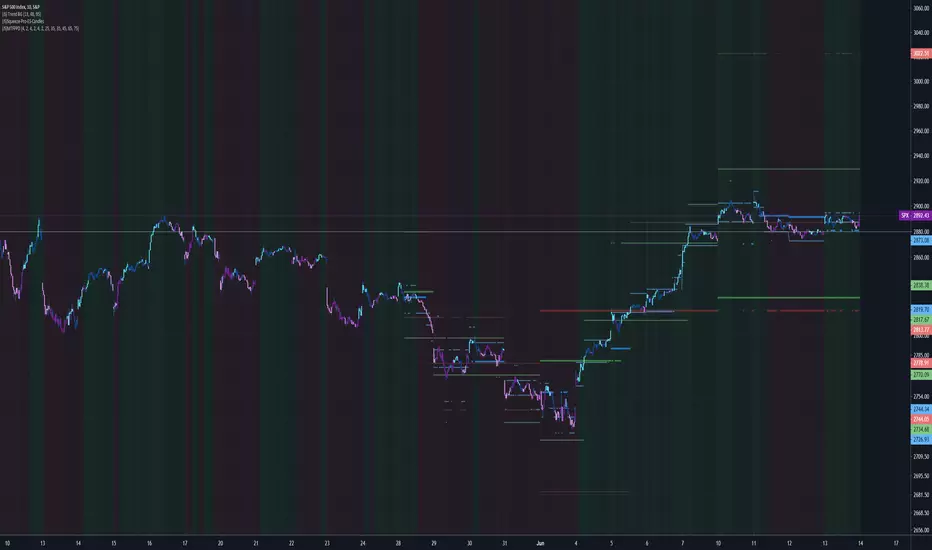
Pivot Points, by @juanmirocks# Advantages over TV's indicator "Pivot Points Standard"
1. Show pivot lines for all history, which lets you gauge trading strategies throughout time
2. More sensible Default/Auto time frame; e.g. on intradays only and always the market values of yesterday's Day are used
3. The halves between the key levels are also shown, which it's useful for some trading strategies
4. Arguably out-of-the-box nicer interface
Pivot Points as an indicator is a traditional strategy to draw resistance and support levels. It's best suited for intraday trading: the pivot points and resulting key levels are calculated from yesterday's market values (H, L, C). More details in the script's source.
Pivot Points trading is suitable for any market, and best for intraday (e.g. 3 min).

2R overlay positive biasHere is a pretty clean 2R - risk reward assessment that is overlaid on the price action. Positive bias, kind of lazy on the release but you can edit to change look back period or drop into one of your indicator edits as another metric for trade risk. If this helps drop a comment or thumbs up.
-Squam

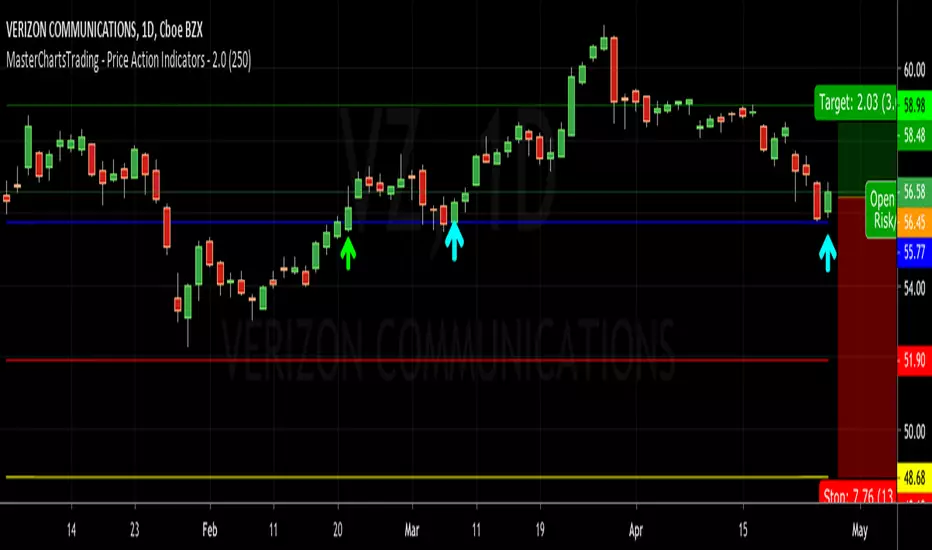
MasterChartsTrading - Price Action Indicators - 2.0Price action is easy to visualize.
It is very easy to read price action if you have a reference point. These support/resistance lines are there to help you read where the buyers and sellers are likely to make a stand.
You can also think of these indicators as moving pivot points.
MasterChartsTrading Price Action Indicators show good price levels to enter or exit at trade.
The Blue indicator line serves as a Bullish Trend setter.
If your instrument closes above the Blue line, we think about going Long (buying).
For commodities and Forex, when your trading instrument closes below the Red line, we think about Shorting (selling).
For Stocks, I prefer to use the Yellow line as my Bearish Trend setter (on Daily charts ).
Be sure to hit that Follow button! Please find me on social networks via the link on my profile page for more ideas from @MasterCharts!
Combined MTF Camarilla Pivots (HA + Candles)This is a fairly basic (but hopefully useful) indicator that combines three time-frames of Camarilla pivots into one.
Default time-frames are:
Weekly
Monthly
Yearly
Time-frames can be modified as you wish, they are just set to these as I generally only trade higher intervals (just note that formatting labels will not change - but you can update these as needed).
The Camarilla pivots displayed are as follows:
R3, R4, R5, R6
Pivot line (Middle/Base)
S3, S4, S5, S6
R1/S1 & R2/S2 are excluded to make way for R5/S5 & R6/S6 - as these are more useful for the majority of traders. The formula for levels 5/6 are always up for debate, as no official formula has ever been released. I've used what I consider a mid, or consensus calculation.
By default all historical pivot levels are displayed, as there can be some benefit to mapping these forward once the relevant period has ended. If people find it's too cluttered I'll look into having an option to display the current period only.
Unfortunately, TradingView doesn't allow labels on plots (seems like such a basic feature to be missing, but there you go), so you'll have to learn the colours/linewidths.
Oh, and there's a checkbox to enable pivots to be calculated on Heiken-Ashi prices/candles rather than default prices/candles. This heavily modifies the location of the Camarilla Pivots, but I've found that in certain situations you can get some great results.
Let me know your thoughts/comments/suggestions.
Cheers
DD


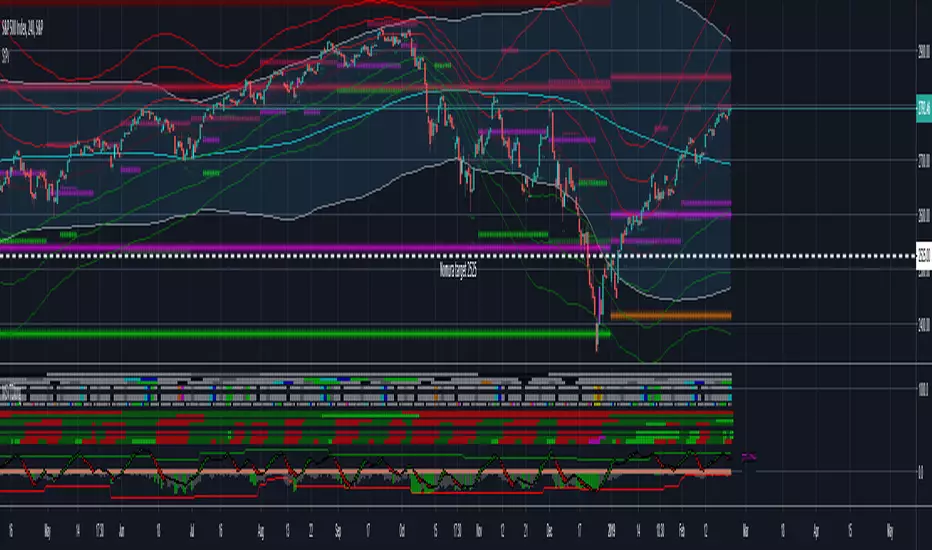
Strong Pivots + Forward looking Pivots + 1-3 std div PivotsI see this as very useful indicator for improved probability of successful entry/exits. Strong pivots are defined as yearly pivots + those of yearly, monthly and weekly pivots that form double support (not more far away then 2.5% of R2&S2 range.) The calculus is done on classical formula. I may ad other in the future. You can turn off Strong Support and show pivots of your choosing Y, M, W, D, 4h, 1h.
There is also forward looking pivot function, which means that you can estimate where the pivots will be for next year, month and week. Especially useful to use in December to check the next years yearly /strong pivots.
There are also 1-3 Standard Deviation moving pivots available. If price, classical pivots and moving pivots meet in time, this should also be indication of strong support/resistance.
If you happen to make a lot of money with this indicator or would like to have it improved farther send some contribution to 14jvBMALjnTdDjAP1ewdDp785u1nS5VVWH in Bitcoins. If I see contributions on this address I will work to add more improvements like support to cross check with different pivot formulas like Fibbonacci pivots.
Credit goes also to Lazy Bear and Chris Mood. I borrowed some of code from their work.
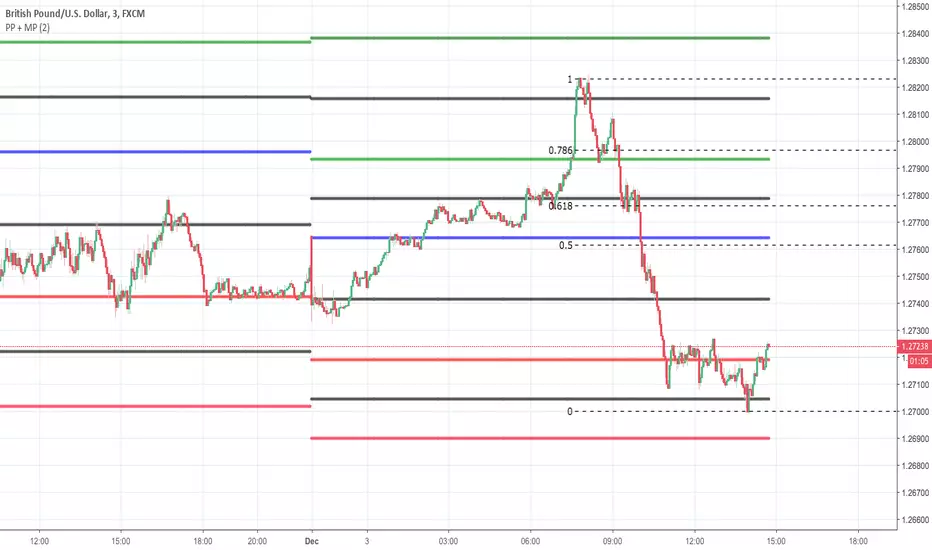
Pivot Point + MidPointsTraditional floor pivots with additional lines in between the s/r levels called Mid Points
If the Pivot Points are used as entering at s/r levels, you can use the Mid Points to scale out of a position or place Sl's behind
All PivotsYou can see all yearly, monthly, weekly and daily with this indicator automatically that they're usable for supports and resistances

Support/Resistance PivotsSupport/Resistance bars based on previous pivot points (no repainting) with added filters.
Looking at potential improvements. Updates to come.

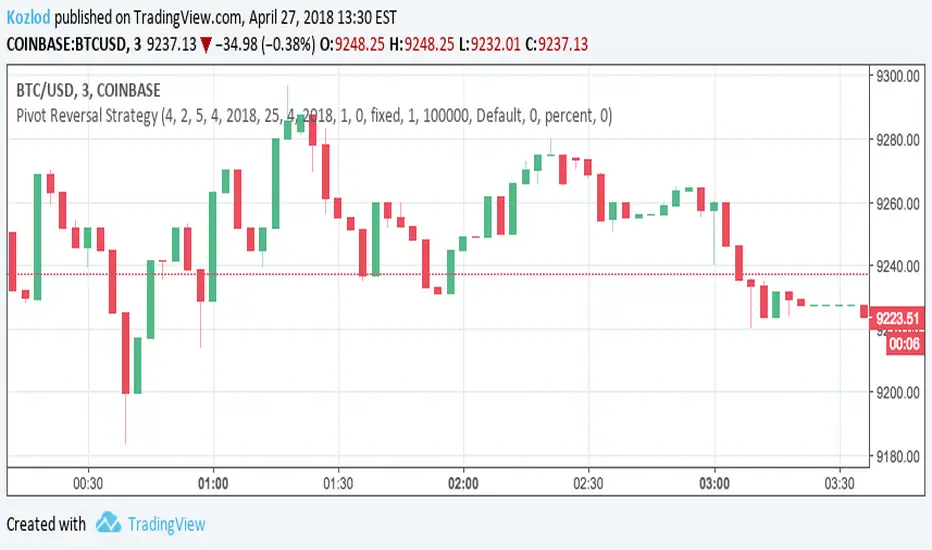
Pivot Reversal Strategy with backtest date rangeThis is standard Pivot Reversal Strategy with backtest date range added.
In parameters you can select from/to date for backtesting range.