Logging in Pine ScriptI'm building quite a lot of pretty complicated indicators/strategies in Pine Script. Quite often they don't work from the 1 try so I have to debug them heavily.
In Pine Script there are no fancy debuggers so you have to be creative. You can plot values on your screens, check them in the data window, etc.
If you want to display some textual information, you can plot some info as labels on the screen.
It's not the most convenient way, so with the appearance of tables in Pine Script, I decided to implement a custom logger that will allow me to track some useful information about my indicator over time.
Tables work much better for this kind of thing than labels. They're attached to your screen, you can nicely scale them and you can style them much better.
The idea behind it is very simple. I used few arrays to store the message, bar number, timestamp, and type of the message (you can color messages depend on the type for example).
There is a function log_msg that just append new messages to these arrays.
In the end, for the last bar, I create the table and display the last X messages in it.
In parameters, you can show/hide the entire journal, change the number of messages displayed and choose an offset. With offset, you can basically scroll through the history of messages.
Currently, I implemented 3 types of messages, and I color messages according to these types:
Message - gray
Warning - yellow
Error - red
Of course, it's a pretty simple example, you can create a much fancier way of styling your logs.
What do you think about it? Is it useful for you? What do you use to debug code in Pine Script?
Disclaimer
Please remember that past performance may not be indicative of future results.
Due to various factors, including changing market conditions, the strategy may no longer perform as good as in historical backtesting.
This post and the script don’t provide any financial advice.
Points

Percentage Or Point Bar CalculatorHello Everyone This Indicator Base on Bar (Candle)
How to work its indicator?
➤This indicator calculating Every Bar Percentage Or Point with any Time Frame For eg: if you want to 50 Percentage above or below bar
Indicator Feature
➤ Long Signal with Alert
➤ Short Signal with Alert
➤ You can add Custom Point
➤ You can add Custom Percentage
Coming soon Feature
Take Profit
Stop Lose
Trailing Stoplose
Important: This Indicator we are using for Automation Trading if You Want This Indicator Access, Please Contact me PM on Tradingview

Pocket PivotPockets Pivot were introduced by Gil Morales and Chris Katcher in the book "Trading like an O'Neil Disciple",
Pocket Pivot day occurs when the Volume has been higher than any down day 10 days prior and with a positive close.
Here is shown 5 days Pocket Pivots and 10 Days Pocket Pivots

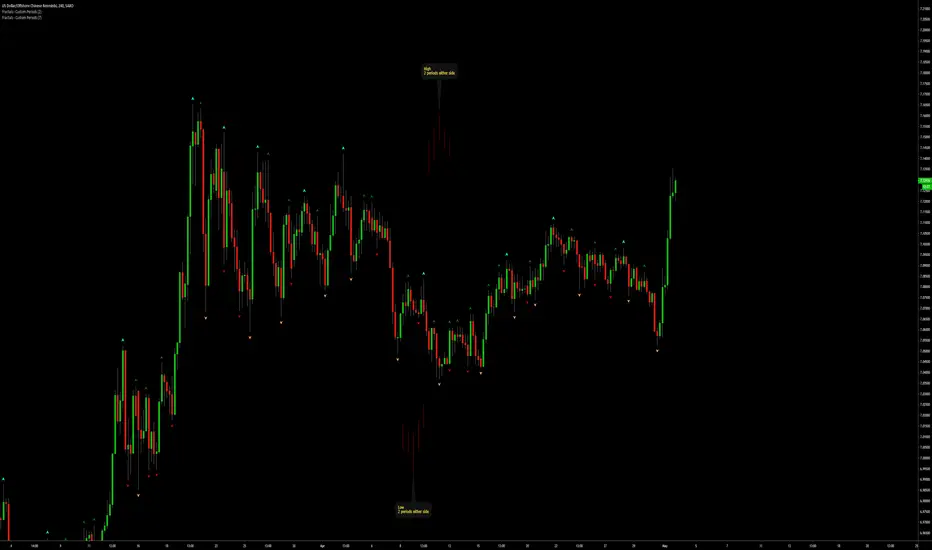
Fractals | Swing Points | Highs & Lows | Custom PeriodsSimple script which marks out key swing highs & lows.
One of the only indicators I have on the chart most days
- perfect for naked charting
- quickly helps you to visually identify key areas of interest
An extension of Bill Williams fractals
- aka short term swing points
Allows you to filter for only the most prominent swing points
- you can even overlay multiple swingpoint filters in different colours (as per example chart)
The number ( Fractal Periods) is simply:
- the number of less prominent points either side of your swing high/low
- example shown on the chart
Otherwise make a fist
- look at your 5 knuckles
- swing high is your middle knuckle
- 2 lower points either side
Bill Williams Original Fractal:
Fractal Periods = 2
Your Fractal Period for Filtering:
3, 4, 5, 30, 365, etc
Allows you to find swing points down to:
Fractal Periods = 1
Simple, easy, shared to enjoy =)

Fractals | Swing Points | Highs & Lows | Custom PeriodsSimple script which marks out key swing highs & lows.
One of the only indicators I have on the chart most days
- perfect for naked charting
- quickly helps you to visually identify key areas of interest
An extension of Bill Williams fractals
- aka short term swing points
Allows you to filter for only the most prominent swing points
- you can even overlay multiple swingpoint filters in different colours (as per example chart)
The number (Fractal Periods) is simply:
- the number of less prominent points either side of your swing high/low
- example shown on the chart
Otherwise make a fist
- look at your 5 knuckles
- swing high is your middle knuckle
- 2 lower points either side
Bill Williams Original Fractal:
Fractal Periods = 2
Your Fractal Period for Filtering:
3, 4, 5, 30, 365, etc
Simple, easy, shared to enjoy =)
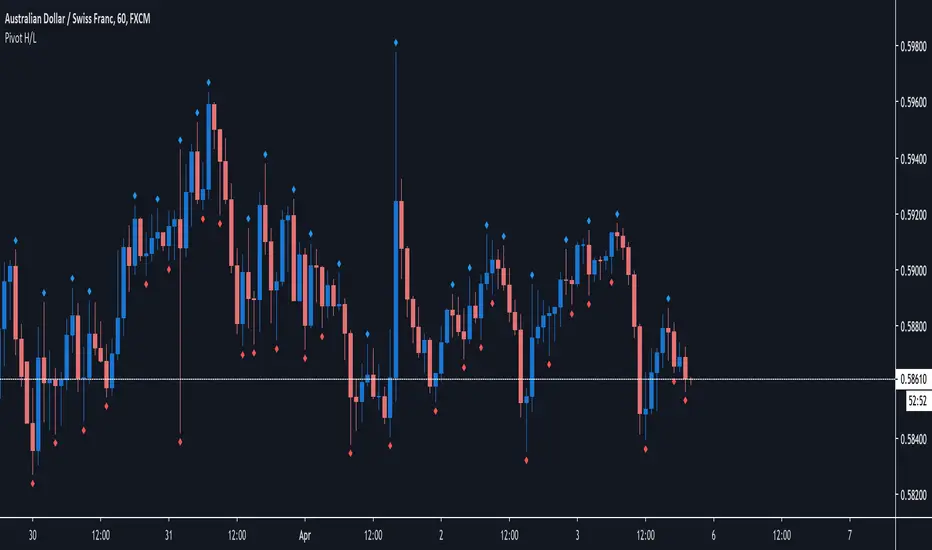
Pivot H/LPivot high low based on 3 candles. Pivot low= low->lower low->higher low. Pivot high = high->higher high> lower high.
That shows me referal points where i would like to setup stop loss.
It also shows me trend or rotation and supports and rezists.
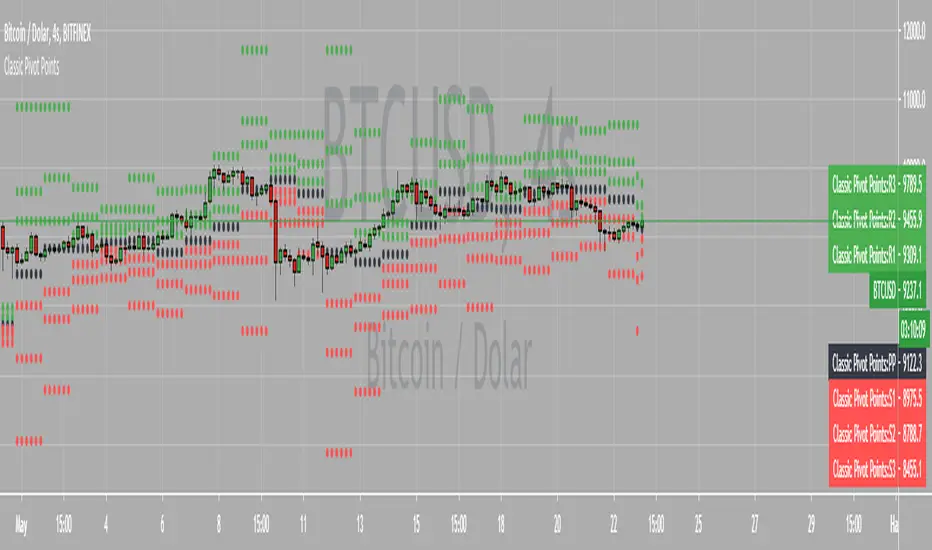
Chonky Pivot Pointsstandard pivot points re-written with circle plots.
Only shows the current pivot points. P, R1/R2, S1/S2
I don't use R3, R4 etc. so I didnt include them but feel free to modify the code.
You can change the resolution in indicator settings, default is set to Monthly.
Also to change the size of the circles all at once, you can input a number 1-4 in the inputs section.

Weekly Pivot Points with Colored Mid Pivots from HalcyonUpdated version of the Weekly Pivots Points that include mid pivot lines.
Target trading zones for the week are shaded green and red respectively. The mid pivot area is shaded aqua.
Use: buy (green) zones are buys, red zones are sells with respective color targets.

Scoring Development Sample [BigBitsIO]This script shows a sample of how to do confidence weighted scoring indicators and for loops with Pine. This indicator may or may not be found useful, it's intent is to provide a sample on how to create such an indicator and use certain Pine features.
Features:
- Defined points based on the confidence of RSI and Stochastic indicator
- Defined points based on candle color and sma trend direction
- For loops used to calculate bonus points for "extended periods" of confidence.
*** DISCLAIMER: For educational and entertainment purposes only. Nothing in this content should be interpreted as financial advice or a recommendation to buy or sell any sort of security or investment including all types of crypto. DYOR, TYOB. ***

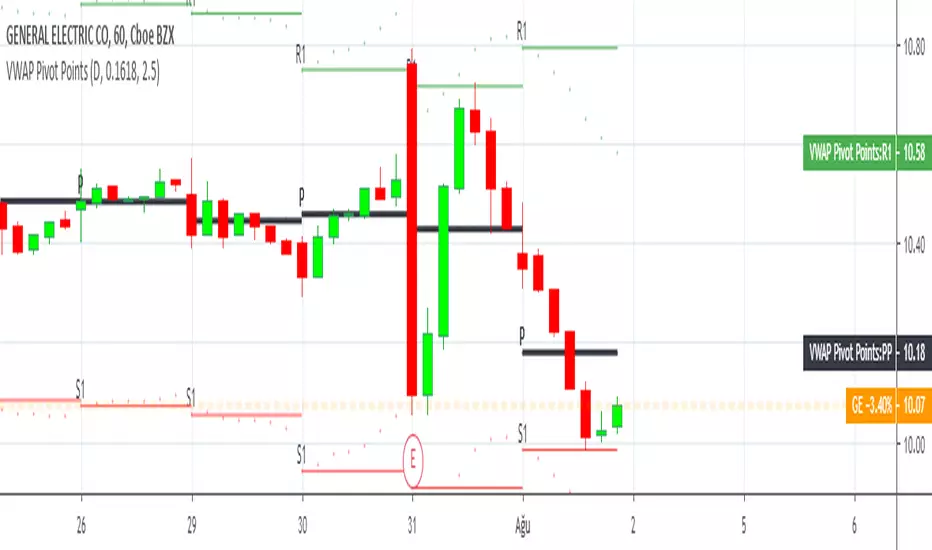
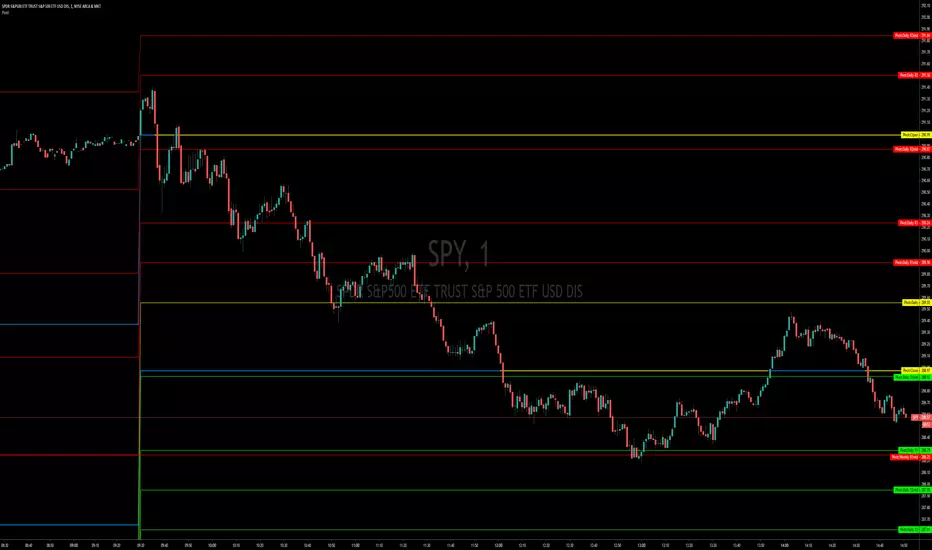
Pivot Points, Daily, Weekly, Open and Close lines What is a Pivot Point?
A pivot point is a technical analysis indicator, or calculations, used to determine the overall trend of the market over different time frames. The pivot point itself is simply the average of the high, low and closing prices from the previous trading day. On the subsequent day, trading above the pivot point is thought to indicate ongoing bullish sentiment, while trading below the pivot point indicates bearish sentiment.
The pivot point is the basis for the indicator, but it also includes other support and resistance levels that are projected based on the pivot point calculation. All these levels help traders see where the price could experience support or resistance. Similarly, if the price moves through these levels it lets the trader know the price is trending in that direction.
When the price of an asset is trading above the pivot point, it indicates the day is bullish or positive.
When the price of an asset is trading below the pivot point, it indicates the day is bearish or negative.
The indicator typically includes four additional levels: S1, S2, R1, and R2. These stand for support one and two, and resistance one and two.
Support and resistance one and two may cause reversals, but they may also be used to confirm the trend. For example, if the price is falling and moves below S1, it helps confirm the downtrend and indicate a possible continuation to S2.
This Script includes the Mid Pivot Points, Open and Close levels


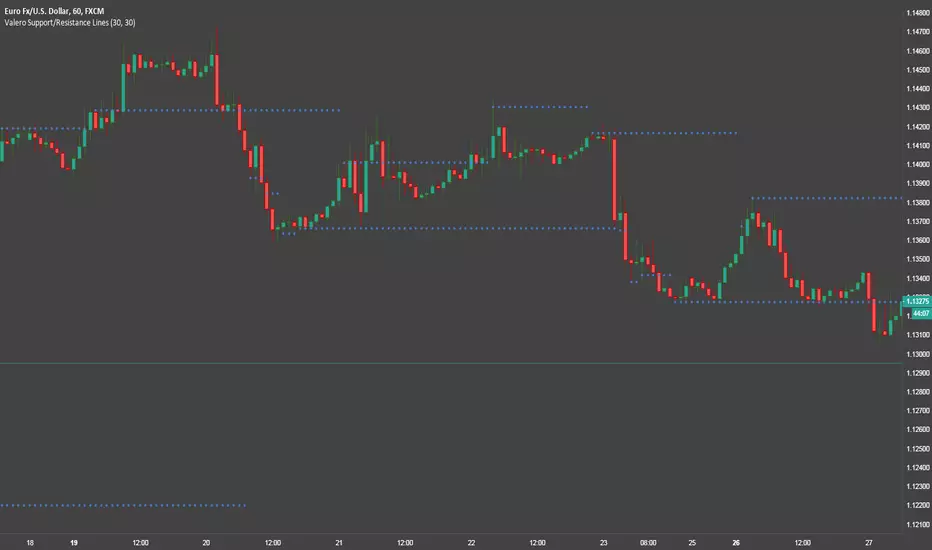
Valero Support/Resistance LinesThis is a pretty simple indicator that automatically draws Support and Resistance lines.
Pivot Points (Pine)This script is an implementation of Pivot Points in Pine that supports arbitrary session lengths.
It is both a work-in-progress and for amusement, since multiple levels of Trading View support told me parts of this would not be possible to implement in Pine.

Automatic Monthly Pivots with built-in Fibonacci LevelsClassic Floor Trader Pivots (algorithm decision points) with color segmented Fibonacci levels plotted in real-time Enjoy! Multi-variable Time Frame Pivots with Custom fib levels is in works.

Pivot Point Moving AveragesThis indicator contains two simple moving averages that is calculated from the pivot point rather than the closing price. This indicator is described in detail in chapter 6 of the book Candlestick and Pivot Point Trading Triggers: Setups for Stock, Forex, and Futures Markets by John L. Person.

ATR PointsUtile script per valutare lo stop loss con il metodo dell'ATR.
La variabile Length definisce i periodi di riferimento (default 14)
La variabile Multiplier definisce un moltiplicatore del risultato che permette di aggiustare il fattore di confidenza a secanda della propria strategia di trading. Il valore di default rappresenta l'ATR moltiplicato per 1.

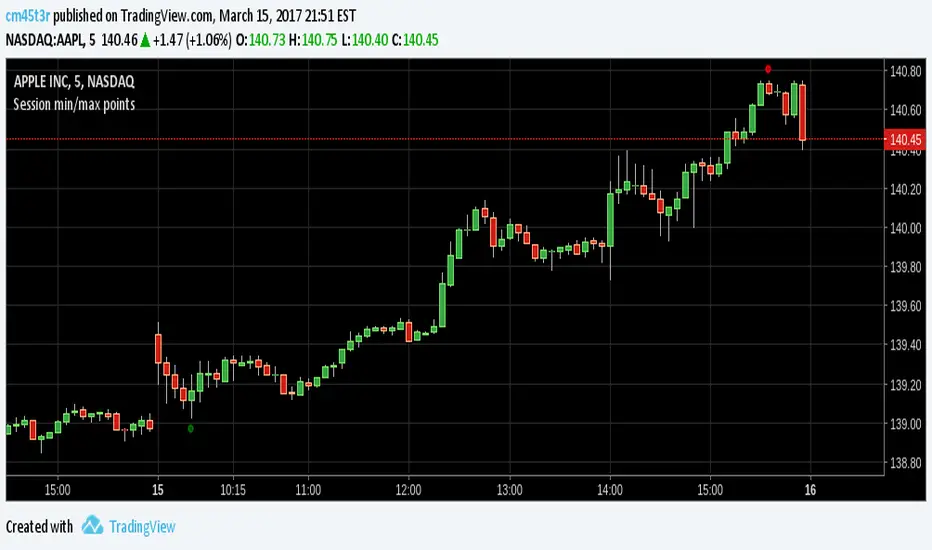
Session min/max pointsAn improved version for minimum and maximum in a day trading session. You can choose the session resolution, it ranges from 1 minute to 1 week.
It works well for stocks and non-extended sessions due to security() function limitations.
Any suggestions, please leave a comment.
Happy trading.

Session min/max pointsMinimum and maximum points in a day trading session. It may help you spot the range which min and max occur in a session.
In day trading, for example, at securities like GBPNZD, minimum happens between 02:00-05:00 ET and maximum between 08:00-14:00 ET. This indicator can help you test this hypothesis.
Happy trading!