40 Ticker Cross-Sectional Z-Scores [BackQuant]40 Ticker Cross-Sectional Z-Scores
BackQuant’s 40 Ticker Cross-Sectional Z-Scores is a powerful portfolio management strategy that analyzes the relative performance of up to 40 different assets, comparing them on a cross-sectional basis to identify the top and bottom performers. This indicator computes Z-scores for each asset based on their log returns and evaluates them relative to the mean and standard deviation over a rolling window. The Z-scores represent how far an asset's return deviates from the average, and these values are used to rank the assets, allowing for dynamic asset allocation based on performance.
By focusing on the strongest-performing assets and avoiding the weakest, this strategy aims to enhance returns while managing risk. Additionally, by adjusting for standard deviations, the system offers a risk-adjusted method of ranking assets, making it suitable for traders who want to dynamically allocate capital based on performance metrics rather than just price movements.
Key Features
1. Cross-Sectional Z-Score Calculation:
The system calculates Z-scores for 40 different assets, evaluating their log returns against the mean and standard deviation over a rolling window. This enables users to assess the relative performance of each asset dynamically, highlighting which assets are performing better or worse compared to their historical norms. The Z-score is a useful statistical tool for identifying outliers in asset performance.
2. Asset Ranking and Allocation:
The system ranks assets based on their Z-scores and allocates capital to the top performers. It identifies the top and bottom assets, and traders can allocate capital to the top-performing assets, ensuring that their portfolio is aligned with the best performers. Conversely, the bottom assets are removed from the portfolio, reducing exposure to underperforming assets.
3. Rolling Window for Mean and Standard Deviation Calculations:
The Z-scores are calculated based on rolling means and standard deviations, making the system adaptive to changing market conditions. This rolling calculation window allows the strategy to adjust to recent performance trends and minimize the impact of outdated data.
4. Mean and Standard Deviation Visualization:
The script provides real-time visualizations of the mean (x̄) and standard deviation (σ) of asset returns, helping traders quickly identify trends and volatility in their portfolio. These visual indicators are useful for understanding the current market environment and making more informed allocation decisions.
5. Top & Bottom Performer Tables:
The system generates tables that display the top and bottom performers, ranked by their Z-scores. Traders can quickly see which assets are outperforming and underperforming. These tables provide clear and actionable insights, helping traders make informed decisions about which assets to include in their portfolio.
6. Customizable Parameters:
The strategy allows traders to customize several key parameters, including:
Rolling Calculation Window: Set the window size for the rolling mean and standard deviation calculations.
Top & Bottom Tickers: Choose how many of the top and bottom assets to display and allocate capital to.
Table Orientation: Select between vertical or horizontal table formats to suit the user’s preference.
7. Forward Test & Out-of-Sample Testing:
The system includes out-of-sample forward tests, ensuring that the strategy is evaluated based on real-time performance, not just historical data. This forward testing approach helps validate the robustness of the strategy in dynamic market conditions.
8. Visual Feedback and Alerts:
The system provides visual feedback on the current asset rankings and allocations, with dynamic labels and plots on the chart. Additionally, users receive alerts when allocations change, keeping them informed of important adjustments.
9. Risk Management via Z-Scores and Std Dev:
The system’s approach to asset selection is based on Z-scores, which normalize performance relative to the historical mean. By incorporating standard deviation, it accounts for the volatility and risk associated with each asset. This allows for more precise risk management and portfolio construction.
10. Note on Mean Reversion Strategy:
If you take the inverse of the signals provided by this indicator, the strategy can be used for mean-reversion rather than trend-following. This would involve buying the underperforming assets and selling the outperforming ones. However, it's important to note that this approach does not work well with highly correlated assets, as the relationship between the assets could result in the same directional movement, undermining the effectiveness of the mean-reversion strategy.
References
www.uts.edu.au
onlinelibrary.wiley.com
www.cmegroup.com
Final Thoughts
The 40 Ticker Cross-Sectional Z-Scores strategy offers a data-driven approach to portfolio management, dynamically allocating capital based on the relative performance of assets. By using Z-scores and standard deviations, this strategy ensures that capital is directed to the strongest performers while avoiding weaker assets, ultimately improving the risk-adjusted returns of the portfolio. Whether you’re focused on trend-following or looking to explore mean-reversion strategies, this flexible system can be tailored to suit your investment goals.
Portfolio

Cross-Sectional Altcoin Portfolio [BackQuant]Cross-Sectional Altcoin Portfolio
Introducing BackQuant's Cross-Sectional Altcoin Portfolio, a sophisticated trading system designed to dynamically rotate among a selection of major altcoins. This portfolio strategy compares multiple assets based on real-time performance metrics, such as momentum and trend strength, to select the strongest-performing coins. It uses a combination of adaptive scoring and regime filters to ensure the portfolio is aligned with favorable market conditions, minimizing exposure during unfavorable trends.
This system offers a comprehensive solution for crypto traders who want to optimize portfolio allocation based on cross-asset performance, while also accounting for market regimes. It allows traders to compare multiple altcoins dynamically and allocate capital to the top performers, ensuring the portfolio is always positioned in the most promising assets.
Key Features
1. Dynamic Asset Rotation:
The portfolio constantly evaluates the relative strength of 10 major altcoins: SOLUSD, RUNEUSD, ORDIUSD, DOGEUSDT, ETHUSD, ENAUSDT, RAYUSDT, PENDLEUSD, UNIUSD, and KASUSDT.
Using a ratio matrix, the system selects the strongest asset based on momentum and trend performance, dynamically adjusting the allocation as market conditions change.
2. Long-Only Portfolio with Cash Reserve:
The portfolio only takes long positions or remains in cash. The system does not enter short positions, reducing the risk of exposure during market downturns.
A powerful regime filter ensures the system is inactive during periods of market weakness, defined by the Universal Trend Performance Indicator (TPI) and other market data.
3. Equity Tracking:
The script provides real-time visualizations of portfolio equity compared to buy-and-hold strategies.
Users can compare the performance of the portfolio against holding individual assets (e.g., BTC, ETH) and see the benefits of the dynamic allocation.
4. Performance Metrics:
The system provides key performance metrics such as:
Sharpe Ratio: Measures risk-adjusted returns.
Sortino Ratio: Focuses on downside risk.
Omega Ratio: Evaluates returns relative to risk.
Maximum Drawdown: The maximum observed loss from a peak to a trough.
These metrics allow traders to assess the effectiveness of the strategy versus simply holding the assets.
5. Regime Filter:
The system incorporates a regime filter that evaluates the overall market trend using the TPI and other indicators. If the market is in a downtrend, the system exits positions and moves to cash, avoiding exposure to negative market conditions.
Users can customize the thresholds for the long and short trends to fit their risk tolerance.
6. Customizable Parameters:
Traders can adjust key parameters, such as the backtest start date, starting capital, leverage multiplier, and visualization options, including equity plot colors and line widths.
The system supports different levels of customizations for traders to optimize their strategies.
7. Equity and Buy-and-Hold Comparisons:
This script enables traders to see the side-by-side comparison of the portfolio’s equity curve and the equity curve of a buy-and-hold strategy for each asset.
The comparison allows users to evaluate the performance of the dynamic strategy versus holding the altcoins in isolation.
8. Forward Test (Out-of-Sample Testing):
The system includes a note that the portfolio provides out-of-sample forward tests, ensuring the robustness of the strategy. This is crucial for assessing the portfolio's performance beyond historical backtesting and validating its ability to adapt to future market conditions.
9. Visual Feedback:
The system offers detailed visual feedback on the current asset allocation and performance. Candles are painted according to the trend of the selected assets, and key metrics are displayed in real-time, including the momentum scores for each asset.
10. Alerts and Notifications:
Real-time alerts notify traders when the system changes asset allocations or moves to cash, ensuring they stay informed about portfolio adjustments.
Visual labels on the chart provide instant feedback on which asset is currently leading the portfolio allocation.
How the Rotation Works
The portfolio evaluates 10 different assets and calculates a momentum score for each based on their price action. This score is processed through a ratio matrix, which compares the relative performance of each asset.
Based on the rankings, the portfolio allocates capital to the top performers, ensuring it rotates between the strongest assets while minimizing exposure to underperforming assets.
If no asset shows strong performance, the system defaults to cash to preserve capital.
Final Thoughts
BackQuant’s Cross-Sectional Altcoin Portfolio provides a dynamic and systematic approach to altcoin portfolio management. By employing real-time performance metrics, adaptive scoring, and regime filters, this strategy aims to optimize returns while minimizing exposure to market downturns. The inclusion of out-of-sample forward tests ensures that the system remains robust in live market conditions, making it an ideal tool for crypto traders seeking to enhance their portfolio's performance with a data-driven, momentum-based approach.

Performance Metrics With Bracketed Rebalacing [BackQuant]Performance Metrics With Bracketed Rebalancing
The Performance Metrics With Bracketed Rebalancing script offers a robust method for assessing portfolio performance, integrating advanced portfolio metrics with different rebalancing strategies. With a focus on adaptability, the script allows traders to monitor and adjust portfolio weights, equity, and other key financial metrics dynamically. This script provides a versatile approach for evaluating different trading strategies, considering factors like risk-adjusted returns, volatility, and the impact of portfolio rebalancing.
Please take the time to read the following:
Key Features and Benefits of Portfolio Methods
Bracketed Rebalancing:
Bracketed Rebalancing is an advanced strategy designed to trigger portfolio adjustments when an asset's weight surpasses a predefined threshold. This approach minimizes overexposure to any single asset while maintaining flexibility in response to market changes. The strategy is particularly beneficial for mitigating risks that arise from significant asset weight fluctuations. The following image illustrates how this method reacts when asset weights cross the threshold:
Daily Rebalancing:
Unlike the bracketed method, Daily Rebalancing adjusts portfolio weights every trading day, ensuring consistent asset allocation. This method aims for a more even distribution of portfolio weights, making it a suitable option for traders who prefer less sensitivity to individual asset volatility. Here's an example of Daily Rebalancing in action:
No Rebalancing:
For traders who prefer a passive approach, the "No Rebalancing" option allows the portfolio to remain static, without any adjustments to asset weights. This method may appeal to long-term investors or those who believe in the inherent stability of their selected assets. Here’s how the portfolio looks when no rebalancing is applied:
Portfolio Weights Visualization:
One of the standout features of this script is the visual representation of portfolio weights. With adjustable settings, users can track the current allocation of assets in real-time, making it easier to analyze shifts and trends. The following image shows the real-time weight distribution across three assets:
Rolling Drawdown Plot:
Managing drawdown risk is a critical aspect of portfolio management. The Rolling Drawdown Plot visually tracks the drawdown over time, helping traders monitor the risk exposure and performance relative to the peak equity levels. This feature is essential for assessing the portfolio's resilience during market downturns:
Daily Portfolio Returns:
Tracking daily returns is crucial for evaluating the short-term performance of the portfolio. The script allows users to plot daily portfolio returns to gain insights into daily profit or loss, helping traders stay updated on their portfolio’s progress:
Performance Metrics
Net Profit (%):
This metric represents the total return on investment as a percentage of the initial capital. A positive net profit indicates that the portfolio has gained value over the evaluation period, while a negative value suggests a loss. It's a fundamental indicator of overall portfolio performance.
Maximum Drawdown (Max DD):
Maximum Drawdown measures the largest peak-to-trough decline in portfolio value during a specified period. It quantifies the most significant loss an investor would have experienced if they had invested at the highest point and sold at the lowest point within the timeframe. A smaller Max DD indicates better risk management and less exposure to significant losses.
Annual Mean Returns (% p/y):
This metric calculates the average annual return of the portfolio over the evaluation period. It provides insight into the portfolio's ability to generate returns on an annual basis, aiding in performance comparison with other investment opportunities.
Annual Standard Deviation of Returns (% p/y):
This measure indicates the volatility of the portfolio's returns on an annual basis. A higher standard deviation signifies greater variability in returns, implying higher risk, while a lower value suggests more stable returns.
Variance:
Variance is the square of the standard deviation and provides a measure of the dispersion of returns. It helps in understanding the degree of risk associated with the portfolio's returns.
Sortino Ratio:
The Sortino Ratio is a variation of the Sharpe Ratio that only considers downside risk, focusing on negative volatility. It is calculated as the difference between the portfolio's return and the minimum acceptable return (MAR), divided by the downside deviation. A higher Sortino Ratio indicates better risk-adjusted performance, emphasizing the importance of avoiding negative returns.
Sharpe Ratio:
The Sharpe Ratio measures the portfolio's excess return per unit of total risk, as represented by standard deviation. It is calculated by subtracting the risk-free rate from the portfolio's return and dividing by the standard deviation of the portfolio's excess return. A higher Sharpe Ratio indicates more favorable risk-adjusted returns.
Omega Ratio:
The Omega Ratio evaluates the probability of achieving returns above a certain threshold relative to the probability of experiencing returns below that threshold. It is calculated by dividing the cumulative probability of positive returns by the cumulative probability of negative returns. An Omega Ratio greater than 1 indicates a higher likelihood of achieving favorable returns.
Gain-to-Pain Ratio:
The Gain-to-Pain Ratio measures the return per unit of risk, focusing on the magnitude of gains relative to the severity of losses. It is calculated by dividing the total gains by the total losses experienced during the evaluation period. A higher ratio suggests a more favorable balance between reward and risk.
www.linkedin.com
Compound Annual Growth Rate (CAGR) (% p/y):
CAGR represents the mean annual growth rate of the portfolio over a specified period, assuming the investment has been compounding over that time. It provides a smoothed annual rate of growth, eliminating the effects of volatility and offering a clearer picture of long-term performance.
Portfolio Alpha (% p/y):
Portfolio Alpha measures the portfolio's performance relative to a benchmark index, adjusting for risk. It is calculated using the Capital Asset Pricing Model (CAPM) and represents the excess return of the portfolio over the expected return based on its beta and the benchmark's performance. A positive alpha indicates outperformance, while a negative alpha suggests underperformance.
Portfolio Beta:
Portfolio Beta assesses the portfolio's sensitivity to market movements, indicating its exposure to systematic risk. A beta greater than 1 suggests the portfolio is more volatile than the market, while a beta less than 1 indicates lower volatility. Beta is used to understand the portfolio's potential for gains or losses in relation to market fluctuations.
Skewness of Returns:
Skewness measures the asymmetry of the return distribution. A positive skew indicates a distribution with a long right tail, suggesting more frequent small losses and fewer large gains. A negative skew indicates a long left tail, implying more frequent small gains and fewer large losses. Understanding skewness helps in assessing the likelihood of extreme outcomes.
Value at Risk (VaR) 95th Percentile:
VaR at the 95th percentile estimates the maximum potential loss over a specified period, given a 95% confidence level. It provides a threshold value such that there is a 95% probability that the portfolio will not experience a loss greater than this amount.
Conditional Value at Risk (CVaR):
CVaR, also known as Expected Shortfall, measures the average loss exceeding the VaR threshold. It provides insight into the tail risk of the portfolio, indicating the expected loss in the worst-case scenarios beyond the VaR level.
These metrics collectively offer a comprehensive view of the portfolio's performance, risk exposure, and efficiency. By analyzing these indicators, investors can make informed decisions, balancing potential returns with acceptable levels of risk.
Conclusion
The Performance Metrics With Bracketed Rebalancing script provides a comprehensive framework for evaluating and optimizing portfolio performance. By integrating advanced metrics, adaptive rebalancing strategies, and visual analytics, it empowers traders to make informed decisions in managing their investment portfolios. However, it's crucial to consider the implications of rebalancing strategies, as academic research indicates that predictable rebalancing can lead to market impact costs. Therefore, adopting flexible and less predictable rebalancing approaches may enhance portfolio performance and reduce associated costs.

DCA Investment Tracker Pro [tradeviZion]DCA Investment Tracker Pro: Educational DCA Analysis Tool
An educational indicator that helps analyze Dollar-Cost Averaging strategies by comparing actual performance with historical data calculations.
---
💡 Why I Created This Indicator
As someone who practices Dollar-Cost Averaging, I was frustrated with constantly switching between spreadsheets, calculators, and charts just to understand how my investments were really performing. I wanted to see everything in one place - my actual performance, what I should expect based on historical data, and most importantly, visualize where my strategy could take me over the long term .
What really motivated me was watching friends and family underestimate the incredible power of consistent investing. When Napoleon Bonaparte first learned about compound interest, he reportedly exclaimed "I wonder it has not swallowed the world" - and he was right! Yet most people can't visualize how their $500 monthly contributions today could become substantial wealth decades later.
Traditional DCA tracking tools exist, but they share similar limitations:
Require manual data entry and complex spreadsheets
Use fixed assumptions that don't reflect real market behavior
Can't show future projections overlaid on actual price charts
Lose the visual context of what's happening in the market
Make compound growth feel abstract rather than tangible
I wanted to create something different - a tool that automatically analyzes real market history, detects volatility periods, and shows you both current performance AND educational projections based on historical patterns right on your TradingView charts. As Warren Buffett said: "Someone's sitting in the shade today because someone planted a tree a long time ago." This tool helps you visualize your financial tree growing over time.
This isn't just another calculator - it's a visualization tool that makes the magic of compound growth impossible to ignore.
---
🎯 What This Indicator Does
This educational indicator provides DCA analysis tools. Users can input investment scenarios to study:
Theoretical Performance: Educational calculations based on historical return data
Comparative Analysis: Study differences between actual and theoretical scenarios
Historical Projections: Theoretical projections for educational analysis (not predictions)
Performance Metrics: CAGR, ROI, and other analytical metrics for study
Historical Analysis: Calculates historical return data for reference purposes
---
🚀 Key Features
Volatility-Adjusted Historical Return Calculation
Analyzes 3-20 years of actual price data for any symbol
Automatically detects high-volatility stocks (meme stocks, growth stocks)
Uses median returns for volatile stocks, standard CAGR for stable stocks
Provides conservative estimates when extreme outlier years are detected
Smart fallback to manual percentages when data insufficient
Customizable Performance Dashboard
Educational DCA performance analysis with compound growth calculations
Customizable table sizing (Tiny to Huge text options)
9 positioning options (Top/Middle/Bottom + Left/Center/Right)
Theme-adaptive colors (automatically adjusts to dark/light mode)
Multiple display layout options
Future Projection System
Visual future growth projections
Timeframe-aware calculations (Daily/Weekly/Monthly charts)
1-30 year projection options
Shows projected portfolio value and total investment amounts
Investment Insights
Performance vs benchmark comparison
ROI from initial investment tracking
Monthly average return analysis
Investment milestone alerts (25%, 50%, 100% gains)
Contribution tracking and next milestone indicators
---
📊 Step-by-Step Setup Guide
1. Investment Settings 💰
Initial Investment: Enter your starting lump sum (e.g., $60,000)
Monthly Contribution: Set your regular DCA amount (e.g., $500/month)
Return Calculation: Choose "Auto (Stock History)" for real data or "Manual" for fixed %
Historical Period: Select 3-20 years for auto calculations (default: 10 years)
Start Year: When you began investing (e.g., 2020)
Current Portfolio Value: Your actual portfolio worth today (e.g., $150,000)
2. Display Settings 📊
Table Sizes: Choose from Tiny, Small, Normal, Large, or Huge
Table Positions: 9 options - Top/Middle/Bottom + Left/Center/Right
Visibility Toggles: Show/hide Main Table and Stats Table independently
3. Future Projection 🔮
Enable Projections: Toggle on to see future growth visualization
Projection Years: Set 1-30 years ahead for analysis
Live Example - NASDAQ:META Analysis:
Settings shown: $60K initial + $500/month + Auto calculation + 10-year history + 2020 start + $150K current value
---
🔬 Pine Script Code Examples
Core DCA Calculations:
// Calculate total invested over time
months_elapsed = (year - start_year) * 12 + month - 1
total_invested = initial_investment + (monthly_contribution * months_elapsed)
// Compound growth formula for initial investment
theoretical_initial_growth = initial_investment * math.pow(1 + annual_return, years_elapsed)
// Future Value of Annuity for monthly contributions
monthly_rate = annual_return / 12
fv_contributions = monthly_contribution * ((math.pow(1 + monthly_rate, months_elapsed) - 1) / monthly_rate)
// Total expected value
theoretical_total = theoretical_initial_growth + fv_contributions
Volatility Detection Logic:
// Detect extreme years for volatility adjustment
extreme_years = 0
for i = 1 to historical_years
yearly_return = ((price_current / price_i_years_ago) - 1) * 100
if yearly_return > 100 or yearly_return < -50
extreme_years += 1
// Use median approach for high volatility stocks
high_volatility = (extreme_years / historical_years) > 0.2
calculated_return = high_volatility ? median_of_returns : standard_cagr
Performance Metrics:
// Calculate key performance indicators
absolute_gain = actual_value - total_invested
total_return_pct = (absolute_gain / total_invested) * 100
roi_initial = ((actual_value - initial_investment) / initial_investment) * 100
cagr = (math.pow(actual_value / initial_investment, 1 / years_elapsed) - 1) * 100
---
📊 Real-World Examples
See the indicator in action across different investment types:
Stable Index Investments:
AMEX:SPY (SPDR S&P 500) - Shows steady compound growth with standard CAGR calculations
Classic DCA success story: $60K initial + $500/month starting 2020. The indicator shows SPY's historical 10%+ returns, demonstrating how consistent broad market investing builds wealth over time. Notice the smooth theoretical growth line vs actual performance tracking.
MIL:VUAA (Vanguard S&P 500 UCITS) - Shows both data limitation and solution approaches
Data limitation example: VUAA shows "Manual (Auto Failed)" and "No Data" when default 10-year historical setting exceeds available data. The indicator gracefully falls back to manual percentage input while maintaining all DCA calculations and projections.
MIL:VUAA (Vanguard S&P 500 UCITS) - European ETF with successful 5-year auto calculation
Solution demonstration: By adjusting historical period to 5 years (matching available data), VUAA auto calculation works perfectly. Shows how users can optimize settings for newer assets. European market exposure with EUR denomination, demonstrating DCA effectiveness across different markets and currencies.
NYSE:BRK.B (Berkshire Hathaway) - Quality value investment with Warren Buffett's proven track record
Value investing approach: Berkshire Hathaway's legendary performance through DCA lens. The indicator demonstrates how quality companies compound wealth over decades. Lower volatility than tech stocks = standard CAGR calculations used.
High-Volatility Growth Stocks:
NASDAQ:NVDA (NVIDIA Corporation) - Demonstrates volatility-adjusted calculations for extreme price swings
High-volatility example: NVIDIA's explosive AI boom creates extreme years that trigger volatility detection. The indicator automatically switches to "Median (High Vol): 50%" calculations for conservative projections, protecting against unrealistic future estimates based on outlier performance periods.
NASDAQ:TSLA (Tesla) - Shows how 10-year analysis can stabilize volatile tech stocks
Stable long-term growth: Despite Tesla's reputation for volatility, the 10-year historical analysis (34.8% CAGR) shows consistent enough performance that volatility detection doesn't trigger. Demonstrates how longer timeframes can smooth out extreme periods for more reliable projections.
NASDAQ:META (Meta Platforms) - Shows stable tech stock analysis using standard CAGR calculations
Tech stock with stable growth: Despite being a tech stock and experiencing the 2022 crash, META's 10-year history shows consistent enough performance (23.98% CAGR) that volatility detection doesn't trigger. The indicator uses standard CAGR calculations, demonstrating how not all tech stocks require conservative median adjustments.
Notice how the indicator automatically detects high-volatility periods and switches to median-based calculations for more conservative projections, while stable investments use standard CAGR methods.
---
📈 Performance Metrics Explained
Current Portfolio Value: Your actual investment worth today
Expected Value: What you should have based on historical returns (Auto) or your target return (Manual)
Total Invested: Your actual money invested (initial + all monthly contributions)
Total Gains/Loss: Absolute dollar difference between current value and total invested
Total Return %: Percentage gain/loss on your total invested amount
ROI from Initial Investment: How your starting lump sum has performed
CAGR: Compound Annual Growth Rate of your initial investment (Note: This shows initial investment performance, not full DCA strategy)
vs Benchmark: How you're performing compared to the expected returns
---
⚠️ Important Notes & Limitations
Data Requirements: Auto mode requires sufficient historical data (minimum 3 years recommended)
CAGR Limitation: CAGR calculation is based on initial investment growth only, not the complete DCA strategy
Projection Accuracy: Future projections are theoretical and based on historical returns - actual results may vary
Timeframe Support: Works ONLY on Daily (1D), Weekly (1W), and Monthly (1M) charts - no other timeframes supported
Update Frequency: Update "Current Portfolio Value" regularly for accurate tracking
---
📚 Educational Use & Disclaimer
This analysis tool can be applied to various stock and ETF charts for educational study of DCA mathematical concepts and historical performance patterns.
Study Examples: Can be used with symbols like AMEX:SPY , NASDAQ:QQQ , AMEX:VTI , NASDAQ:AAPL , NASDAQ:MSFT , NASDAQ:GOOGL , NASDAQ:AMZN , NASDAQ:TSLA , NASDAQ:NVDA for learning purposes.
EDUCATIONAL DISCLAIMER: This indicator is a study tool for analyzing Dollar-Cost Averaging strategies. It does not provide investment advice, trading signals, or guarantees. All calculations are theoretical examples for educational purposes only. Past performance does not predict future results. Users should conduct their own research and consult qualified financial professionals before making any investment decisions.
---
© 2025 TradeVizion. All rights reserved.

Correlation MA – 15 Assets + Average (Optional)This indicator calculates the moving average of the correlation coefficient between your charted asset and up to 15 user-selected symbols. It helps identify uncorrelated or inversely correlated assets for diversification, pair trading, or hedging.
Features:
✅ Compare your current chart against up to 15 assets
✅ Toggle assets on/off individually
✅ Custom correlation and MA lengths
✅ Real-time average correlation line across enabled assets
✅ Horizontal lines at +1, 0, and -1 for easy visual reference
Ideal for:
Portfolio diversification analysis
Finding low-correlation stocks
Mean-reversion & pair trading setups
Crypto, equities, ETFs
To use: set the benchmark chart (e.g. TSLA), choose up to 15 assets, and adjust settings as needed. Look for assets with correlation near 0 or negative values for uncorrelated performance.

Risk Calculator PRO — manual lot size + auto lot-suggestionWhy risk management?
90 % of traders blow up because they size positions emotionally. This tool forces Risk-First Thinking: choose the amount you’re willing to lose, and the script reverse-engineers everything else.
Key features
1. Manual or Market Entry – click “Use current price” or type a custom entry.
2. Setup-based ₹-Risk – four presets (A/B/C/D). Edit to your workflow.
3. Lot-Size Input + Auto Lot Suggestion – you tell the contract size ⇒ script tells you how many lots.
4. Auto-SL (optional) – tick to push stop-loss to exactly 1-lot risk.
5. Instant Targets – 1 : 2, 1 : 3, 1 : 4, 1 : 5 plotted and alert-ready.
6. P&L Preview – table shows potential profit at each R-multiple plus real ₹ at SL.
7. Margin Column – enter per-lot margin once; script totals it for any size.
8. Clean Table UI – dark/light friendly; updates every 5 bars.
9. Alert Pack – SL, each target, plus copy-paste journal line on the chart.
How to use
1. Add to chart > “Format”.
2. Type the lot size for the symbol (e.g., 1250 for Natural Gas, 1 for cash equity).
3. Pick Side (Buy / Sell) & Setup grade.
4. ✅ If you want the script to place SL for you, tick Auto-SL (risk = 1 lot).
5. Otherwise type your own Stop-loss.
6. Read the table:
• Suggested lots = how many to trade so risk ≤ setup ₹.
• Risk (currency) = real money lost if SL hits.
7. Set TradingView alerts on the built-in conditions (T1_2, SL_hit, etc.) if you’d like push / email.
8. Copy the orange CSV label to Excel / Sheets for journalling.
Best practices
• Never raise risk to “fit” a trade. Lower size instead.
• Review win-rate vs. R multiple monthly; adjust setups A–D accordingly.
• Test Auto-SL in replay before going live.
Disclaimer
This script is educational. Past performance ≠ future results. The author isn’t responsible for trading losses.

PORTFOLIO TABLE Full [Titans_Invest]PORTFOLIO TABLE Full
This is a complete table for monitoring your assets or cryptocurrencies in your SPOT wallet without needing to access your broker’s website or app.
⯁ HOW TO USE THIS TABLE❓
Simply select the asset and enter the amount you hold.
The table will display the value of each asset and the total value of your portfolio.
You can monitor up to 19 assets in real time.
⯁ CONVERT VALUES
You can also enable and select a currency for conversion.
For example, cryptocurrencies are calculated in US dollars by default, but you can choose euros as the conversion currency.
The values originally in dollars will then be displayed in euros.
⯁ TRACK THE DAILY VARIATION OF YOUR PORTFOLIO
You’ll be able to monitor your portfolio’s raw daily variation in real time.
🔶 Track your Portfolio in real time:
🔶 Add your local Currency to Convert Values:
🔶 Follow your Portfolio Live:
___________________________________________________________
📜 SCRIPT : PORTFOLIO TABLE Full
🎴 Art by : @Titans_Invest & @DiFlip
👨💻 Dev by : @Titans_Invest & @DiFlip
🎑 Titans Invest — The Wizards Without Gloves 🧤
✨ Enjoy!
___________________________________________________________
o Mission 🗺
• Inspire Traders to manifest Magic in the Market.
o Vision 𐓏
• To elevate collective Energy 𐓷𐓏

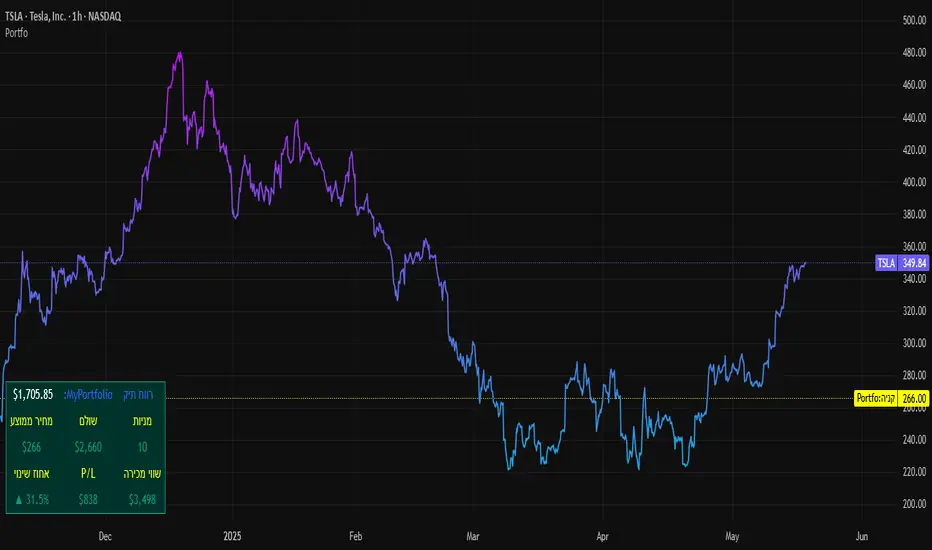
SBC ProtfoSBC Portfo PNL Indicator
Description
The SBC Portfo PNL Indicator is a user-friendly tool designed for Hebrew-speaking traders to track the Profit and Loss (PNL) of their stock portfolios on TradingView charts. It supports up to 5 distinct portfolios, each capable of holding an unlimited number of stocks with unlimited buy commands, allowing real-time monitoring of portfolio performance.
Key Features
- Multi-Portfolio Support: Track up to 5 separate portfolios for different trading strategies or accounts.
- Unlimited Stock Entries: Add unlimited stocks and buy commands per portfolio.
- Detailed Buy Commands: Input for each stock:
- Stock Ticker (e.g., AAPL, TSLA).
- Buy Price (e.g., 150.25).
- Buy Amount (e.g., 10).
- Hebrew-Friendly Interface: Intuitive settings dialog with clear instructions in Hebrew.
- Customizable PNL Tracking: Visualize PNL on charts with real-time updates based on market data.
How to Use
1. Add the Indicator:
- Go to the Indicators menu in TradingView and add the "SBC Portfo" PNL Indicator.
2. Configure Portfolios:
- Open the indicator’s settings dialog.
- For each portfolio (up to 5), enter data in the provided input fields using this format:
PortfolioName:StockTicker:BuyPricexBuyAmount;StockTicker:BuyPricexBuyAmount
Example:
Portfolio1:AAPL:150.25x10;TSLA:266.72x5
- This represents a portfolio named "Portfolio1" with:
- 10 shares of AAPL bought at $150.25.
- 5 shares of TSLA bought at $266.72.
- Repeat for additional portfolios (e.g., Portfolio2, Portfolio3).
- Add multiple buy commands for the same stock if needed (e.g., AAPL:160.50x20).
3. Apply Settings:
- Save settings to display PNL based on current market prices.
4. Monitor PNL:
- View PNL for each portfolio on the chart via tables, labels, or graphical overlays (based on settings).
Input Format
Enter portfolio data manually in the settings dialog, one input field per portfolio:
PortfolioName:StockTicker:BuyPricexBuyAmount;StockTicker:BuyPricexBuyAmount
- PortfolioName: Unique name (e.g., Portfolio1, Growth).
- StockTicker: Stock symbol (e.g., AAPL).
- BuyPrice: Purchase price per share (e.g., 150.25).
- BuyAmount: Number of shares (e.g., 10).
- Use
: to separate portfolio name, ticker, and buy data
x to separate price and amount
; for multiple stocks in the portfolio
Example:
- Portfolio 1: GrowthPortfolio:AAPL:150.25x10;TSLA:266.72x5
- Portfolio 2: DividendPortfolio:KO:55.20x50;PG:145.30x30
Notes
- Hebrew Support: Settings and labels are optimized for Hebrew users.
- Manual Input: Enter portfolio data manually in the settings dialog using the correct format.
- Compatibility: Works with any stock ticker supported by TradingView.
תיאור אינדיקטור SBC Portfo PNL הוא כלי ידידותי למשתמש שתוכנן במיוחד עבור סוחרים דוברי עברית למעקב אחר רווח והפסד (PNL) של תיקי המניות שלהם ישירות בגרפים של TradingView. הוא תומך בעד 5 תיקים נפרדים, כאשר כל תיק יכול להכיל מספר בלתי מוגבל של מניות עם פקודות קנייה בלתי מוגבלות, ומאפשר מעקב בזמן אמת אחר ביצועי התיק.
תכונות עיקריות
- תמיכה בריבוי תיקים: מעקב אחר עד 5 תיקים נפרדים עבור אסטרטגיות מסחר או חשבונות שונים.
- רישום מניות ללא הגבלה: הוספת מספר בלתי מוגבל של מניות ופקודות קנייה לכל תיק.
- פקודות קנייה מפורטות: הזנת נתונים עבור כל מניה:
- סימול המניה (למשל, AAPL, TSLA).
- מחיר קנייה (למשל, 150.25).
- כמות קנייה (למשל, 10).
- ממשק ידידותי לעברית: חלונית הגדרות אינטואיטיבית עם הוראות ברורות בעברית.
- מעקב PNL הניתן להתאמה: הצגת רווח והפסד בגרפים עם עדכונים בזמן אמת בהתבסס על נתוני השוק.
כיצד להשתמש
1. הוספת האינדיקטור:
- נווט לתפריט האינדיקטורים ב-TradingView והוסף את "SBC Portfo PNL Indicator".
2. הגדרת תיקים:
- פתח את חלונית ההגדרות של האינדיקטור.
- עבור כל תיק (עד 5), הזן נתונים בשדות המסופקים בפורמט הבא:
PortfolioName:StockTicker:BuyPricexBuyAmount;StockTicker:BuyPricexBuyAmount
לדוגמה:
Portfolio1:AAPL:150.25x10;TSLA:266.72x5
שורה זו מייצגת תיק בשם "Portfolio1" עם:
- 10 מניות של AAPL שנקנו ב-$150.25.
- 5 מניות של TSLA שנקנו ב-$266.72.
- חזור על התהליך עבור תיקים נוספים (למשל, Portfolio2, Portfolio3).
- ניתן להוסיף פקודות קנייה מרובות לאותה מניה לפי הצורך (למשל, AAPL:160.50x20).
3. החלת ההגדרות:
- שמור את ההגדרות להצגת ה-PNL בהתבסס על מחירי השוק הנוכחיים.
4. מעקב אחר PNL:
- צפה ב-PNL עבור כל תיק בגרף באמצעות טבלאות, תוויות או שכבות גרפיות (בהתאם להגדרות).
פורמט קלט הזן נתוני תיק ידנית בחלונית ההגדרות, שדה קלט אחד לכל תיק: PortfolioName:StockTicker:BuyPricexBuyAmount;StockTicker:BuyPricexBuyAmount
PortfolioName: שם ייחודי (למשל, Portfolio1, Growth).
StockTicker: סימול המניה (למשל, AAPL).
BuyPrice: מחיר רכישה למניה (למשל, 150.25).
BuyAmount: מספר המניות (למשל, 10).
השתמש ב-
: להפרדה בין שם התיק, סימול ונתוני קנייה
x להפרדה בין מחיר וכמות
; להפרדה בין מניות מרובות
דוגמה:
- תיק 1: GrowthPortfolio:AAPL:150.25x10;TSLA:266.72x5
- תיק 2: DividendPortfolio:KO:55.20x50;PG:145.30x30
Release Notes
Version 1.1 includes:
- Calculations for extended hours (Pre-Market & After-Hours).
- Option to display portfolio summary data for stocks not in the portfolio (enable via settings checkbox).
- Table background for better visibility; click to bring table to the front.
- Updated text strings (names, titles, tooltips).
הערות
תמיכה בעברית: ההגדרות והתוויות מותאמות למשתמשים דוברי עברית.
הזנה ידנית: הזן נתוני תיק ידנית בחלונית ההגדרות תוך שימוש בפורמט הנכון.
תאימות: עובד עם כל סימול מניה הנתמך על ידי TradingView.
גרסה 1.1 מכילה:
1. חישובים כוללים שעות מסחר מורחבות (Pre-Market ו-After-Hours).
2. אפשרות להציג נתוני תיק כוללים עבור מניות שאינן בתיק (הפעל באמצעות תיבת סימון בהגדרות).
3. צבע רקע לטבלה לשיפור הנראות; לחיצה על הטבלה מביאה אותה לחזית.
4. תיקון נוסחים (שמות, כותרות, וטולטיפים).
PORTFOLIO TABLE Simple [Titans_Invest]PORTFOLIO TABLE Simple
This is a simple table for you to monitor your assets or cryptocurrencies in your SPOT wallet without needing to access your broker’s website or wallet app.
⯁ HOW TO USE THIS TABLE❓
You only need to select the asset and enter the amount of each one.
The table will show how much you have of each asset and the total value of your portfolio.
You’ll be able to monitor up to 39 assets in real time.
⯁ CONVERT VALUES
You can also activate and select a currency for conversion.
For example, cryptocurrency assets are calculated in US dollars, but you can select euros as the conversion currency.
The values originally in dollars will then be displayed in euros.
⯁ Track your Portfolio in real time:
⯁ Add your local Currency to Convert Values:
⯁ Follow your Portfolio Live:
___________________________________________________________
📜 SCRIPT : PORTFOLIO TABLE Simple
🎴 Art by : @Titans_Invest & @DiFlip
👨💻 Dev by : @Titans_Invest & @DiFlip
🎑 Titans Invest — The Wizards Without Gloves 🧤
✨ Enjoy!
___________________________________________________________
o Mission 🗺
• Inspire Traders to manifest Magic in the Market.
o Vision 𐓏
• To elevate collective Energy 𐓷𐓏

ETF Builder & Backtest System [TradeDots]Create, analyze, and monitor your own custom “ETF-like” portfolio directly on TradingView. This script merges up to 10 different assets with user-defined weightings into a single composite chart, allowing you to see how your personalized portfolio would have performed historically. It is an original tool designed to help traders and investors quickly gauge risk and return profiles without leaving the TradingView platform.
📝 HOW IT WORKS
1. Custom Portfolio Construction
Multiple Assets : Combine up to 10 different stocks, ETFs, cryptocurrencies, or other symbols.
User-Defined Weights : Allocate each asset a percentage weight (e.g., 15% in AAPL, 10% in MSFT, etc.).
Single Composite Value : The script calculates a weighted “ETF-style” price, effectively simulating a merged portfolio curve on your chart.
2. Performance Tracking & Return Analysis
Automatic History Capture : The indicator records each asset’s starting price when it first appears in your chosen date range.
Rolling Updates : As time progresses, all asset prices are continually evaluated and the portfolio value is updated in real time.
Buy & Hold Returns : See how each asset—and the overall portfolio—performed from the “start” date to the most recent bar.
Annualized Return : Automatically calculates CAGR (Compound Annual Growth Rate) to help visualize performance over varying timescales.
3. Table & Visual Output
Performance Table : A comprehensive table displays individual asset returns, annualized returns, and portfolio totals.
Normalized Chart Plot : The composite ETF value is scaled to 100 at the start date, making it easy to compare relative growth or decline.
Optional Time Filter : You can define a specific date range (Start/End Dates) to focus on a particular period or to limit historical data.
⚙️ KEY FEATURES
1. Flexible Asset Selection
Choose any symbols from multiple asset classes. The script will only run calculations when data is available—no need to worry about missing quotes.
2. Dynamic Table Reporting
Start Price for each asset
Percentage Weight in the portfolio
Total Return (%) and Annualized Return (%)
3. Simple Backtesting Logic
This script takes a straightforward Buy & Hold perspective. Once the start date is reached, the portfolio remains static until the end date, so you can quickly assess hypothetical growth.
4. Plot Customization
Toggle the main “ETF” plot on/off.
Alter the visual style for tables and text.
Adjust the time filter to limit or extend your performance measurement window.
🚀 HOW TO USE IT
1. Add the Script
Search for “ETF Builder & Backtest System ” in the Indicators & Strategies tab or manually add it to your chart after saving it in your Pine Editor.
2. Configure Inputs
Enable Time Filter : Choose whether to restrict the analysis to a particular date range.
Start & End Date : Define the period you want to measure performance over (e.g., from 2019-12-31 to 2025-01-01).
Assets & Weights : Enter each symbol and specify a percentage weight (up to 10 assets).
Display Options : Pick where you want the Table to appear and choose background/text colors.
3. Interpret the Table & Plots
Asset Rows : Each asset’s ticker, weighting, start price, and performance metrics.
ETF Total Row : Summarizes total weighting, composite starting value, and overall returns.
Normalized Plot : Tracks growth/decline of the combined portfolio, starting at 100 on the chart.
4. Refine Your Strategy
Compare how different weights or a new mix of assets would have performed over the same period.
Assess if certain assets contribute disproportionately to your returns or volatility.
Use the results to guide allocations in your real trading or paper trading accounts.
❗️LIMITATIONS
1. Buy & Hold Only
This script does not handle rebalancing or partial divestments. Once the portfolio starts, weights remain fixed throughout the chosen timeframe.
2. No Reinvestment Tracking
Dividends or other distributions are not factored into performance.
3. Data Availability
If historical data for a particular asset is unavailable on TradingView, related results may display as “N/A.”
4. Market Regimes & Volatility
Past performance does not guarantee similar future behavior. Markets can change rapidly, which may render historical backtests less predictive over time.
⚠️ RISK DISCLAIMER
Trading and investing carry significant risk and can result in financial loss. The “ETF Builder & Backtest System ” is provided for informational and educational purposes only. It does not constitute financial advice.
Always conduct your own research.
Use proper risk management and position sizing.
Past performance does not guarantee future results.
This script is an original creation by TradeDots, published under the Mozilla Public License 2.0.
Use this indicator as part of a broader trading or investment approach—consider fundamental and technical factors, overall market context, and personal risk tolerance. No trading tool can assure profits; exercise caution and responsibility in all financial decisions.

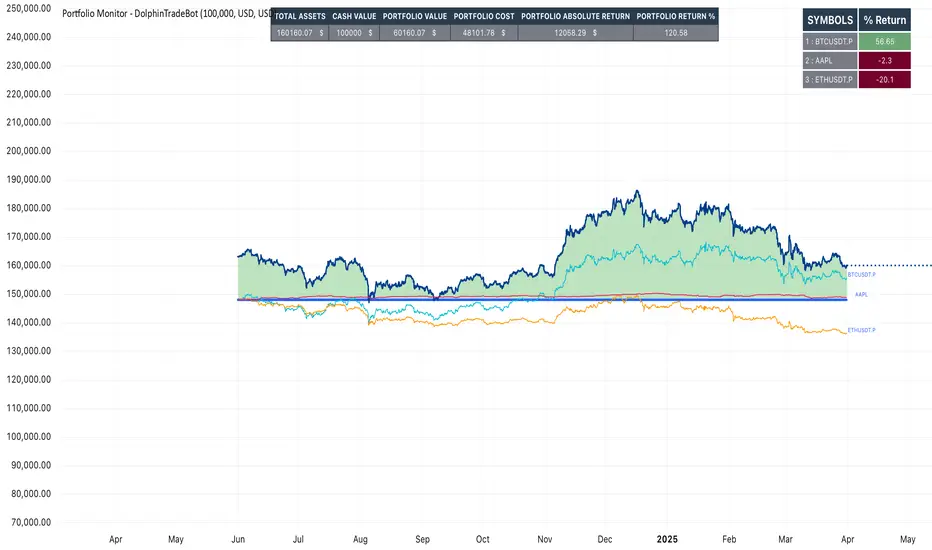
Portfolio Monitor - DolphinTradeBot1️⃣ Overview
▪️This indicator unifies the value of all your investments—whether stocks, currencies, or cryptocurrencies—in your chosen currency. This tool not only provides a clear snapshot of your overall portfolio performance but also highlights the individual growth of each asset with intuitive visualizations and an easy-to-understand performance report.
2️⃣ What sets this indicator apart
▪️is its ability to convert values from various currency pairs into any currency you choose. This means you can monitor your portfolio's performance against any currency pair you prefer, offering a flexible and comprehensive view of your investments.
3️⃣ How Is It Work ?
🔍The indicator can be analyzed under two main categories: visual representations and tables.
1- Visual representations ;
The indicator includes three different types of lines:
1. 1 - Reference Line → This represents the cost of all assets we hold, based on the selected date.
1. 2 - Total Assets Line → Displays the real-time value of all assets in our possession, including cash value, in the selected trading pair.
The area between the reference line is filled with green and red. The section above the reference line is represented in green, while the section below is shown in red.
1. 3 - Performance Lines → These visualize the performance of the assets, starting from the reference line and taking into account their weights in the portfolio. (Note: The lines are scaled for visualization purposes, so their absolute values should not be considered.)
"The names of the lines are shown in the image below."⤵️
2- Tables
The indicator includes three different types of tables:
2. 1 - Analysis Table : It provides a superficial overview of wallet statistics and values.
▪️TOTAL ASSETS → The current equivalent of all assets in the target currency
▪️CASH VALUE → The current value of the amount "Cash Value", in the target currency.
▪️PORTFOLIO VALUE → The total value of assets excluding Cash, in the target currency.
▪️POSTFOLIO COST → The cost of assets excluding Cash, in the target currency.
▪️PORTFOLIO ABSOLUTE RETURN → It shows the profit or loss relative to the cost of assets
▪️PORTFOLIO RETURN % →It shows the profit or loss relative to the cost of assets on a percentage basis
2. 2 - Performance Table : It displays the names of assets excluding Cash and their profit amounts, sorted from highest to lowest profit. If "Show as Percentage" is selected in the settings, it shows the percentage profit or loss relative to the cost. Profits are represented in green, while losses are represented in red.
"You can see the visual showing the tables below"⤵️
4️⃣How to Use ?
1- Choose the date on which the visualization will begin (📌The start date only affects the exchange rate used for calculating the reference line in the target currency.)
2- If you have cash holdings, enter the amount and specify the currency.
3- Select the currency in which your portfolio value will be displayed.(Default value is USD)
4- To set up your portfolio;
SYMBOLS - QUANTITY - PURCHASE PRICE
Enter the symbols of your assets - the number of units you hold - and their cost levels.
5- If you have cash, be sure to include your cash balance. If you also hold other currencies, enter them as separate assets with their corresponding quantities and purchase prices.
6- If you want to see the percentage returns of the assets in the performance table relative to their cost, select the "Show as Percent" option.
7- If you want to see the performance visuals of the assets, click on the "Show Asset Performance" option.
You can find an image of the settings section where the numbers above are used as references below.⤵️
📌 NOTE → By default, a few assets and their values have been pre-added in the initial settings. This is to ensure that you don’t see an empty screen when adding the indicator to the chart. Please remember to enter your own assets and values. The default settings are only provided as an example.
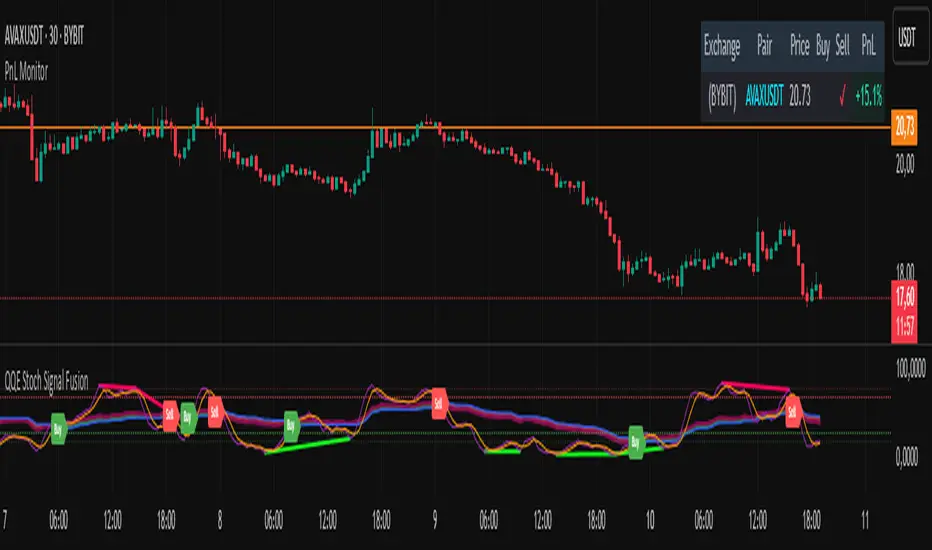
PnL MonitorThe PnL Monitor is a customizable tool designed to help traders track the Profit and Loss (PnL) of up to 20 currency pairs or assets in real-time. This script provides a clear and organized table that displays the entry price, and PnL percentage for each pair, making it an essential tool for monitoring open positions or tracking potential trades.
Key Features:
Multi-Asset Tracking:
Monitor up to 20 currency pairs or assets simultaneously. Simply input the pair symbol and your entry price, and the script will calculate the PnL in real-time.
Dynamic Table Positioning:
Choose where the table appears on your chart with the Table Position input. Options include:
Top Left
Top Right
Bottom Left
Bottom Right
Real-Time PnL Calculation:
The script fetches the current price of each pair and calculates the PnL percentage based on your entry price. Positive PnL is highlighted in green, while negative PnL is highlighted in red.
Exchange and Pair Separation:
The script automatically separates the exchange name (if provided) from the pair symbol, making it easier to identify the source of the data.
Customizable Inputs:
Add or remove pairs as needed.
Leave the price field blank for pairs you don’t want to track.
How to Use:
Input Your Pairs:
In the script settings, input the symbol of the pair (e.g., NASDAQ:AAPL or BTCUSD) and your entry price. Leave the price field blank for pairs you don’t want to track.
Choose Table Position:
Select where you want the table to appear on your chart.
Monitor PnL:
The table will automatically update with the current price and PnL percentage for each pair.
Why Use This Script?
Efficiency: Track multiple pairs in one place without switching charts.
Clarity: Easily identify profitable and losing positions at a glance.
Flexibility: Customize the table to fit your trading style and preferences.
Ideal For:
Forex, crypto, and stock traders managing multiple positions.
Asset Allocation CalculatorOverview
This script is a tool that automatically calculates asset allocation for your investment portfolio. Users can set the weight of multiple assets and monitor the portfolio value in real time based on price fluctuations.
Key Features
Supports input of asset allocation percentages
Dynamic allocation calculation based on real-time price data
Automatically calculates allocated amounts for each asset based on the total investment amount
User-friendly interface with intuitive visual feedback
Settings
Total Capital : Enter the total capital, including the value of assets.
Quantity rounding : Using the rounding function may cause the target allocation to exceed 100%.
Tickers, Weight, Holdings :
To retrieve accurate asset prices, specify both the exchange and the ticker.
If you want to include cash in your portfolio, use $.
Ensure that the total allocation sums to 100%.
Refer to the pre-filled example for the correct format.
Table Settings : You can adjust the table's position, height, font size, and background color.
How to Use
By buying or selling the quantity shown in the Buy column, you can continuously maintain your target allocation.
Hold - Current holdings
Buy - Quantity to buy or sell to reach the target allocation
Target - Quantity aimed for after buying or selling
Caution
It can only calculate for a single currency, so do not mix multiple currency markets.
자산 배분 계산기
소개
이 스크립트는 투자 포트폴리오의 자산 배분을 자동으로 계산해주는 도구입니다. 사용자는 여러 자산의 비중을 설정할 수 있으며, 가격 변동에 따라 포트폴리오 가치를 실시간으로 모니터링할 수 있습니다.
주요 기능
자산 배분 비율 입력 지원
실시간 가격 데이터를 기반으로 한 동적 배분 계산
총 투자 금액을 기준으로 각 자산에 할당된 금액 자동 계산
직관적인 시각적 피드백을 제공하는 사용자 친화적인 인터페이스
설정
Total Capital : 자산 가치를 포함한 총 자본금을 입력하세요.
Quantity rounding : 반올림 기능을 사용하면 목표 비중이 100%를 초과할 수 있습니다.
Tickers, Weight, Holdings :
정확한 자산 가격을 불러오기 위해 거래소와 티커를 함께 입력하세요.
포트폴리오에 현금을 포함하려면 '$'를 사용하세요.
비중 합계가 반드시 100%가 되도록 설정하세요.
예제 형식을 참고하여 올바르게 입력하세요.
한국(원화) 시장을 위한 입력 예시입니다.
KRX:360750, 17.5, 100
KRX:310960, 17.5, 120
KRX:148070, 25, 20
KRX:305080, 25, 10
KRX:139320, 10, 150
UPBIT:BTCKRW, 5, 0.002
$,0,5000000
Table Settings : 테이블의 위치, 높이, 글자 크기 및 배경색을 조정할 수 있습니다.
사용 방법
Buy 열에 표시된 수량만큼 매수 또는 매도하면 목표 비중을 지속적으로 유지할 수 있습니다.
Hold - 현재 보유 수량
Buy - 목표 비중을 맞추기 위해 매수 또는 매도해야 하는 수량
Target - 매수, 매도 후 목표로 하는 수량
주의
한 가지 통화로만 계산할 수 있으니 여러 통화 시장을 혼용하지 마세요.

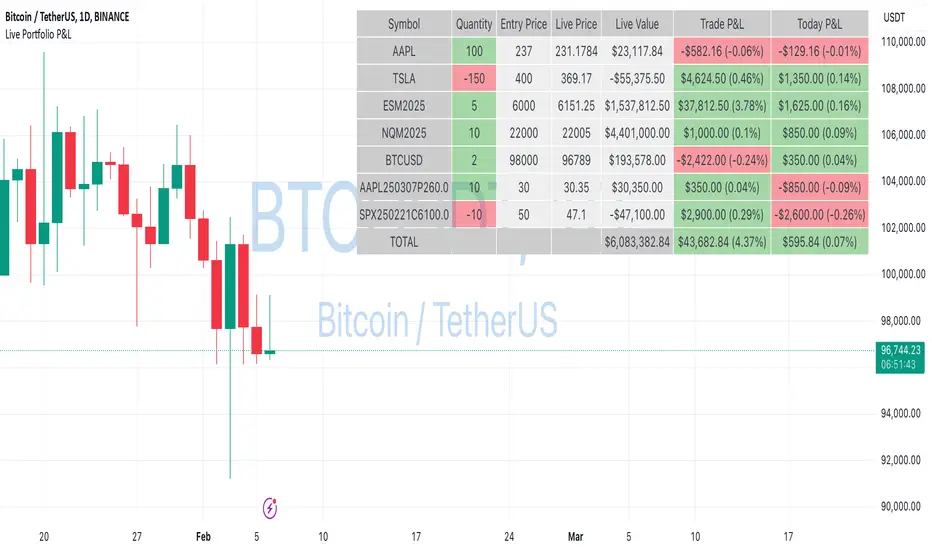
Live Portfolio P<his script calculates live P&L (Profit & Loss) for up to 40 instruments — stocks, ETFs, options, futures, and Forex pairs supported by TradingView. Instead of juggling numerous inputs, you paste your portfolio in CSV format into a single text field, and the script handles the rest. It parses each position and displays a comprehensive table showing the symbol, current price, position value, total P&L, and today’s P&L—all updated in real time.
Key Features
CSV Portfolio Input – Effortlessly import all your positions at once without filling in multiple fields. You can export the position from your broker, save it in the required format, and paste it into this script.
Supports Various Asset Classes – Works with any instrument that TradingView provides data for, including futures, options, and Forex.
Up to 40 Instruments – Track a broad and diverse set of holdings in one place.
Real-Time Updates – Get immediate feedback on live price changes, total value, and current P&L.
Today’s P&L – Monitor your daily performance to gauge short-term trends.
CSV is consumed in the following format:
Symbol (supported TradingView instruments)
Entry Price
Quantity (negative for short position)
Lot Size (for futures/options, it might not be one)
For example:
AAPL,237,100,1
TSLA,400,-150,1
ESM2025,6000,5,50
Planned Enhancements
Multi-Currency Support – Automatically convert and display your positions’ values in different currencies.
Advanced Metrics – Get deeper insights with calculations for drawdown, Sharpe ratio, and more.
Risk Management Tools – Set stop-loss and take-profit levels and receive alerts when thresholds are hit.
Option Greeks & Margin Calculations – Manage complex option strategies and track margin requirements.
Questions for You
What additional features would you like to see?
Are there any specific metrics or analytics you’d find especially valuable?
How might this script fit into your current trading workflow?
Feel free to share your thoughts and suggestions. Your feedback will help shape future updates and make this tool even more helpful for traders like you!
Disclaimer
Please remember that past performance may not be indicative of future results.
Due to various factors, including changing market conditions, the strategy may no longer perform as well as in historical backtesting.
This post and the script don’t provide any financial advice.
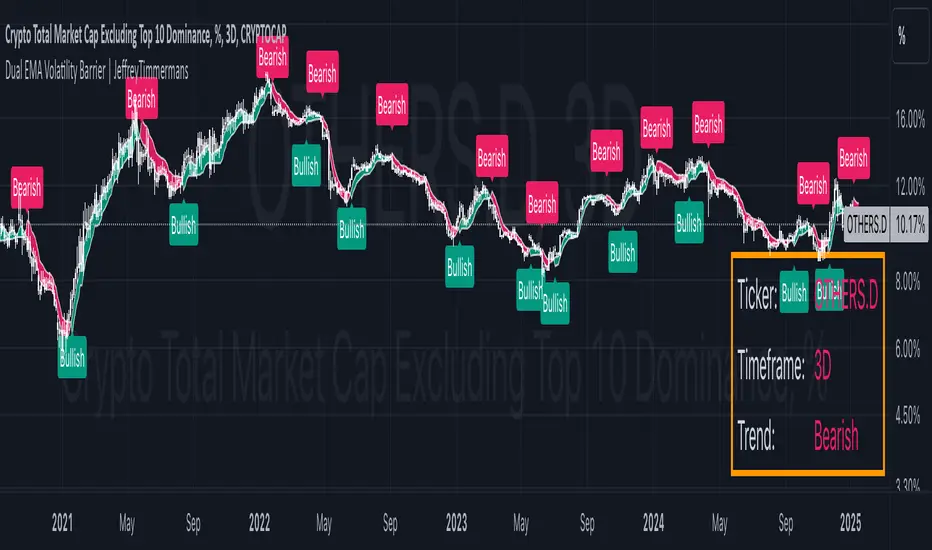
Dual EMA Volatility Barrier | JeffreyTimmermansDual EMA Volatility Barrier
The "Dual EMA Volatility Barrier" indicator combines the power of the Double Exponential Moving Average (DEMA) with volatility-based stops to provide a robust trend-following system. This indicator helps traders identify and confirm trends, offering a way to filter out noise using volatility measures like the Average True Range (ATR) and a higher timeframe filter for additional trend validation.
Key Features
Dual Exponential Moving Average (DEMA):
DEMA Calculation: A more responsive moving average that reduces lag compared to standard EMAs. This helps detect trend changes faster.
Source Customization: Allows traders to choose the source (default is close), which can help adapt the strategy for different market conditions.
Volatility Barrier (Vstop):
Volatility-Based Stops: The Vstop is calculated using the Average True Range (ATR) multiplied by a user-defined factor. This forms a dynamic stop level that adjusts based on market volatility.
Trend Direction: The Vstop adapts to whether the market is in an uptrend or downtrend, providing a stop-loss level that moves accordingly.
Higher Timeframe Trend Filter:
Higher Timeframe DEMA: The higher timeframe filter uses a DEMA from a larger timeframe to confirm the trend direction. Only consider bullish signals if the price is above the higher timeframe DEMA.
Customizable Higher Timeframe: Traders can select any timeframe (e.g., D for daily) to check the trend from a higher perspective.
Signal Generation:
Bullish Signal: Triggered when the trend is up, and the price is above the higher timeframe DEMA, with a corresponding Vstop change indicating an upward trend.
Bearish Signal: Triggered when the trend is down and the price is below the higher timeframe DEMA, with a corresponding Vstop change indicating a downward trend.
Trend Reversals: Identifies key trend reversals by showing the transition between uptrend and downtrend states.
Plotting and Visuals:
DEMA and Vstop Plot: The indicator plots both the DEMA and the Vstop on the chart, providing a visual guide for trend and volatility.
Background Color Fill: The area between the DEMA and Vstop is filled with a color (green for bullish, red for bearish) to provide a clear visual representation of the trend.
Signal Labels: Plot arrows and labels ("Bullish" and "Bearish") directly on the chart to highlight trend changes.
Dashboard:
Ticker & Timeframe Display: The dashboard in the bottom-right corner shows the current symbol (ticker) and timeframe, along with the current trend (Bullish or Bearish).
Real-Time Updates: The dashboard updates in real time, providing traders with quick insights into the current market conditions.
Alerts:
Bullish Alert: Activated when the trend is bullish and confirmed by the higher timeframe DEMA.
Bearish Alert: Activated when the trend is bearish and confirmed by the higher timeframe DEMA.
Customizable Messages: Alerts provide details about the ticker and trend conditions for easy action.
Improvements:
Higher Timeframe Filtering: The higher timeframe DEMA filter ensures that traders align their trades with the broader market trend, improving the overall accuracy of signals.
Volatility-Based Stops: The ATR-based volatility stops allow for adaptive risk management that responds to changing market conditions.
Dynamic Signal Detection: The bullish and bearish signals change in real time, providing actionable insights for traders.
Visual and Dashboard Updates: The chart visually reflects the trend and volatility dynamics, while the dashboard provides summary information at a glance.
Customizable Alerts: Alerts based on trend changes make it easy to stay informed without constantly monitoring the chart.
Use Cases:
Trend Following: Ideal for identifying and following strong trends by combining short-term and long-term trend indicators.
Volatility-Based Risk Management: Use the Vstop to manage trade exits, as it adjusts to market volatility.
Higher Timeframe Confirmation: Use the higher timeframe DEMA to ensure that the trade aligns with the overall market trend.
Alerts for Real-Time Action: Set alerts to notify when the market signals a shift, whether bullish or bearish.
The Dual EMA Volatility Barrier is a powerful tool for traders seeking to combine trend-following with volatility management. The integration of DEMA, ATR, and a higher timeframe filter allows for a more nuanced understanding of market conditions, ensuring traders can make informed decisions with minimal lag.
This script is inspired by "viResearch" . However, it is more advanced and includes additional features and options.
-Jeffrey
Improved RSI Trend Sniper | JeffreyTimmermansImproved RSI Trend Sniper
This indicator, the "Improved RSI Trend Sniper" is a sophisticated tool designed to enhance market trend analysis by integrating customizable RSI thresholds with advanced moving average options and refined visual enhancements.
Key Features
Advanced Moving Average Options:
The indicator now supports multiple moving average types: SMA, EMA, SMMA, WMA, VWMA, LSMA, HMA, and ALMA, offering greater flexibility in trend analysis.
Users can customize the moving average length for precise momentum detection.
Enhanced Momentum Detection:
Upgraded to allow dynamic calculation of momentum based on user-selected moving averages.
Conditions for bullish or bearish momentum now consider changes in the chosen moving average rather than a fixed EMA, improving accuracy.
Visual Upgrades:
A gradient-based trend fill with multiple opacity layers provides a visually appealing representation of bullish and bearish trends.
New dashboard integration displays key market information, including the ticker, timeframe, and current trend (bullish or bearish).
Improved Signal Customization:
Customizable colors and labels for bullish and bearish signals ensure easy identification on the chart.
Enhanced settings for showing or hiding labels and trend fills
Refined Alerts System:
Alerts are now generated for bullish and bearish conditions with customized messages for better responsiveness.
Alerts can be triggered once per bar close, making them more reliable.
What's New:
RSI and MA Customization: Users can define thresholds and moving average settings, providing more control over trend analysis.
Dashboard Integration: Displays real-time updates directly on the chart for improved situational awareness.
Visual Enhancements: Introduced gradient fills for trend regions, making trends more distinct.
Expanded Moving Average Options: Allows for tailored strategies using various MA calculation methods.
Alert Messaging: Streamlined notifications for actionable insights.
How It Works
Momentum Analysis:
Bullish momentum is detected when the RSI crosses above the bullish threshold and the moving average is increasing.
Bearish momentum is flagged when the RSI falls below the bearish threshold, and the moving average is decreasing.
Trend Visualization:
Bullish trends are highlighted with gradient shades of green, while bearish trends use shades of red.
Labels appear on the chart to mark key turning points.
Tailored for Different Trading Styles
The Improved RSI Trend Sniper is versatile and adaptable, catering to traders with various time horizons:
Long-Term Adjustments: For traders focusing on long-term trends, increasing the RSI length and moving average period allows the indicator to smooth out minor price fluctuations and highlight sustained momentum. Selecting slower-moving averages like the SMA or LSMA further filters out short-term noise, ensuring signals align with broader market trends.
Medium-Term Adjustments: Swing traders can use a balanced RSI length (e.g., 14–20) and a medium moving average period (e.g., 20–50) to capture actionable signals within the mid-range market cycles. The inclusion of options like EMA or SMMA ensures quicker reactions to price changes while maintaining moderate sensitivity to reversals.
Short-Term Adjustments: For day traders or scalpers, using a shorter RSI period (e.g., 7–10) alongside faster moving averages such as the HMA or ALMA can provide quicker signals for high-frequency trading. These adjustments enhance the ability to react swiftly to immediate market shifts, ideal for fast-paced trading environments.
By customizing the indicator’s settings to align with your trading timeframe, the Improved RSI Trend Sniper ensures accurate and relevant insights, empowering traders to optimize their strategies across any market condition.
Dashboard Details
Provides an at-a-glance view of market data for the current ticker and timeframe.
The Improved RSI Trend Sniper takes the original tool to the next level, offering a more comprehensive, customizable, and visually intuitive approach to market trend analysis. Perfect for traders looking to refine their strategies with actionable insights.
-Jeffrey

Improved Target Oscillator | JeffreyTimmermansImproved Target Oscillator
The Improved Target Oscillator is a versatile technical indicator that identifies trends, reversals, and market momentum. Designed to work effectively across various markets, this oscillator excels at capturing longer-term market trends, making it ideal for traders focused on sustained price movements. By using advanced mathematical techniques and dynamic visualization, the oscillator provides actionable insights, helping traders navigate complex market environments with confidence.
Key features include:
A dynamic oscillator line to reflect market momentum and reversals.
Clear gradient-based coloring to distinguish between bullish and bearish conditions.
Signal highlights for potential entry and exit points based on trend shifts.
This tool is particularly useful for identifying extended trends and provides a clean, intuitive interface for assessing market dynamics.
Improvements in the Improved Target Oscillator
Smoothing Feature:
Added an optional smoothing toggle, allowing the use of SMA or EMA for reducing noise.
Provides flexibility through adjustable smoothing length, enhancing clarity in choppy markets.
Alerts for Trade Opportunities:
Built-in alert conditions for bullish and bearish signals.
Allows traders to receive notifications when critical trend changes occur, ensuring they never miss an opportunity.
Customizable to integrate seamlessly into trading workflows.
Enhanced Visualization:
Introduced dynamic gradients for bullish and bearish conditions with improved customization options.
Provides clearer differentiation of momentum changes, improving interpretability.
Signal Highlights:
Improved visual cues for bullish and bearish signals with precise dot indicators.
Offers better alignment with oscillator momentum shifts, ensuring actionable insights.
Adaptability:
Tuned for use in capturing longer-term market trends, emphasizing its effectiveness in identifying sustained movements.
Adjusted oscillator sensitivity with a levels multiplier for better scalability across various market conditions.
Level Markers:
Clearer delineation of key oscillator levels, including half and full normalized levels for improved context.
A neutral line explicitly plotted for easier trend and momentum identification.
Summary
The Improved Target Oscillator combines a sophisticated mathematical foundation with practical visualization enhancements to deliver a more intuitive and precise tool for market analysis. With added flexibility, improved signals, and tailored features for longer-term trends, this oscillator is an essential resource for traders looking to refine their strategies.
-Jeffrey

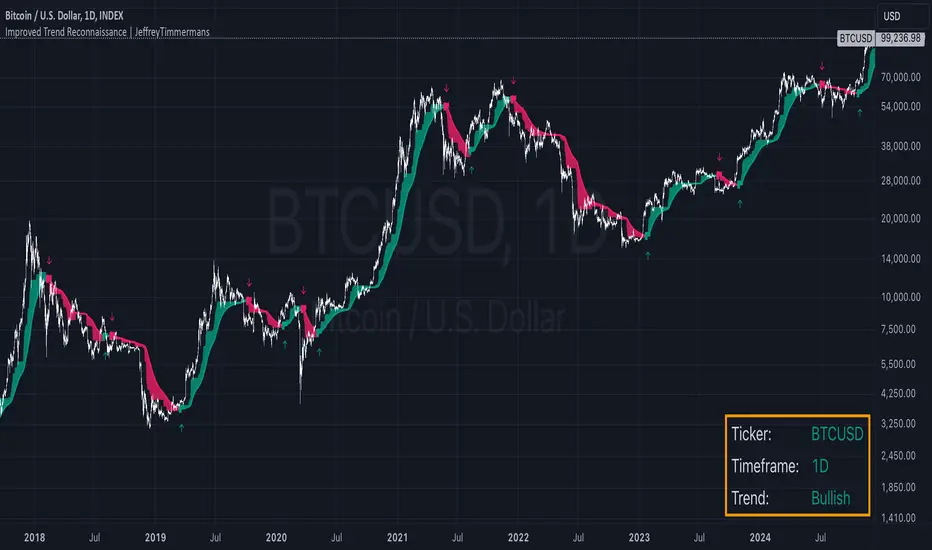
Improved Trend Reconnaissance | JeffreyTimmermansImproved Trend Reconnaissance
The Improved Trend Reconnaissance indicator is a robust tool designed to help traders identify and follow trends while avoiding market noise. It is especially effective for capturing longer-term trends and sustained price movements over extended time periods. By leveraging smoothed trend analysis and volatility-based consolidation detection, this indicator provides clear and actionable insights for traders focusing on significant market trends.
What Does This Indicator Do?
At its core, this indicator calculates a Half Trend value and applies advanced smoothing techniques to emphasize longer-term trends. Additionally, it incorporates volatility analysis using the Average True Range (ATR) to detect periods of consolidation, where trend signals are muted to prevent false signals.
Key Components Explained
Half Trend Calculation:
This indicator determines a Half Trend value based on the relationship between the Exponential Moving Average (EMA) of closing prices and the highest highs and lowest lows over a specified range.
The trend is further smoothed to minimize short-term fluctuations, ensuring the focus remains on sustained price movements.
ATR-Based Consolidation Detection:
By comparing the range of price highs and lows to a multiple of ATR, the indicator detects consolidation zones where the market is range-bound. During these periods, trend signals are suppressed to avoid false positives.
Trend Visualization:
Bullish Trends: Highlighted in green with upward markers and optional trend-colored candles.
Bearish Trends: Highlighted in red with downward markers and optional trend-colored candles.
Designed for Longer-Term Trends:
The default settings are optimized to capture longer-term trends, making this indicator particularly valuable for traders looking to identify and follow substantial market movements over extended periods.
Key Features
Optimized for Capturing Longer Trends:
With the default settings, the indicator is tailored to identify and follow longer-term price trends, reducing noise from minor fluctuations. This makes it ideal for traders focused on significant trends and extended price movements.
Customizable Inputs:
Parameters such as trend range, smoothing length, ATR calculation period, and consolidation threshold are fully customizable.
Visual settings, including trend colors and signal sizes, can be adjusted for personalized trading needs.
Dynamic Signal Generation:
Bullish Signals: Generated when the smoothed Half Trend crosses upward and the market is trending.
Bearish Signals: Generated when the smoothed Half Trend crosses downward and the market is trending.
Alerts can notify traders in real time when these conditions occur.
Enhanced Visualization:
Candle coloring based on trend direction provides an immediate visual representation of market momentum.
Plotted trend lines and filled regions between them emphasize the current trend's strength and direction.
Real-Time Dashboard:
Displays essential information, including the current ticker, trend direction, and status (bullish or bearish), directly on the chart.
How to Use This Indicator
Identify Longer-Term Trends:
Use the smoothed Half Trend line and trend-colored candles to identify and follow significant price trends.
The default settings are specifically designed to focus on extended trends, making it easier to spot major market moves.
Avoid Noise in Consolidation:
Pay attention to the consolidation detection feature, which suppresses signals during range-bound market conditions, aka mean-reverting markets.
This ensures that signals generated are more reliable and actionable.
Confirm Trend Signals:
Use the visual markers (flags) and dashboard status to validate bullish or bearish trends before making trading decisions.
Set Alerts:
Set alerts for bullish or bearish signals to stay informed about key market movements without constantly monitoring the charts.
Adapt for Your Strategy:
While optimized for longer-term trends, the customizable settings allow you to adapt the indicator for shorter-term strategies if needed.
What Makes This Indicator Unique?
Focus on Longer-Term Trends:
Unlike many indicators that respond to short-term fluctuations, this tool is tailored for longer-term trend-following systems, ensuring that traders capture the most meaningful price movements.
Noise Reduction:
By combining smoothing techniques and ATR-based consolidation detection, the indicator reduces market noise and focuses on actionable insights.
Clear Visual Representation:
The combination of trend-colored candles, plotted lines, and dashboard information simplifies the analysis of complex market trends.
Customizability:
Fully adjustable parameters ensure the indicator meets the specific needs of a wide range of trading styles.
Real-Time Feedback:
Alerts and dashboard integration keep traders informed, enabling timely and well-informed decision-making.
The Improved Trend Reconnaissance indicator is an essential tool for traders looking to focus on longer-term trends and sustained market movements. With its default settings optimized for capturing significant trends over extended periods, it offers clarity, precision, and actionable insights for successful trend-following trading.
-Jeffrey
STH MVRV + Double MA | JeffreyTimmermansSTH MVRV + Double MA
This indicator combines blockchain analytics and technical analysis to provide traders with insights into market trends and cycles. At its core, it utilizes the Short-Term Holder (STH) Market Value to Realized Value (MVRV) ratio, a powerful metric in blockchain analysis, alongside Moving Averages (MA's) to offer a comprehensive view of market dynamics.
What Is the STH-MVRV Ratio?
The STH-MVRV ratio is a blockchain-based metric that compares the market value of Bitcoin held by short-term holders to its realized value.
Market Value: The current price of Bitcoin multiplied by the number of coins held by short-term holders.
Realized Value : The average price at which short-term holders acquired their Bitcoin, based on blockchain transaction data.
This ratio provides a unique perspective on market sentiment:
Above 1: Short-term holders, on average, are in profit. This often signals a bullish market.
Below 1: Short-term holders are, on average, at a loss, which can indicate bearish sentiment.
The STH-MVRV is particularly useful for identifying potential market tops or bottoms, as short-term holder behavior often reflects broader market trends.
How Does This Indicator Work?
The STH MVRV + Double MA indicator builds on the STH-MVRV ratio by integrating it with additional data and tools to enhance its practical use:
STH-MVRV Variations:
STH-MVRV (MVRV): The traditional ratio as described above.
Price-Based MVRV: A variation using Bitcoin price to measure similar dynamics.
Average MVRV: A hybrid metric combining the two for balanced insights.
Dynamic Moving Averages (MA's):
Primary SMA (STH-MVRV): Smooths out fluctuations in the STH-MVRV ratio over a default period of 155 days.
Extra MA: A faster-moving average for shorter-term trends (default: 50 days).
Second MA: A slower-moving average for longer-term trends (default: 200 days).
Visual and Alert Features:
Color-coded plots to highlight bullish or bearish conditions.
Alerts for key crossover events, such as when STH-MVRV crosses above/below critical levels or Moving Averages.
Key Features
STH-MVRV as a Sentiment Gauge:
Use the ratio to determine whether short-term holders are profiting (bullish) or losing (bearish).
Moving Average Integration:
Identify trends and reversals with customizable Moving Averages.
Crossovers between MA's and the STH-MVRV indicate actionable trading signals.
Customizable Parameters:
Tailor SMA and MA settings to align with your strategy.
Adjust colors and labels for clearer insights.
Real-Time Updates:
Dynamic labels display the current values of STH-MVRV, Price-based MVRV, or the Average, providing instant clarity.
How to Use This Indicator
Gauge Market Sentiment:
Use the STH-MVRV to understand whether the market is overvalued or undervalued based on short-term holder behavior.
Trend Identification with MA's:
Monitor crossovers between STH-MVRV and Moving Averages for potential buy or sell signals.
Analyze Market Cycles:
Use the Average MVRV to gain a broader view of market conditions, balancing short-term and long-term insights.
What Makes This Indicator Unique?
In-Depth Blockchain Metric: Builds directly on the STH-MVRV ratio, a key metric in blockchain analysis.
Integrated Analysis: Combines the STH-MVRV with Moving Averages for enhanced functionality.
Customizability and Practicality: Users can adapt the settings to fit their unique trading style, ensuring the tool is both flexible and powerful.
This combination of blockchain insights and technical tools makes the STH MVRV + Double MA indicator an essential addition to any trader’s arsenal. Use it to stay ahead of market trends and make informed decisions with confidence.
-Jeffrey
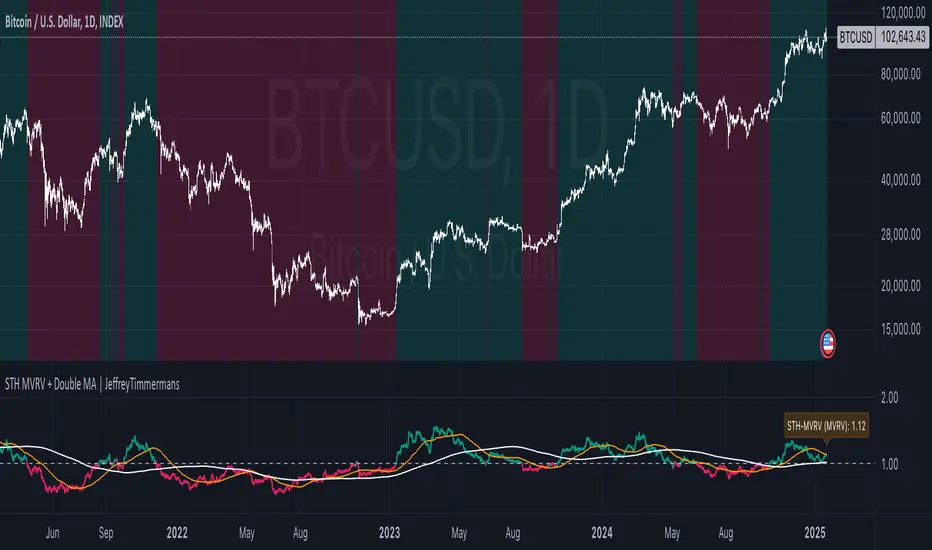
Z-Score Financial Market Conditions | JeffreyTimmermansZ-Score Financial Market Conditions
The Z-Score Financial Market Conditions indicator is a cutting-edge tool for measuring financial market stress and relaxation by combining eight critical financial metrics into a single composite Z-score. This dynamic indicator provides traders and analysts with actionable insights into the overall state of the financial markets, enabling informed decision-making across various trading and investment systems.
Purpose of the Indicator
This indicator serves as a comprehensive gauge of financial market conditions, offering a clear visualization of whether the markets are in a state of stress (elevated risks) or relaxation (normalized conditions). The Z-Score Financial Market Conditions tool is particularly effective for:
Macro-Level Risk Assessment: Identifying periods of high market stress or calmness.
Trend Following Systems: Gauging the market's underlying conditions to validate trends.
Mean Reversion Strategies: Using extreme Z-score levels to detect potential reversals.
Portfolio Risk Management: Adjusting asset exposure based on market-wide financial conditions.
This indicator works exclusively on the 1-day timeframe, as it is calibrated to analyze daily changes in the financial metrics that drive market behavior.
The Eight Key Components and Their Importance
The composite Z-score integrates the Z-scores of the following eight financial metrics. These metrics have been selected for their complementary insights into various aspects of financial market conditions:
VIX (S&P 500 Volatility Index)
Reflects implied volatility in the U.S. equity market.
High VIX values indicate increased uncertainty and risk aversion among market participants.
MOVE (US Treasury Bond Volatility Index)
Captures volatility in U.S. Treasury bonds.
Essential for understanding risk in fixed-income markets, which significantly impact broader economic conditions.
ICE BofA High Yield Option Adjusted Spread (BAMLH0A0HYM2)
Measures the risk premium for high-yield corporate bonds.
Rising spreads suggest increased credit risk and potential economic stress.
ICE BofA Corporate Index Option Adjusted Spread (BAMLC0A0CM)
Tracks credit spreads in the investment-grade bond market.
Helps evaluate the health of higher-quality corporate debt, a key indicator of financial stability.
ICE BofA US High Yield Index Spread (BAMLH0A0HYM2)
Focuses on high-yield U.S. corporate bonds.
Provides localized insights into U.S. credit conditions and risk levels.
CDS (Credit Default Swap Spreads)
Measures the cost of insuring against bond defaults.
Rising CDS spreads signal growing concern over creditworthiness, often a leading indicator of financial stress.
Global Bond Spread (AGG)
Represents global fixed-income spreads.
Offers a broader perspective on international financial conditions beyond the U.S. market.
TED Spread (Treasury-EuroDollar Spread)
The difference between interbank lending rates and short-term U.S. Treasury yields.
Widely regarded as an indicator of systemic risk in the banking sector.
Features and Improvements
This script builds upon the original concept by introducing advanced features to enhance its precision and usability:
Lookback Period Adjustment
A customizable lookback period for Z-score calculations (default: 160 days).
Allows for greater flexibility in adapting to different market conditions.
Moving Average (MA) Smoothing
Optional smoothing of Z-scores using an exponential moving average (EMA) for enhanced clarity.
Default smoothing length: 8 days.
Individual Component Visibility
Plots for individual Z-scores can be enabled or disabled to focus on specific metrics.
Dynamic Background Coloring
Visual cues to indicate bullish (green) or bearish (red) financial conditions based on the composite Z-score.
Custom Inputs
Toggle on/off for each financial metric to tailor the indicator to specific use cases.
Customizable parameters for smoothing and moving averages.
Applications
This indicator is versatile and can be effectively used in various trading systems and strategies:
Long-Term Investment Decision-Making: Assess macroeconomic trends for portfolio rebalancing.
Systematic Trading: Incorporate market conditions into algorithmic models to enhance robustness.
Volatility-Based Strategies: Use Z-score fluctuations to anticipate periods of market turbulence or calm.
Credits
This indicator was inspired by and builds upon the work of TomasOnMarkets . While incorporating significant enhancements, it acknowledges the foundational concepts provided by this original source. Thank you for sharing your input on this important indicator. We are honored to use it and to further improve upon it.
-Jeffrey
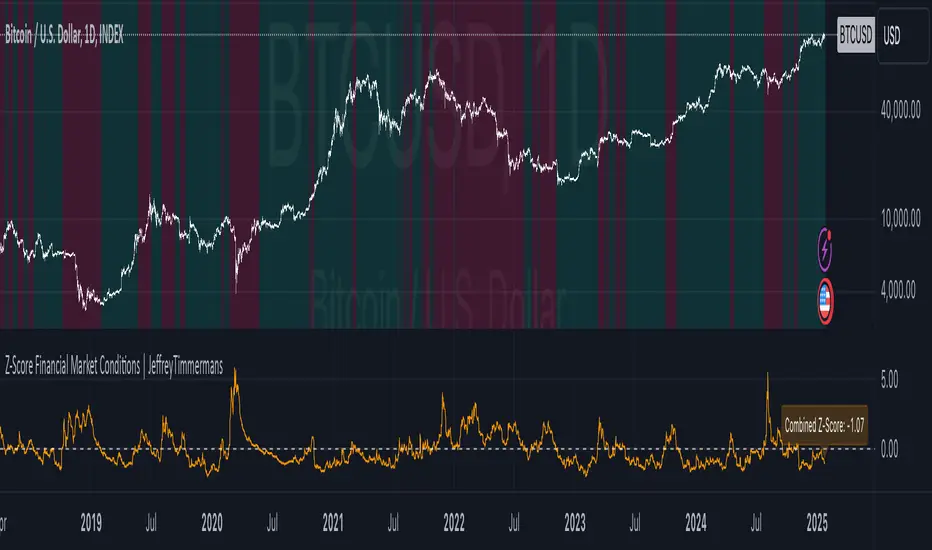
DCA Valuation & Unrealized GainsThis Pine Script for TradingView calculates and visualizes the relationship between a Dollar Cost Average (DCA) price and the All-Time High (ATH) price for over 50 different cryptocurrencies. Here's what it does:
1. Inputs for DCA Prices:
- Users can manually input DCA prices for specific cryptocurrencies (e.g., BTC, ETH, BNB).
2. Dynamic ATH Calculation:
- Dynamically calculates the ATH price for the current asset using the highest price in the chart's loaded data and persists this value across bars.
3. Percentage Change from DCA to ATH:
- Computes the percentage gain from the DCA price to the ATH price.
4. Visualizations:
- Draws a line at the DCA price and the ATH price, both extended to the right.
- Adds an arrow pointing from the DCA price to the ATH, offset by 10 bars into the future.
- Displays labels for:
- The percentage gain from DCA to ATH.
- "No DCA Configured" if no valid DCA price is set for the asset.
5. Color Coding:
- Labels and arrows are color-coded to indicate positive or negative percentage changes:
- Green for gains.
- Red for losses.
6. Adaptability:
- The script dynamically adjusts to the current asset based on its ticker and uses the corresponding DCA price.
This functionality provides traders with clear insights into their investment's performance relative to its ATH, aiding in decision-making.
-----
To add a new asset to the script:
1. Define the DCA Input: Add a new input for the asset's DCA price using the `input.float` function. For example:
dcaPriceNEW = input.float(title="NEW DCA Price", defval=0.1, tooltip="Set the DCA price for NEW")
2. Add the Asset Logic: Include a conditional check for the new asset in the ticker matching logic:
if str.contains(currentAsset, "NEW") and dcaPriceNEW != 0
dcaPrice := dcaPriceNEW
Where NEW is the ticker symbol of the asset you're adding.
NOTE: SOLO had to be put before SOL because otherwise the indicator was pulling the DCA price from SOL even on the SOLO chart. If you have a similar issue, try that fix.
Adding an asset requires only these two changes. Once done, the script dynamically incorporates the new asset into its calculations and visualizations.
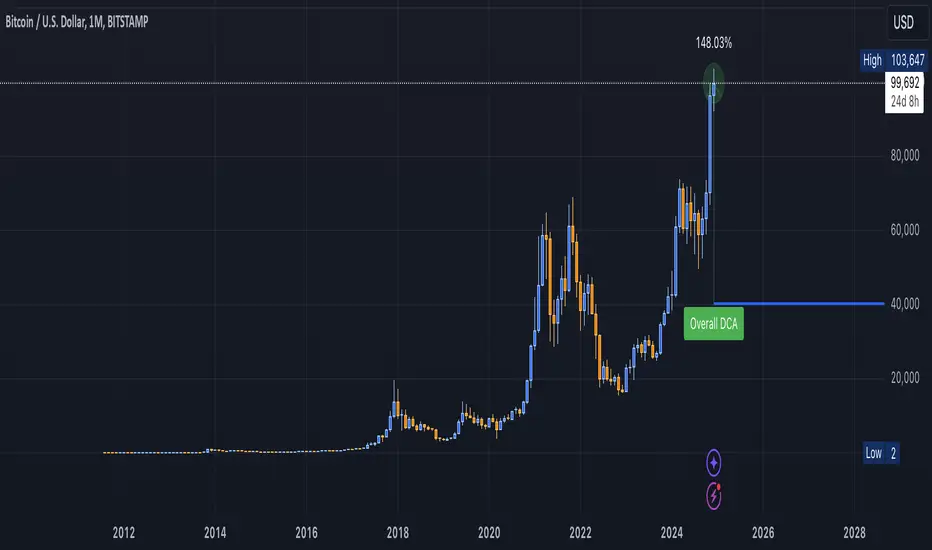
Leveraged Chart with Financing, Portfolio DCA & NormalizationLeveraged Investment Simulator with Portfolio DCA & Performance Metrics
Overview:
This indicator helps simulate leveraged investment strategies, incorporating financing costs, Dollar Cost Averaging (DCA), and performance metrics. Ideal for analyzing leveraged growth on price charts or managing portfolios with periodic contributions.
Key Features:
Dual Simulation Modes:
- Chart Mode: Simulate leveraged growth directly on the price chart.
- Portfolio Mode: Track portfolio performance with periodic DCA contributions.
Leverage & Financing Fees:
- Adjustable leverage multiplier.
- Annual financing fees to model borrowing costs.
Dollar Cost Averaging (DCA):
- Set an initial investment and recurring deposit amounts.
- Choose contribution frequency: Monthly, Quarterly, or Yearly.
Performance Metrics:
- Sharpe Ratio: Evaluate risk-adjusted returns.
- Sortino Ratio: Assess downside risk-adjusted performance.
- Maximum Drawdown: Measure the largest decline from a peak.
Customizable Labels:
- Enable or disable specific sections, such as portfolio details and risk metrics.
Inputs:
Symbol selection (default: AAPL).
Data timeframe (e.g., daily, weekly, monthly).
Leverage multiplier and annual financing fees.
Portfolio options: Initial investment, deposit amounts, and frequencies.
Performance analysis options, including a customizable risk-free rate for Sharpe/Sortino ratios.
Toggleable label sections for focused analysis.
How to Use:
Add the indicator to your chart.
Configure the inputs to match your strategy (e.g., leverage factor, financing rates, DCA settings).
Toggle on/off the label sections to display relevant metrics.
Analyze the results:
Chart Mode: Observe leveraged growth on the price chart.
Portfolio Mode: Track portfolio growth, contributions, and performance metrics.
Benefits:
Simulate realistic scenarios with leverage, financing costs, and periodic investments.
Assess performance with advanced metrics like Sharpe and Sortino Ratios.
Identify risk with Maximum Drawdown analysis.
Customize your view for clarity and focus.
This indicator is perfect for traders and investors looking to optimize leveraged strategies or manage portfolios with DCA contributions effectively.

Portfolio [Afnan]🚀 Portfolio - Advanced Portfolio Management Indicator 📊
A game-changing portfolio management tool designed to help traders stay on top of their positions and manage risk efficiently. This indicator combines detailed tracking, real-time analytics, and visual clarity to ensure traders are well-equipped for the dynamic world of financial markets.
📈 Key Features 💡
Track up to 14 positions with ease
Real-time Profit & Loss (P&L) updates and risk metrics
Visual representation of entry, stop-loss (SL), and target levels
Alerts for stop-loss breaches and target achievements
Comprehensive portfolio summaries for quick analysis
Customizable options to suit individual trading styles
🔍 Main Components ⚙️
📊 1. Position Tracking
Detailed position data: entry, stop-loss, target levels, and more
Real-time risk-reward ratios
Insights into position size and exposure percentages
Continuous updates on P&L in real-time
📉 2. Visual Indicators
Clear visual markers for entry, SL, and target prices
Price labels with detailed percentage changes
Indicators that show the current position's market status
💼 3. Portfolio Summary
Aggregate account values and exposure
Summarized P&L metrics across all positions
Risk management insights for better decision-making
Daily performance tracking to evaluate strategies
⚠️ 4. Alert System
Instant notifications for stop-loss breaches
Alerts when target prices are hit
Alerts operate for the current chart symbol
⚡ Customization Options 🎨
Show or hide specific data columns
Adjust the table's position and size for better visibility
Personalize color schemes and text styles
Switch between full portfolio view and single symbol focus
📱 How to Use 📝
Input your positions in the indicator's settings
Enable or disable specific positions dynamically
Customize display preferences to your liking
Set up alerts for proactive risk management
Monitor all your trading activities in one comprehensive dashboard
📌 Important Notes ℹ️
Compatible with any trading symbol
Updates seamlessly during market hours
Alerts are specific to the currently active chart symbol
Maximum capacity: 14 simultaneous positions
Created by: @AfnanTAjuddin
⚠️ Disclaimer ⚠️
This indicator is a tool for informational purposes only. Ensure all calculations are verified and consult a financial professional before making investment decisions.
🎯 "Stay disciplined, trade smart, and let data guide your decisions." 📊
