Swing Traders Panel: Beta RVOL ATR Market Sector FnG ImtiazHA compact decision-support panel for swing traders combining volatility, relative volume, market & sector regime, and a 3-zone Fear/Greed filter to improve trade context and risk management.
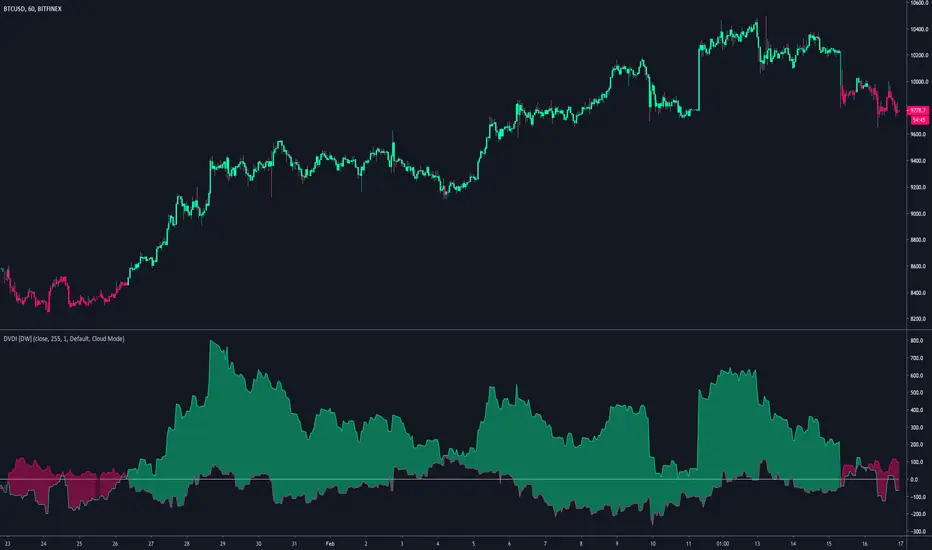
Indice di volume positivo (PVI)

Volume essential parameters overlayVolume EPO – Essential Volume Parameters Overlay
1. Motivation and design philosophy
Volume EPO is designed as a conceptual overlay rather than a self contained trading system. The main idea behind this script is to take complex, foundational market concepts out of heavy, menu driven strategies and express them as lightweight, independent layers that sit on top of any chart or indicator.
In many TradingView scripts, a single strategy tries to handle everything at once: signal logic, risk settings, visual cues, multi timeframe controls, and conceptual explanations. This usually leads to long input menus, performance issues, and difficult maintenance. The architectural approach behind Volume EPO is the opposite: keep the core strategy lean, and move the explanation and measurement of key concepts into dedicated overlays.
In this framework, Volume EPO is the base layer for the concept of volume. It does not decide anything about entries or exits. Instead, it exposes and clarifies how different definitions of volume behave candle by candle. Other layers or strategies can then build on top of this understanding.
2. What Volume EPO does
Volume EPO focuses on four essential volume parameters for each bar:
- Buy volume - Sell volume - Total volume - Delta volume (the difference between buy and sell volume)
The script presents these parameters in a compact heads up display (HUD) table that can be positioned anywhere on the chart. It is designed to be visually minimal, language aware, and usable on top of any other indicator or price action without cluttering the view.
The indicator does not output signals, alerts, arrows, or strategy entries. It is a descriptive and educational tool that shows how volume is distributed, not a prescriptive tool that tells the trader what to do.
3. Two definitions of volume
A central theme of this script is that there is more than one way to define and interpret “volume” inside a single candle. Volume EPO implements and clearly separates two different approaches:
- A geometric, candle based approximation that uses only OHLC and volume of the current bar. - An intrabar, data driven definition that uses lower timeframe up and down volume when it is available.
The user can switch between these modes via the calculation method input. The mode is prominently shown inside the on chart table so that the context is always explicit.
3.1 Geometry mode (Source File, approximate)
In Geometry mode, Volume EPO works only with the current bar’s OHLC values and total volume. No lower timeframe data is required.
The candle’s range is defined as high minus low. If the range is positive, the position of the close inside that range is used as a simple model for how volume might have been distributed between buyers and sellers:
- The closer the close is to the high, the more of the total volume is attributed to the buying side. - The closer the close is to the low, the more of the total volume is attributed to the selling side. - In a rare case where the bar has no price range (for example a flat or doji bar), total volume is split evenly between buy and sell volume.
From this model, the script derives:
- Buy volume (approximated) - Sell volume (approximated) - Total volume (as reported by the bar) - Delta volume as the difference between buy and sell volume
This approach is intentionally labeled as “Geometry (Approx)” in the HUD. It is a theoretical reconstruction based solely on the candle’s geometry and total volume, and it is always available on any market or timeframe that provides OHLCV data.
3.2 Intrabar mode (Precise)
In Intrabar mode, Volume EPO uses the TradingView built in library for up and down volume on a user selected lower timeframe. Instead of inferring volume from the shape of the candle, it reads the underlying lower timeframe data when that data is accessible.
The script requests up and down volume from a lower timeframe such as 15 seconds, using the official TA library functions. The results are then interpreted as follows:
- Buy volume is taken as the absolute value of the up volume. - Sell volume is taken as the absolute value of the down volume. - Total volume is the sum of buy and sell volume. - Delta volume is provided directly by the library as the difference between up and down volume.
If valid lower timeframe data exists for a bar, the bar is counted as covered by Intrabar data. If not, that bar is marked as invalid for this precise calculation and is excluded from the covered count.
This mode is labeled “Precise” in the HUD, together with the selected lower timeframe, because it is anchored in actual intrabar data rather than in a geometric model. It provides a closer view of how buying and selling pressure unfolded inside the bar, at the cost of requiring more data and being dependent on the availability of that data.
4. Coverage, lookback, and what the numbers mean
The top part of the HUD reports not only which volume definition is active, but also an additional line that describes the effective coverage of the data.
In Intrabar (Precise) mode, the script displays:
- “Scanned: N Bars”
Here, N counts how many bars since the indicator was loaded have successfully received valid lower timeframe delta data. It is a measure of how much of the visible history has been truly covered by intrabar information, not a lookback window in the sense of a rolling calculation.
In Geometry mode, the script displays:
- “Lookback: L Bars”
In this extracted layer, the lookback value L is purely descriptive. It does not change how the current bar’s volume is computed, and it is not used in any iterative or statistical calculation inside this script. It is meant as a conceptual label, for example to keep the volume layer consistent with a broader framework where lookback length is a structural parameter.
Summarizing these two fields:
- Scanned tells you how many bars have been processed using real intrabar data. - Lookback is a descriptive parameter in Geometry mode in this specific overlay, not a direct driver of the computations.
5. The HUD layout on the chart
The on chart table is intentionally compact and structured to be read quickly:
- Header: a title identifying the overlay as Volume EPO. - Mode line: explicitly states whether the script is in Precise or Geometry mode, and for Precise mode also shows the lower timeframe used. - Coverage line: - In Precise mode, it shows “Scanned: N Bars”. - In Geometry mode, it shows “Lookback: L Bars”. - Volume block: - A line for buy and sell volume, marked with clear directional symbols. - A line for total volume and the absolute delta, accompanied by the sign of the delta. - Numeric formatting uses human friendly suffixes (for example K, M, B) to keep the display readable. - Footer: the current symbol and a time stamp, adjusted by a user selectable timezone offset so that the HUD can be aligned with the trader’s local time reference.
The table can be positioned anywhere on the chart and resized via inputs, and it supports multiple color themes and languages in order to integrate cleanly into different chart layouts.
6. How to use Volume EPO in practice
Volume EPO is meant to be read together with price action and other tools, not in isolation. Typical uses include:
- Studying how often a strong directional candle is actually supported by dominant buy or sell volume. - Comparing the behavior of delta volume between Geometry and Intrabar definitions. - Building a personal intuition for how intrabar data refines or contradicts the simple candle based approximation. - Feeding these insights into separate, lean strategy scripts that do not need to carry the full explanatory logic of volume inside them.
Because it is an overlay layer, Volume EPO can be stacked with other custom indicators without adding new signals or complexity to their logic. It simply adds a clear and consistent view of volume behavior on top of whatever the trader is already watching.
7. Educational and non signalling nature
Finally, it is important to stress that Volume EPO is not a trading system, not a signal generator, and not financial advice. The script does not tell the user when to enter or exit. It only reports how different definitions of volume describe the current bar.
Deciding whether to trade, how to trade, and which risk parameters to use remains entirely with the user and with their own strategy. Volume EPO provides context and clarity around the concept of volume so that those decisions can be informed by a better understanding of how buying and selling pressure is structured inside each candle.
Note: Even on lower timeframes, every reconstruction of volume remains an approximation, except at the true single tick level. However, the closer the chosen lower timeframe is to a one tick stream, the more accurately it can reflect the underlying order flow and balance between buying and selling pressure.

Volume with VSAThis script is designed to identify meaningful volume activity using the principles of Volume Spread Analysis (VSA). By focusing on the relationship between price movement and volume, it highlights areas where professional traders may be active. The tool becomes especially powerful when applied to higher timeframes such as 15-minute or 30-minute charts. On these larger intervals, market noise is reduced, allowing true supply and demand imbalances to stand out more clearly. As a result, the zones and signals generated by the script tend to be more reliable and consistent. The combination of structural analysis and volume behaviour helps traders pinpoint potential trend reversals, continuation patterns, and breakout strength with greater accuracy. Overall, this script enhances decision-making by offering a clearer view of genuine market participation, making it well-suited for swing traders, intraday strategists, and anyone looking to understand volume dynamics more effectively.

Volume Delta PROThis indicator show delta moves and producing it in a way that you can see what MADE the delta - buyers or sellers.
Important delta candles are also marked.
I also shows average delta and can be adjusted by reading data from lower time frames.

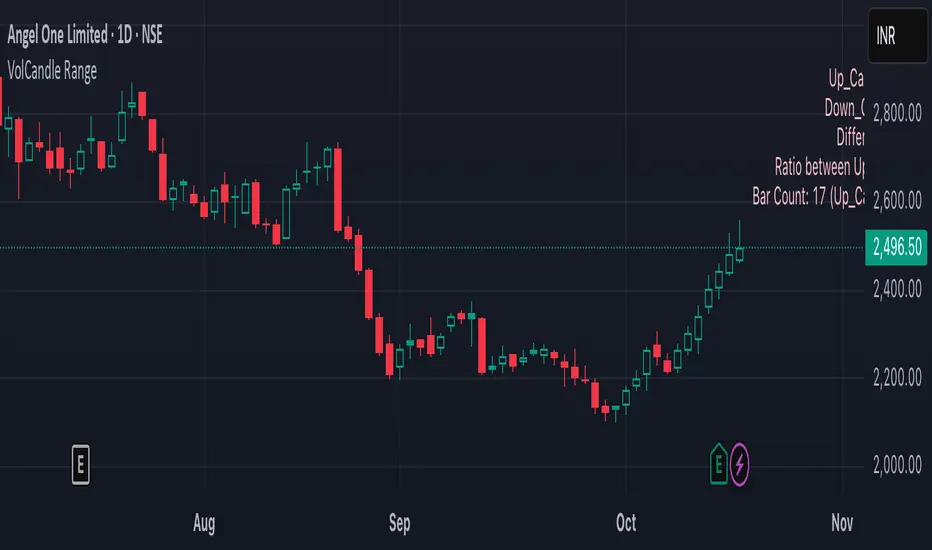
VolCandle_Start_End BarsThe “VolCandle_Start_End Bars” Pine Script is a custom TradingView indicator designed to calculate and display volume-based candle statistics between two user-defined time points. It visually summarizes trading activity across a specific date range by comparing up-candle and down-candle volumes.
Functionality
The script allows users to select a start and end bar (dates) using the input fields “Select starting Bar” and “Select ending Bar.” It then examines all candles within this range to calculate:
Total volume for up candles (candles where the close is higher than the previous candle).
Total volume for down candles (candles where the close is lower than the previous candle).
Difference and ratio between up and down volumes.
Count of up and down candles within the period.
Calculation Logic
A loop checks each bar's closing price and compares it with the previous one.
For every matching bar within the chosen time range:
If the close increases → its volume is added to up volume.
If the close decreases → its volume is added to down volume.
The process continues for up to 1000 historical bars, counting each bar type and accumulating total volumes.
Display and Labeling
The script calculates an appropriate label position using recent highs and lows, then dynamically creates a label on the chart showing:
Up_Candles volume
Down_Candles volume
Volume difference and ratio
Total bar count with up/down candle counts
The text is displayed in a soft pink tone using the label.new() function for visual clarity.
Utility
This indicator helps traders easily analyze buying vs. selling volume pressure across custom time intervals. It is particularly useful for comparing sentiment in specific trading phases (for example, before and after a consolidation or breakout).
All computations are done locally on the chart — the indicator does not place trades or alter candles.
In short, this script provides a compact visual and statistical summary of market volume distribution between rising and falling candles in a chosen date window, offering insight into the dominant market force during that time range.
Advanced Volume Profile Pro Delta + POC + VAH/VAL# Advanced Volume Profile Pro - Delta + POC + VAH/VAL Analysis System
## WHAT THIS SCRIPT DOES
This script creates a comprehensive volume profile analysis system that combines traditional volume-at-price distribution with delta volume calculations, Point of Control (POC) identification, and Value Area (VAH/VAL) analysis. Unlike standard volume indicators that show only total volume over time, this script analyzes volume distribution across price levels and estimates buying vs selling pressure using multiple calculation methods to provide deeper market structure insights.
## WHY THIS COMBINATION IS ORIGINAL AND USEFUL
**The Problem Solved:** Traditional volume indicators show when volume occurs but not where price finds acceptance or rejection. Standalone volume profiles lack directional bias information, while basic delta calculations don't provide structural context. Traders need to understand both volume distribution AND directional sentiment at key price levels.
**The Solution:** This script implements an integrated approach that:
- Maps volume distribution across price levels using configurable row density
- Estimates delta (buying vs selling pressure) using three different methodologies
- Identifies Point of Control (highest volume price level) for key support/resistance
- Calculates Value Area boundaries where 70% of volume traded
- Provides real-time alerts for key level interactions and volume imbalances
**Unique Features:**
1. **Developing POC Visualization**: Real-time tracking of Point of Control migration throughout the session via blue dotted trail, revealing institutional accumulation/distribution patterns before they complete
2. **Multi-Method Delta Calculation**: Price Action-based, Bid/Ask estimation, and Cumulative methods for different market conditions
3. **Adaptive Timeframe System**: Auto-adjusts calculation parameters based on chart timeframe for optimal performance
4. **Flexible Profile Types**: N Bars Back (precise control), Days Back (calendar-based), and Session-based analysis modes
5. **Advanced Imbalance Detection**: Identifies and highlights significant buying/selling imbalances with configurable thresholds
6. **Comprehensive Alert System**: Monitors POC touches, Value Area entry/exit, and major volume imbalances
## HOW THE SCRIPT WORKS TECHNICALLY
### Core Volume Profile Methodology:
**1. Price Level Distribution:**
- Divides price range into user-defined rows (10-50 configurable)
- Calculates row height: `(Highest Price - Lowest Price) / Number of Rows`
- Distributes each bar's volume across price levels it touched proportionally
**2. Delta Volume Calculation Methods:**
**Price Action Method:**
```
Price Range = High - Low
Buy Pressure = (Close - Low) / Price Range
Sell Pressure = (High - Close) / Price Range
Buy Volume = Total Volume × Buy Pressure
Sell Volume = Total Volume × Sell Pressure
Delta = Buy Volume - Sell Volume
```
**Bid/Ask Estimation Method:**
```
Average Price = (High + Low + Close) / 3
Buy Volume = Close > Average ? Volume × 0.6 : Volume × 0.4
Sell Volume = Total Volume - Buy Volume
```
**Cumulative Method:**
```
Buy Volume = Close > Open ? Volume : Volume × 0.3
Sell Volume = Close ≤ Open ? Volume : Volume × 0.3
```
**3. Point of Control (POC) Identification:**
- Scans all price levels to find maximum volume concentration
- POC represents the price level with highest trading activity
- Acts as significant support/resistance level
- **Developing POC Feature**: Tracks POC evolution in real-time via blue dotted trail, showing how institutional interest migrates throughout the session. Upward POC migration indicates accumulation patterns, downward migration suggests distribution, providing early trend signals before price confirmation.
**4. Value Area Calculation:**
- Starts from POC and expands up/down to encompass 70% of total volume
- VAH (Value Area High): Upper boundary of value area
- VAL (Value Area Low): Lower boundary of value area
- Expansion algorithm prioritizes direction with higher volume
**5. Adaptive Range Selection:**
Based on profile type and timeframe optimization:
- **N Bars Back**: Fixed lookback period with performance optimization (20-500 bars)
- **Days Back**: Calendar-based analysis with automatic timeframe adjustment (1-365 days)
- **Session**: Current trading session or custom session times
### Performance Optimization Features:
- **Sampling Algorithm**: Reduces calculation load on large datasets while maintaining accuracy
- **Memory Management**: Clears previous drawings to prevent performance degradation
- **Safety Constraints**: Prevents excessive memory usage with configurable limits
## HOW TO USE THIS SCRIPT
### Initial Setup:
1. **Profile Configuration**: Select profile type based on trading style:
- N Bars Back: Precise control over data range
- Days Back: Intuitive calendar-based analysis
- Session: Real-time session development
2. **Row Density**: Set number of rows (30 default) - more rows = higher resolution, slower performance
3. **Delta Method**: Choose calculation method based on market type:
- Price Action: Best for trending markets
- Bid/Ask Estimate: Good for ranging markets
- Cumulative: Smoothed approach for volatile markets
4. **Visual Settings**: Configure colors, position (left/right), and display options
### Reading the Profile:
**Volume Bars:**
- **Length**: Represents relative volume at that price level
- **Color**: Green = net buying pressure, Red = net selling pressure
- **Intensity**: Darker colors indicate volume imbalances above threshold
**Key Levels:**
- **POC (Blue Line)**: Highest volume price - major support/resistance
- **VAH (Purple Dashed)**: Value Area High - upper boundary of fair value
- **VAL (Orange Dashed)**: Value Area Low - lower boundary of fair value
- **Value Area Fill**: Shaded region showing main trading range
**Developing POC Trail:**
- **Blue Dotted Lines**: Show real-time POC evolution throughout the session
- **Migration Patterns**: Upward trail indicates bullish accumulation, downward trail suggests bearish distribution
- **Early Signals**: POC movement often precedes price movement, providing advance warning of institutional activity
- **Institutional Footprints**: Reveals where smart money concentrated volume before final POC establishment
### Trading Applications:
**Support/Resistance Analysis:**
- POC acts as magnetic price level - expect reactions
- VAH/VAL provide intermediate support/resistance levels
- Profile edges show areas of low volume acceptance
**Developing POC Analysis:**
- **Upward Migration**: POC moving higher = institutional accumulation, bullish bias
- **Downward Migration**: POC moving lower = institutional distribution, bearish bias
- **Stable POC**: Tight clustering = balanced market, range-bound conditions
- **Early Trend Detection**: POC direction change often precedes price breakouts
**Entry Strategies:**
- Buy at VAL with POC as target (in uptrends)
- Sell at VAH with POC as target (in downtrends)
- Breakout plays above/below profile extremes
**Volume Imbalance Trading:**
- Strong buying imbalance (>60% threshold) suggests continued upward pressure
- Strong selling imbalance suggests continued downward pressure
- Imbalances near key levels provide high-probability setups
**Multi-Timeframe Context:**
- Use higher timeframe profiles for major levels
- Lower timeframe profiles for precise entries
- Session profiles for intraday trading structure
## SCRIPT SETTINGS EXPLANATION
### Volume Profile Settings:
- **Profile Type**: Determines data range for calculation
- N Bars Back: Exact number of bars (20-500 range)
- Days Back: Calendar days with timeframe adaptation (1-365 days)
- Session: Trading session-based (intraday focus)
- **Number of Rows**: Profile resolution (10-50 range)
- **Profile Width**: Visual width as chart percentage (10-50%)
- **Value Area %**: Volume percentage for VA calculation (50-90%, 70% standard)
- **Auto-Adjust**: Automatically optimizes for different timeframes
### Delta Volume Settings:
- **Show Delta Volume**: Enable/disable delta calculations
- **Delta Calculation Method**: Choose methodology based on market conditions
- **Highlight Imbalances**: Visual emphasis for significant volume imbalances
- **Imbalance Threshold**: Percentage for imbalance detection (50-90%)
### Session Settings:
- **Session Type**: Daily, Weekly, Monthly, or Custom periods
- **Custom Session Time**: Define specific trading hours
- **Previous Sessions**: Number of historical sessions to display
### Days Back Settings:
- **Lookback Days**: Number of calendar days to analyze (1-365)
- **Automatic Calculation**: Script automatically converts days to bars based on timeframe:
- Intraday: Accounts for 6.5 trading hours per day
- Daily: 1 bar per day
- Weekly/Monthly: Proportional adjustment
### N Bars Back Settings:
- **Lookback Bars**: Exact number of bars to analyze (20-500)
- **Precise Control**: Best for systematic analysis and backtesting
### Visual Customization:
- **Colors**: Bullish (green), Bearish (red), and level colors
- **Profile Position**: Left or Right side of chart
- **Profile Offset**: Distance from current price action
- **Labels**: Show/hide level labels and values
- **Smooth Profile Bars**: Enhanced visual appearance
### Alert Configuration:
- **POC Touch**: Alerts when price interacts with Point of Control
- **VA Entry/Exit**: Alerts for Value Area boundary interactions
- **Major Imbalance**: Alerts for significant volume imbalances
## VISUAL FEATURES
### Profile Display:
- **Horizontal Bars**: Volume distribution across price levels
- **Color Coding**: Delta-based coloring for directional bias
- **Smooth Rendering**: Optional smoothing for cleaner appearance
- **Transparency**: Configurable opacity for chart readability
### Level Lines:
- **POC**: Solid blue line with optional label
- **VAH/VAL**: Dashed colored lines with value displays
- **Extension**: Lines extend across relevant time periods
- **Value Area Fill**: Optional shaded region between VAH/VAL
### Information Table:
- **Current Values**: Real-time POC, VAH, VAL prices
- **VA Range**: Value Area width calculation
- **Positioning**: Multiple table positions available
- **Text Sizing**: Adjustable for different screen sizes
## IMPORTANT USAGE NOTES
**Realistic Expectations:**
- Volume profile analysis provides structural context, not trading signals
- Delta calculations are estimations based on price action, not actual order flow
- Past volume distribution does not guarantee future price behavior
- Combine with other analysis methods for comprehensive market view
**Best Practices:**
- Use appropriate profile types for your trading style:
- Day Trading: Session or Days Back (1-5 days)
- Swing Trading: Days Back (10-30 days) or N Bars Back
- Position Trading: Days Back (60-180 days)
- Consider market context (trending vs ranging conditions)
- Verify key levels with additional technical analysis
- Monitor profile development for changing market structure
**Performance Considerations:**
- Higher row counts increase calculation complexity
- Large lookback periods may affect chart performance
- Auto-adjust feature optimizes for most use cases
- Consider using session profiles for intraday efficiency
**Limitations:**
- Delta calculations are estimations, not actual transaction data
- Profile accuracy depends on available price/volume history
- Effectiveness varies across different instruments and market conditions
- Requires understanding of volume profile concepts for optimal use
**Data Requirements:**
- Requires volume data for accurate calculations
- Works best on liquid instruments with consistent volume
- May be less effective on very low volume or exotic instruments
This script serves as a comprehensive volume analysis tool for traders who need detailed market structure information with integrated directional bias analysis and real-time POC development tracking for informed trading decisions.

Volume Pressure Gauge + Volume %Volume Pressure Gauge and Volume Percentage Indicator – Pine Script Guide
This indicator provides a simplified, real-time visualization of both volume pressure (buy vs. sell activity) and today’s trading volume in comparison to historical averages. It is designed to help traders assess whether buyers or sellers dominate the current session and whether today’s volume is significant relative to recent behaviour.
________________________________________
Key Functional Segments
1. Inputs and Configuration
Users can configure the length of the Simple Moving Average (SMA) used to calculate average volume, set the position of the gauge table on the chart, and toggle the visibility of the volume pressure display. This allows flexibility in integrating the tool with various trading styles and chart layouts.
2. Volume Data Calculations
The indicator calculates three key volume metrics:
• volToday: The current day’s volume.
• volAvg: The average volume over the user-defined SMA period (default is 20 bars).
• volPct: The current volume as a percentage of the average.
This enables traders to quickly recognize whether current trading activity is above or below normal, which can be a precursor to potential trend strength or weakness.
3. Volume Pressure Calculation
The script estimates buying and selling pressure based on price movement and volume. It distributes volume into upward (buy) and downward (sell) segments and expresses them as percentages of the total volume. This gives an immediate sense of whether bulls or bears are more active in the current session.
4. Visual Representation (Progress Bars)
The indicator renders a simplified visual gauge using horizontal bar segments (pseudo-bars) to reflect the proportion of buy and sell pressure. The length of each bar correlates with the strength of pressure from buyers or sellers, helping users assess dominance without analyzing candlestick behavior in depth.
5. Table Display
A compact table is drawn on the chart showing:
• Buy pressure percentage and corresponding bar.
• Sell pressure percentage and corresponding bar.
• Volume percentage compared to the recent average.
This format makes it easy to evaluate volume dynamics at a glance, without cluttering the price chart or relying on separate overlays.
________________________________________
How Traders Benefit from This Indicator
• Momentum Shift Detection: Early signs of trend reversal can be observed when volume pressure flips direction.
• Breakout Validation: High volume combined with dominant pressure supports the credibility of breakout moves.
• False Move Avoidance: If price moves on low volume or mixed pressure, traders can avoid low-probability entries.
• Market Context Awareness: Users can assess whether a day is behaving normally in terms of participation or is unusually quiet or aggressive.
________________________________________
Basic Usage Guide
1. Add the script to your TradingView chart and set your preferred SMA length for volume comparison.
2. Customize the table’s position using the X and Y settings for clarity and alignment.
3. Interpret the outputs:
o A higher red bar indicates dominant sell pressure.
o A higher green bar indicates dominant buy pressure.
o Volume % above 100% suggests above-average activity, while values below 100% may imply low conviction.
4. Apply to trading decisions:
o High buy pressure and high volume may indicate a strong long opportunity.
o High sell pressure and high volume may support short setups.
o Low volume or conflicting signals may call for caution.
5. Combine with other tools such as trend indicators, support/resistance zones, or price action patterns for more reliable trade setups.
________________________________________
Practical Example
• Sell Pressure: 70% → Suggests strong seller control; potential for short setups.
• Buy Pressure: 30% → Weak buying interest; long trades may carry risk.
• Volume Percentage: 120% → Indicates a surge in participation; movement may have greater validity.
________________________________________
Tips for New Traders
• Use this indicator as a confirmation tool rather than a standalone strategy.
• Begin on higher timeframes (4-hour or daily) to develop familiarity.
• Compare multiple examples to identify reliable patterns over time.
• Always incorporate proper risk management, including stop losses.
________________________________________
Disclaimer from aiTrendview
This indicator is intended solely for educational and informational use. It does not constitute investment advice, trade signals, or financial recommendations. aiTrendview and its affiliates are not liable for any trading losses incurred through use of this tool. All trading involves risk. Past performance of any indicator does not guarantee future results. Users should conduct independent research and consult with a certified financial advisor before making any trading decisions.

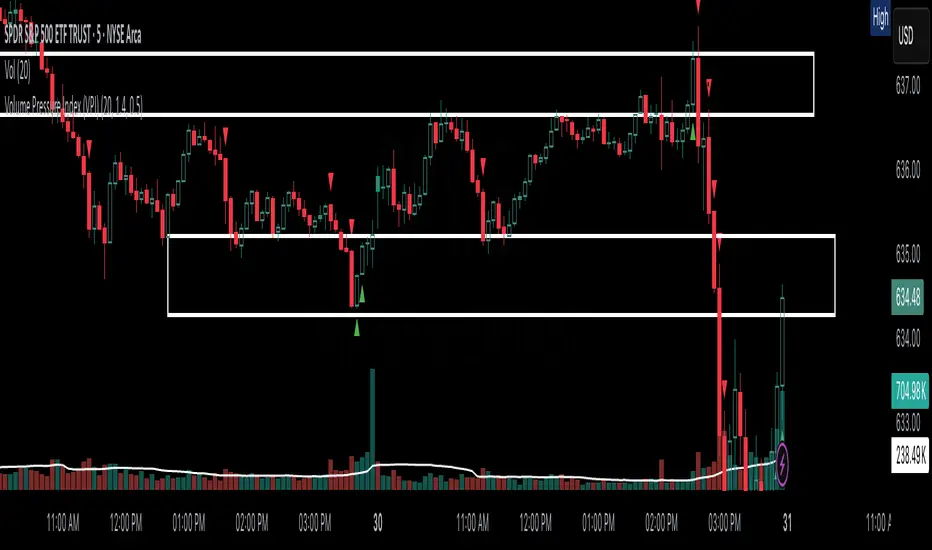
Volume Pressure Index (VPI)Volume Pressure Index Pro (VPI Pro) is a precision-tuned volume signal detector designed to isolate true buying/selling aggression and filter out noise.
It evaluates:
✅ Volume pressure surges (based on relative volume)
✅ Price action alignment (strong-bodied candles, no wicks)
✅ Trend context (EMA- or VWAP-based filtering)
✅ Candle positioning (e.g., closes near highs/lows to infer aggression)
✅ Zone-based confirmation (optional VWAP or custom levels)
Signals only trigger when multiple layers of confirmation align, minimizing false positives while preserving responsiveness to market pressure shifts.
⚙️ Core Components
VPI Calculation: Detects abnormal volume behavior tied to directional closes.
Aggression Estimator: Uses candle structure and location to infer pressure.
Relative Volume Spike Filter: Ensures only significant activity is considered.
Contextual Filters: Incorporates trend direction and location relative to key zones (EMA, VWAP, etc).
Visual Markers: Bullish and bearish pressure are clearly marked on chart.
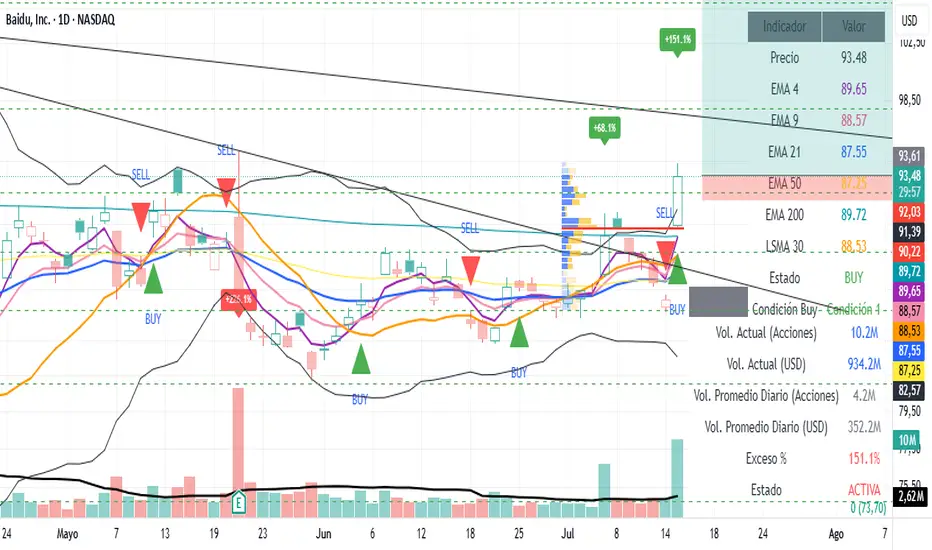
Volume Spike AlertIndicator Features:
📊 Core Functionalities:
Exceptional Volume Detection:
Calculates volume in USD (volume × price)
Compares it against a 90-day average (3 months)
Configurable from 1 to 252 days
Visual Signals:
Green labels for bullish candles with high volume
Red labels for bearish candles with high volume
Displays excess percentage (e.g., +45.2%)
Dual Alert System:
AlertCondition: For manual alert configuration in TradingView
Alert(): Automated alerts with detailed information
⚙️ Available Settings:
Average Period: 1–252 days (default: 90 days)
Enable/Disable Alerts: Configurable checkbox
Show/Hide Labels: Visual control
Label Size: Tiny, Small, Normal, Large
Minimum Threshold: Minimum percentage required to trigger a signal
📋 Displayed Information:
On Labels:
Excess percentage (e.g., +67.3%)
Color based on candle direction
In the Table:
Current volume in millions USD
Average volume in millions USD
Excess percentage
Alert status (ACTIVE/NORMAL)
Calculation period
In Alerts:
Candle type (BULLISH 🟢 / BEARISH 🔴)
Symbol and current price
Current volume vs. average
Timeframe used
day trading check indicatorDay Trading Check Indicator
By Trades per Minute · Creator: Trader Malik
Overview
The Day Trading Check Indicator is an on‐chart status panel that gives you a quick “go/no-go” snapshot of four key metrics—MACD, VWAP, Float, and Bearish Sell-Off—directly in TradingView’s top-right corner. It’s designed for fast decision-making during high-velocity intraday sessions, letting you instantly see whether each metric is “bullish” (green) or “bearish” (red), plus live float data.
What It Shows
Column Description
Metric The name of each metric: MACD, VWAP, Float, Bearish Sell-Off
Status/Value A color-coded status (“GREEN”/“RED” or “YES”/“NO”) or the float value formatted in K/M/B
Metrics & Calculations
MACD (1-Minute)
Calculation: Standard MACD using EMA (12) – EMA (26) with a 9-period signal line, all fetched from the 1-minute timeframe via request.security().
Status:
GREEN if MACD ≥ Signal
RED if MACD < Signal
VWAP (Session-Anchored)
Calculation: Built-in session VWAP (ta.vwap(close)) resets each new trading session.
Status:
GREEN if current price ≥ VWAP
RED if current price < VWAP
Float
Calculation: Retrieves syminfo.shares_outstanding_float (total float), then scales it into thousands (K), millions (M), or billions (B), e.g. “12.3 M.”
Display: Always shown as the absolute float value, white on semi-transparent black.
Bearish Sell-Off
Calculation: Checks the last five 1-minute bars for any “high-volume down” candle (volume above its 20-bar SMA and close < open).
Status:
YES if at least one such bar occurred in the past 5 minutes
NO otherwise
Key Features
Dynamic Table: Automatically shows only the metrics you enable via the Display Options group.
Size Selector: Choose Small, Medium, or Large text for easy visibility.
Clean Styling: Distinct header row with custom background, consistent row shading, centered status text, and a subtle gray border.
Lightweight Overlay: No cluttering plots—just a concise status panel in the corner.
Published by Trader Malik / Trades per Minute
Version: Pine Script v5

Volume Sentiment Pro (NTY88)Volume Sentiment Edge: Smart Volume & RSI Trading System
Description:
Unlock the power of volume-driven market psychology combined with precision RSI analysis! This professional-grade indicator identifies high-probability trading opportunities through:
🔥 Key Features
1. Smart Volume Spike Detection
Auto-detects abnormal volume activity with adaptive threshold
Clear spike labels & multi-timeframe confirmation
RSI-Powered Sentiment Analysis
Real-time Bullish/Bearish signals based on RSI extremes
Combined volume-RSI scoring system (Strong Bull/Bear alerts)
2. Professional Dashboard
Instant sentiment status table (bottom-right)
Color-coded momentum strength visualization
Customizable themes for all chart styles
3. Institutional-Grade Tools
HTF (Daily/Weekly) volume confirmation
EMA trend-filtered momentum signals
Spike-to-Threshold ratio monitoring
4. Trade-Ready Alerts
Pre-configured "Bullish Setup" (Spike + Oversold RSI)
"Bearish Setup" (Spike + Overbought RSI)
Why Traders Love This:
✅ Real-Time Visual Alerts - SPIKE markers above bars + table updates
✅ Adaptive Thresholds - Self-adjusting to market volatility
✅ Multi-Timeframe Verification - Avoid false signals with HTF confirmation
✅ Customizable UI - 10+ color settings for perfect chart integration
Usage Scenarios:
Day Traders: Catch volume surges during key sessions
Swing Traders: Confirm reversals with RSI extremes
All Markets: Works equally well on stocks, forex & crypto
Confirmation Tool: Combine with your existing strategy
Sample Setup:
"Enter long when:
5. RED SPIKE label appears
Table shows 'Oversold RSI'
Momentum status turns 'Bullish'
Volume exceeds daily average (Confirmed)"
📈 Try Risk-Free Today!
Perfect for traders who want:
Clean, non-repainting signals
Institutional-level volume analysis
Professional visual feedback
Customizable trading rules
⚠️ Important: Works best on 15m-4h timeframes. Combine with price action for maximum effectiveness.
📜 Legal Disclaimer
By using this indicator, you agree to the following terms:
Not Financial Advice
This tool provides technical analysis only. It does NOT constitute investment advice, financial guidance, or solicitation to trade.
High Risk Warning
Trading financial instruments carries substantial risk. Past performance ≠ future results. Never risk capital you cannot afford to lose.
No Guarantees
Signals are based on historical data and mathematical models. Market conditions may change rapidly, rendering previous patterns ineffective.
User Responsibility
You alone bear 100% responsibility for trading decisions. We expressly disclaim liability for any profit/loss resulting from this tool's use.
Professional Consultation
Always consult a licensed financial advisor before taking positions. This tool should NEVER be used as sole decision-making criteria.
Educational Purpose
This indicator is provided "as is" for informational/educational use only. No representation is made about its accuracy or completeness.
Third-Party Data
We do not verify exchange data accuracy. Use signals at your own discretion after independent verification.

Volume & Price Counter**User Guide for Volume & Price Counter (Candle Structure)**
### 1. Introduction to Volume & Price Counter
The **Volume & Price Counter** (Candle Structure) is a momentum analysis indicator that helps identify which side—buyers or sellers—is dominating the market by counting candles based on the combination of volume and price movement.
The indicator classifies candles into 4 groups:
- **Volume Up, Price Up (Vol ↑ & Price ↑)** – Indicates strong buying pressure.
- **Volume Down, Price Up (Vol ↓ & Price ↑)** – Price is rising but buying momentum is weakening.
- **Volume Up, Price Down (Vol ↑ & Price ↓)** – Indicates strong selling pressure.
- **Volume Down, Price Down (Vol ↓ & Price ↓)** – Price is falling but selling momentum is weakening.
---
### 2. How the Indicator Works
The Volume & Price Counter calculates the number of each candle type over a specific time period to determine which side is currently in control:
- **Green Background**: When the total of (Vol ↑ & Price ↑) + (Vol ↓ & Price ↑) is greater than the total of (Vol ↑ & Price ↓) + (Vol ↓ & Price ↓) → Buyers are in control.
- **Red Background**: When the total of (Vol ↑ & Price ↓) + (Vol ↓ & Price ↓) is greater than the total of (Vol ↑ & Price ↑) + (Vol ↓ & Price ↑) → Sellers are in control.
---
### 3. How to Use the Indicator in Trading
**a) When the background is green**:
- The market is in an uptrend; consider buying during pullbacks to support zones.
- If the green background continues and the number of (Vol ↑ & Price ↑) candles dominates, the price may continue to rise.
- If the green background is present but there are many (Vol ↓ & Price ↑) candles, be cautious as buying strength may be fading.
**b) When the background is red**:
- The downtrend is prevailing; it's better to stay out or look for selling opportunities during pullbacks.
- If the red background continues with a high number of (Vol ↑ & Price ↓) candles, the price may continue to fall.
- If there are many (Vol ↓ & Price ↓) candles during a red background, selling pressure may be weakening—watch for reversal signals.
**c) When the background shifts from red to green**:
- This is a positive signal, indicating buyers are returning to the market.
- Additional volume confirmation is needed to validate a true uptrend.
**d) When the background shifts from green to red**:
- This warns of a potential trend reversal to the downside.
- If volume spikes during the red shift, consider closing long positions.
---
### 4. Combining Volume & Price Counter with Other Indicators
**Combine with support/resistance levels**:
If a green background appears at a strong support zone, it may signal a potential buying opportunity.

PVSRA Volume Suite with Volume DeltaPVSRA Volume Suite with Volume Delta
🔹 Overview
This indicator is a Volume Suite that enhances PVSRA (Price, Volume, Support, Resistance Analysis) by incorporating Volume Delta and AI-driven predictive alerts. It is designed to help traders analyze volume pressure, market trends, and price movements with color-coded visualizations.
📌 Key Features
PVSRA Volume Color Coding – Highlights vector candles based on extreme volume/spread conditions.
Volume Delta Analysis – Tracks buying/selling pressure using up/down volume data.
AI-Powered Predictive Alerts – Identifies potential trend shifts based on volume and trend context.
Volatility-Adjusted Thresholds – Dynamically adapts volume conditions based on ATR (Average True Range).
Customizable MA & Symbol Overrides – Allows traders to tweak settings for personalized market insights.
Debug & Diagnostic Labels – Shows statistical z-scores, thresholds, and volume dynamics.
How It Works
PVSRA Color Coding – The script classifies candles into four categories based on volume and spread analysis:
🔴 Red Vector → Extreme bearish volume/spread
🟢 Green Vector → Extreme bullish volume/spread
🟣 Violet Vector → Above-average bearish volume
🔵 Blue Vector → Above-average bullish volume
Volume Delta Calculation – Uses lower timeframe volume analysis to estimate up/down volume differentials.
Trend & Predictive Alerts – Combines EMA crossovers with statistical volume analysis to detect potential trend shifts.
Volatility Adaptation – Adjusts volume thresholds based on ATR, making signals more reliable in changing market conditions.
Custom Symbol Override – Fetches PVSRA data from a different instrument, useful for index-based volume analysis.
Customizable Inputs
PVSRA Color Settings – Modify candle color schemes for better visual clarity.
Volume Delta Colors – Customize delta volume body, wick, and border colors.
AI Settings – Tune z-score thresholds, lookback periods, and enable predictive alerts.
Symbol Overrides – Analyze volume from a different market or asset.
Moving Average (MA) Settings – Display a volume-based moving average for trend confirmation.
Important Notes
Works best on intraday timeframes where volume data is reliable.
Lower timeframe volume delta estimates might not be precise for all assets.
No guarantees of accuracy – Use alongside other confluence tools for decision-making.
Credits & Open-Source Notice
This script is based on PVSRA methodologies and integrates Volume Delta analysis. Special thanks to Traders Reality and TradingView for their contributions to volume-based analysis.

Daily Buy/Sell Volumeindicator that The Daily Buy/Sell Volume Indicator is a custom-built tool that helps traders track and visualize the buying and selling volumes throughout a trading day. This indicator separates the total volume into two categories:
1. Buy Volume: Calculated when the closing price is higher than the opening price for a given candle. This represents the volume of bullish (buy) activity for the day.
2. Sell Volume: Calculated when the closing price is lower than the opening price for a given candle. This represents the volume of bearish (sell) activity for the day.
Key Features:
• Buy/Sell Volume Calculation: The indicator tracks the buying and selling volumes based on the relationship between the open and close prices of each candle.
• Daily Reset: The indicator resets at the start of each trading day, providing fresh calculations for the daily buy and sell volumes.
• Visual Representation: The buy volume is shown with a green line, while the sell volume is displayed with a red line, making it easy to identify bullish and bearish activity over the course of the day.

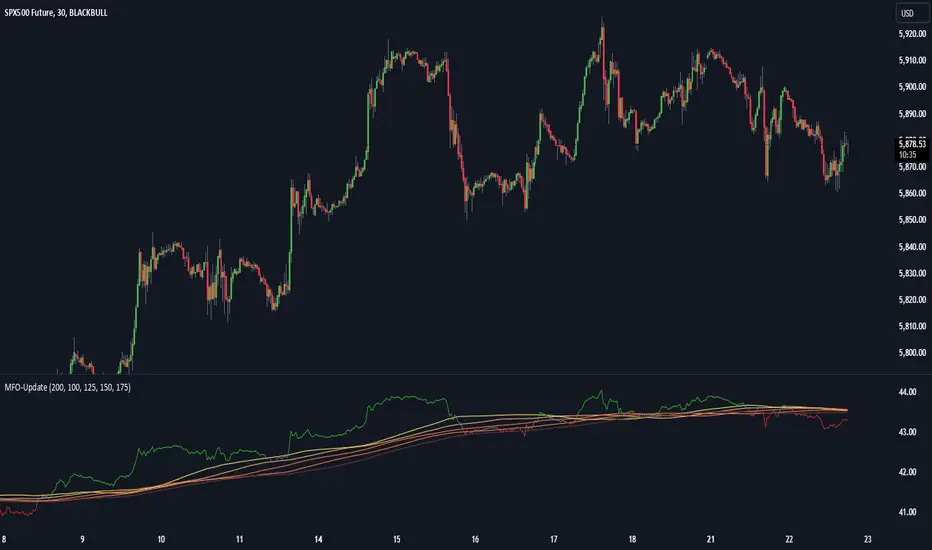
Momentum Flow OscillatorIndicator Overview: Momentum Flow Oscillator (MFO)
The Momentum Flow Oscillator (MFO) is a powerful tool for detecting shifts in market momentum. It combines a momentum-based calculation with a dynamic ribbon of moving averages to help traders identify trend reversals, continuations, and market consolidations. The MFO offers a clear visual representation of market conditions and assists traders in making informed decisions based on the relationship between momentum and its underlying trends.
The MFO line (green) is plotted alongside a Base Line (black) and a series of moving averages (ribbon). The ribbon is composed of five moving averages of different lengths, which allow traders to spot trends, momentum shifts, and potential trade opportunities. It is important to note that the ribbon tends to be a slower-moving component of the indicator, providing long-term trend signals rather than quick, reactive signals.
Components of the Indicator:
Momentum Flow Index (MFI):
This green line is the core of the indicator, representing market momentum derived from price and volume action. It reacts to changes in market dynamics and helps identify periods of strength and weakness.
Base Line (Black Line):
The black line is a 200-period moving average of the momentum flow. This acts as a dynamic support/resistance level for the MFI, smoothing out the price action over a longer period and providing a clearer trend signal.
Moving Averages Ribbon:
The ribbon is composed of five moving averages with different periods (100, 125, 150, 175, and 200). These moving averages create a visual "ribbon" that helps identify trends and consolidations, allowing traders to visualize the market’s momentum over different time frames.
The ribbon acts as a slower-moving indicator, helping to confirm long-term trends. Traders should keep in mind that the ribbon provides signals with a lag, making it ideal for trend-following rather than quick, short-term trades.
How to Use the Momentum Flow Oscillator (MFO):
1. Bullish Momentum Signals:
When the MFI (green line) crosses above the Base Line and the SMA ribbon, it indicates increasing momentum in the market. This signal is particularly strong when the MFI stays above the ribbon for an extended period.
Trade Example: Traders can use this as a buy signal when the MFI crosses above the ribbon, indicating that momentum is shifting to the upside. If the ribbon starts fanning out, it suggests the market is trending strongly upward, which may support a long position.
2. Bearish Momentum Signals:
When the MFI crosses below the Base Line and the SMA ribbon, it signals decreasing momentum. This is a bearish sign, indicating that the market may be preparing for a downturn.
Trade Example: A trader can use the cross below the ribbon as a sell signal or consider entering a short position when momentum weakens. If the ribbon fans out in a downward direction, it suggests the market is trending lower, and a short position may be warranted.
3. Neutral or Caution Signals:
When the MFI fluctuates within the SMA ribbon or crosses in and out frequently, the market may be in a consolidation phase or range-bound. In this situation, the trend is uncertain, and momentum is not strong enough to break decisively in either direction.
Trade Example: Traders may want to avoid taking new positions when the MFI is moving sideways within the ribbon, as this indicates indecision in the market. Waiting for a breakout above or below the ribbon can provide clearer signals for trading.
4. Trend Confirmation with Ribbon Expansion:
When the SMA ribbon expands, it indicates strong momentum in the direction of the trend. A clear widening of the ribbon with the MFI above (bullish) or below (bearish) signals a strong, sustainable trend.
Trade Example: As the ribbon expands, it confirms the strength of the trend, and traders can use this as confirmation to either hold an existing position or add to it.
5. Reversal Signals from Ribbon Contraction:
When the SMA ribbon contracts or the MFI crosses back and forth over the Base Line, it signals a potential reversal or a weakening of the existing trend.
Trade Example: In these cases, traders might consider closing positions or preparing for a reversal, as the contraction often signals a potential breakout in the opposite direction.
Example of Using the MFO in Trading:
In the provided chart image, you can see the MFI moving below the Base Line and the SMA ribbon for an extended period. This indicates bearish momentum, and traders could use this signal to enter a short position or avoid long positions until the MFI shows signs of crossing back above the ribbon. When the MFI crosses above the ribbon, it can signal a potential bullish reversal, indicating it might be time to re-enter long positions or close short positions.
Additional Trading Tips:
Combine with Other Indicators: The MFO can be used in combination with other technical tools such as volume-based indicators, trendlines, or oscillators like RSI or MACD to confirm signals and increase accuracy.
Use Different Time Frames: Traders can apply the MFO on different time frames (e.g., daily, weekly) to capture both short-term and long-term trends. Crossovers in longer time frames provide stronger confirmation of trend direction.
Conservative Entry: For more conservative traders, waiting for the MFI to fully cross above or below the ribbon (rather than within it) can help filter out false signals and avoid entering trades during consolidation phases.
Conclusion:
The Momentum Flow Oscillator offers traders a versatile and visual approach to gauging market momentum and trend strength. By observing the interaction between the MFI and the SMA ribbon, traders can spot trend changes early, confirm existing trends, and stay out of choppy, sideways markets. Keep in mind that the ribbon is a slower-moving part of the indicator—perfect for trend-following strategies but less ideal for fast, reactive trades. Use this indicator to increase your confidence in your trading decisions and improve your ability to capture trends in the market.
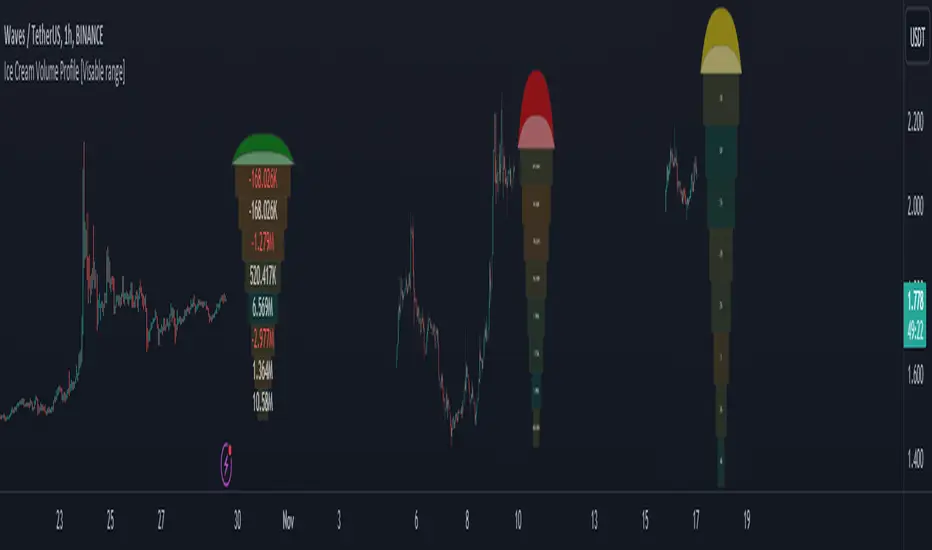
Ice Cream Volume Profile [Visible range]While exploring the new Pine Script feature, Polylines, I've created a fun project called the
Ice Cream Volume Profile for the visible range.
This fun project serves several purposes:
It displays the level at which the most trades (volume) occur.
It provides Delta volume information.
It counts how many times a bar closed within this level.
It assists in drawing support and resistance zones.
It aids in interpreting volume data.
The top part of the ice cream cone changes color as follows:
Green: When the bullish volume exceeds 55% of the total volume.
Red: When the bearish volume surpasses 55% of the total volume.
Yellow: When neither Green nor Red exceeds 55% of the total volume.
Polylines are an excellent feature that enables us to create even more intriguing visuals in Pine Script.
Volume moving Use with cryptocurrencies only is highly recommended.
If the volume in a currency is not visible, adjust the "Factor" number higher in the "Inputs" tab.
.
There will be a noticeable jump in the scale of the indicator if it is set too high.
The "Factor" is scaled at a baseline for SHIB prices. Any lower price scales than SHIB's will not show the volume.
i can be recommended this indicator day chart and use 20 moving average for this
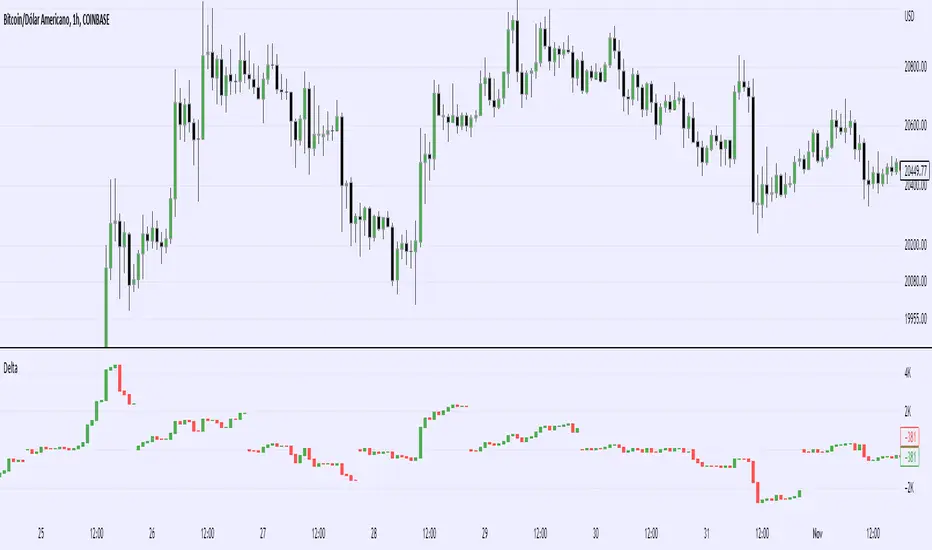
Real Cummulative Delta (New TV Function)Thanks to the new TradingView indicator Up/Down Volume, it is now possible to get accurate information on Agression (market buying vs market selling)
However, as they only provide the value of delta, I've made this indicator to show the cummulative value, in the form of candles.
It is great to detect divergences in the macro and in the micro scale (As in divergences in each candle and divergences in higher or lower tops or bottoms)
Hope you can make good use of it!
Positive Volume Index + Negative Volume IndexThis is my version of plotting the classic Positive Volume Index and Negative Volume Index. They can be wildly different sometimes and not very helpful with entry and exit points but I hope this helps clearly identify buy and sell signals. Buy when the indicator is green and sell when it is red
This was a special request so let me know when you want more scripts from me!

Volume Flow v3DepthHouse Volume Flow indicator is used to help determine trend direction strictly based on Negative and Positive volume data.
How to Read:
- Moving Average crossovers are used to help determine a possible trend change or retracement.
- The area cloud on the bottom is calculated by the difference of the moving averages. This could be used to help determine the trending volume strength.
- Bright colored volume bars are large volume spikes calculated by the x factor in the options.
Other changes:
- DepthHouse is going open source with numerous of its indicators. This is only one of many!
- Volume is now displayed without being altered for calculations.

DepthHouse Dual Volume Price Strength Index - VPSIDepthHouse Dual Volume Price Strength Index , or VPSI for short, is used to compare Bullish and Bearish Strength Indexes to help determine bull & bear dominance and exhaustion.
The Oscillator Displays both a Bullish and Bearish Strength Index.
It does this a via a series of calculations between price and volume .
A crossover of one or the other generally represents bullish or bearish dominance at that moment.
While their vertical placements represents the Bullish or Bearish Exhaustion level.
In this case it is read much like an RSI, levels over 70 generally represent exhaustion and levels under 30 represents the opposite.
Since these bands act very similar to a RSIs, this can be a great tool to spot divergences.
--Settings--
note: This indicator works best on higher time frames. I typically have it set to at least 1 hr.
Weighted vs. Non-Weighted
This changes the base calculations of the bands. the default is Weighted, which compares both Price and Volume. The Non-Weighted option removes price calculations, and makes it entirely volume based. Depending on what I am trading, I will switch between these two.
Length
Alters the band length. Default is 14.
Smoothing
This option smooths the VPSI bands. Especially comes in handy on lower time frames.
I prefer to leave this on with a smoothing between 2 and 3.
Built-in Alerts
I have 2 preset alerts made for this indicator.
"Bull Crossover" which is a crossover of the Bull and Bear bands
"Bear Crossover" which is a crossover of the Bear and Bull bands
Set these up by going over to the alerts tab and hitting the add alert button.
From there select this indicator as the main condition. The drop-down below should then contain these two alert options.
Try this indicator for FREE! Just leave a comment, visit my website, or feel free to send me a PM

Dual Volume Divergence Index [DW]This is an experimental variation of Paul L. Dysart's Positive Volume Index and Negative Volume Index that tracks the divergences between the PVI and its EMA, and the NVI and its EMA, then plots both together for comparison.
This tool can be used to identify trending price activity.