Pivot ProbabilitiesThis indicator gives traders historical probabilities based on how often price closed between any two pivot points.
What are the features? (as of release)
Get the historical statistics of how often price closed between any two pivot points.
Manually set your own pivot point resolution to any higher timeframe. So get the historical statistics from any pivot point you'd like.
Why would someone use this?
Reversion: We can more clearly see between which pivots price has highest probability of mean reversion towards.
Risk Management: By adding the statistics between groups of pivots, we can have a better idea of what the normal trading range for pivot points on any given asset should be. Making it easier to identify which pivot points are more likely to have extreme price movements go past.
Could you add an option to show probabilities for "x" style of pivot points?
I plan on adding more types of pivot points in the future. Check out if there are any updates to this indicator that include the pivots you're looking for. Otherwise, tell me what you're looking for in the comments here.
Why don't I see any pivot points on my chart when I apply this indicator?
This indicator does not draw pivot points on your chart. It strictly draws probabilities. So feel free to use it in combination with your favorite one.
Probability


test - delta distributiona test case for the KDE function on price delta.
the KDE function can be used to quickly check or confirm edge cases of the trading systems conditionals.

Chobotaru Indicator V1Now can be used by everyone.
Chobotaru Indicator has two functions:
1. Probability cloud, giving the probability of stock or future to move to a certain price.
2. Help traders understand where to take profit and where to put a stop-loss.
You don’t need knowledge about options trading, this indicator is for all traders/investors.
What does the indicator do?
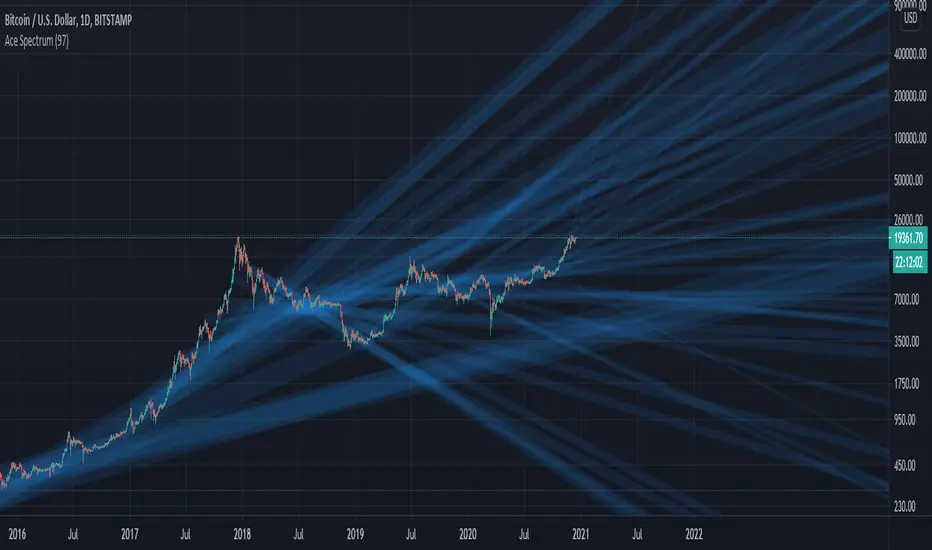
The indicator is based on the partial differential equations from the mathematical model of options, the Black-Scholes model. Using these equations and market parameters the indicator shows on the chart the probability that the stock/future will touch a certain price until a specific date.
How the indicator does it?
The algorithm solves the partial differential equations using the following values:
Instrument price - The current price of the stock or futures contract
The interest rate – default zero – can be found by searching in google: “U.S. Department of the treasury daily yield curve rates”, Use the 3-month value. This value has a low impact on the model so you only need to update it when there is a major change in the percentile. (Example, in January 2021 the 3 months “risk-free rate” is 0.08, you can enter 0 in the indicator.
Days to expire (minus trading holidays) – You need to choose an option and take from it the other values that are needed. We recommend taking options that close to 30 days, but it is the user choice.
Example: On the 22 of January 2021, PLTR has an option that has 35 days left. The option will expire on the 26 of February 2021, if there are trading holidays like in this case, the user needs to subtract them, on the 15 of February we have Washington's Birthday, the input is 35-1=34.
Implied volatility - Annualized asset price volatility , specific as a positive decimal number. IV 10% => input 0.1, you can find it in the option chain, if you don’t know what it is, you can ask your broker where you can find it on your trading platform. For example, the IV of PLTR on the 22 of January 2021 is 120.67% the input is 1.2067
Date – Entering the date of entry.
How the indicator helps traders and how to use it?
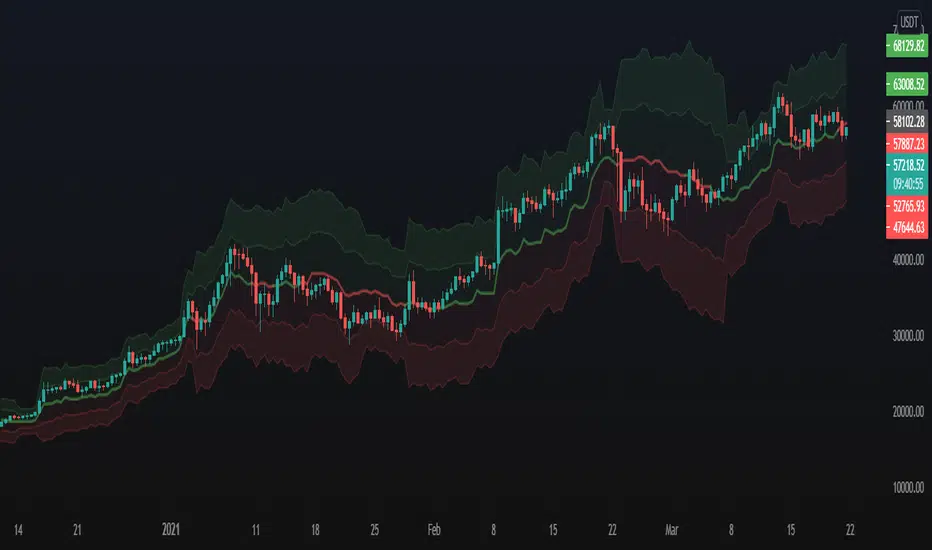
After you enter the inputs correctly, you will see colorful lines, each line representing the probability for the price to touch there in the current market conditions until a specific date.
To see what percentage each color represents in the indicator press “style”. For example, red lines are a 50% chance for the price to touch there in the chosen period.
It also helps the trader to see what range the stock is expected to move and what range is not probable in this period (according to the options prices).
As you can see, the probability cloud is expanding. This is because as time passes, the probabilities of reaching far away prices are increasing.
Note: this indicator may not work on IPO

The Bayesian Q OscillatorFirst of all the biggest thanks to @tista and @KivancOzbilgic for publishing their open source public indicators Bayesian BBSMA + nQQE Oscillator. And a mighty round of applause for @MarkBench for once again being my superhero pinescript guy that puts these awesome combination Ideas and ES stradegies in my head together. Now let me go ahead and explain what we have here.
I am gonna call it the Bayesian Q Oscillator I suppose. The goal of the script is to solve an issue both indicators on their own suffer from. QQE signals are not new and often the problem has always been false signals for them. They are good for scalping but the difference between a quality move and a small to nearly nonexistent move following a signal is not so clear. Kivanc made his normalized version to help reduce this problem by adding colors to his histogram type verision that would essentially represent if price was a trending move or in a ranging structure. As you can see I have kept this Idea but instead opted for lines as the oscillator. two yellow line (default color) is a ranging sideways area and when there is red or green it is trending up or down. I wanted to take this to the next level with combining the Bayesian probability oscillator that tista put together.
The Bayesian indicator is the opposite for its issue as it is a probability indicator that shows which candle or price movement is more likely to come next. Red rising means possibly down move soon and green means up soon. I will not go into the complex details of this indicator but will suggest others take a look at his and others to understand the idea behind them. The point I am driving at is that it show probabilities or likelyhood without the most effecient signal device to match it. This original was line form and now it is background filled colors.
The idea. is that you can potentially get some stronger and more accurate reversal signals with these two paired together. when you see a sell signal or cross with the towering or rising red... maybe it is a good jump potentially. The same for green. At the same time it is a double added filter effect from just having yellow represent it is ranging... but now if you get a buy signal (example) and have yellow lines (example) along wi5h a red rising or mountain color background... it not only is an indication of ranging, but also that there is potentially even a counter move coming based on the probabilities. Also if you get into a good trade and see dual yellow qqe crosses with no color represented by the bayesian background... it is possible it might only be noise.
I have found them to work decently in the 1 hour timframe. Let me know your experience.
I hope everyone takes a look at the originals to understand them. Full credit goes to those guys for this to be here. Let me know how it is working out for you.
Here are the original links.
bayesian
Normalized QQE

Chobotaru IndicatorChobotaru Indicator has two functions:
1. Probability cloud, giving the probability of stock or future to move to a certain price.
2. Help traders understand where to take profit and where to put a stop-loss.
You don’t need knowledge about options trading, this indicator is for all traders/investors.
What does the indicator do?
The indicator is based on the partial differential equations from the mathematical model of options, the Black-Scholes model. Using these equations and market parameters the indicator shows on the chart the probability that the stock/future will touch a certain price until a specific date.
How the indicator does it?
The algorithm solves the partial differential equations using the following values:
Instrument price - The current price of the stock or futures contract
The interest rate – default zero – can be found by searching in google: “U.S. Department of the treasury daily yield curve rates”, Use the 3-month value. This value has a low impact on the model so you only need to update it when there is a major change in the percentile. (Example, in January 2021 the 3 months “risk-free rate” is 0.08, you can enter 0 in the indicator.
Days to expire (minus trading holidays) – You need to choose an option and take from it the other values that are needed. We recommend taking options that close to 30 days, but it is the user choice.
Example: On the 22 of January 2021, PLTR has an option that has 35 days left. The option will expire on the 26 of February 2021, if there are trading holidays like in this case, the user needs to subtract them, on the 15 of February we have Washington's Birthday, the input is 35-1=34.
Implied volatility - Annualized asset price volatility, specific as a positive decimal number. IV 10% => input 0.1, you can find it in the option chain, if you don’t know what it is, you can ask your broker where you can find it on your trading platform. For example, the IV of PLTR on the 22 of January 2021 is 120.67% the input is 1.2067
Date – Entering the date of entry.
How the indicator helps traders and how to use it?
After you enter the inputs correctly, you will see colorful lines, each line representing the probability for the price to touch there in the current market conditions until a specific date.
To see what percentage each color represents in the indicator press “style”. For example, red lines are a 50% chance for the price to touch there in the chosen period.
It also helps the trader to see what range the stock is expected to move and what range is not probable in this period (according to the options prices).
As you can see, the probability cloud is expanding. This is because as time passes, the probabilities of reaching far away prices are increasing.
How to access the indicator?
Use the link below to obtain access to the indicator
Note: this indicator may not work on IPO

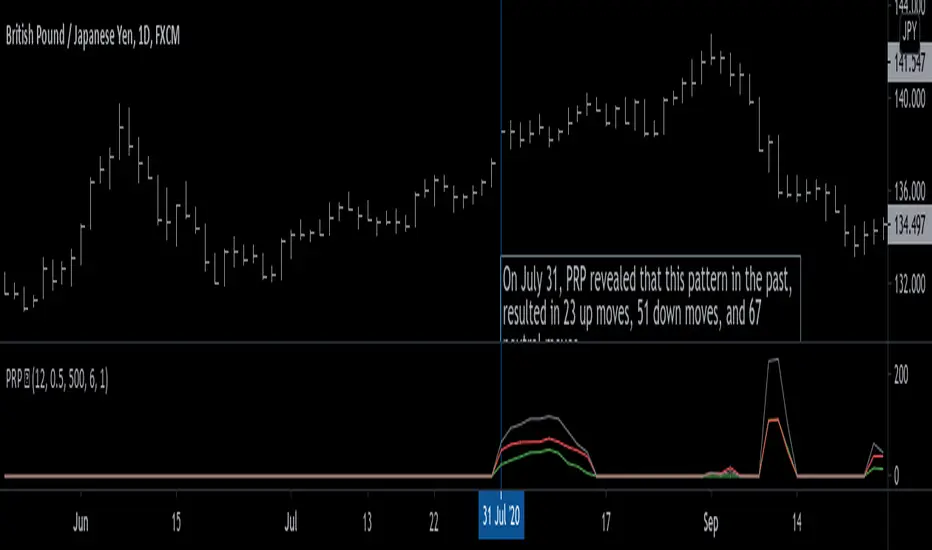
Pattern Recognition Probabilities [racer8]Brief 🌟
Pattern Recognition Probabilities (PRP) is a REALLY smart indicator. It uses the correlation coefficient formula to determine if the current set of bars resembles that of past patterns. It counts the number of times the current pattern has occurred in the past and looks at how it performed historically to determine the probability of an up move, down move, or neutral move.
I'd like to say, I'm proud of this indicator 😆🤙 This is the SMARTEST indicator I have ever made 🧠🧠🧠
Note: PRP doesn't give you actual probabilities, but gives you instead the historical occurrences of up, down, and neutral moves that resulted after the pattern. So you can calculate probabilities based on these valuable statistics. So for example, PRP can tell you this pattern has historically resulted in 55 up moves, 20 down moves, and 60 neutral moves.
Parameters 🌟
You can adjust the Pattern length, Minimum correlation, Statistics lookback, Exit after time, and Atr multiplier parameters.
Pattern length - determines how long the pattern is
Minimum correlation - determines the minimum correlation coefficient needed to pass as a similiar enough pattern.
Statistics lookback - lookback period for gathering all the patterns in the past.
Exit after time - determines when exit occurred (number of periods after pattern) ; is the point that represents the pattern's result.
Atr multiplier - determines minimum atr move needed to qualify whether result was an up/down move or a neutral move. If a particular historical pattern resulted in a move that was less than the min atr, then it is recorded as a neutral move in the statistics.
Thanks for reading! 🙏
Good luck 🍀 Stay safe 😷 Drink lots of water💧
Enjoy! 🥳 and Hit the like button! 👍
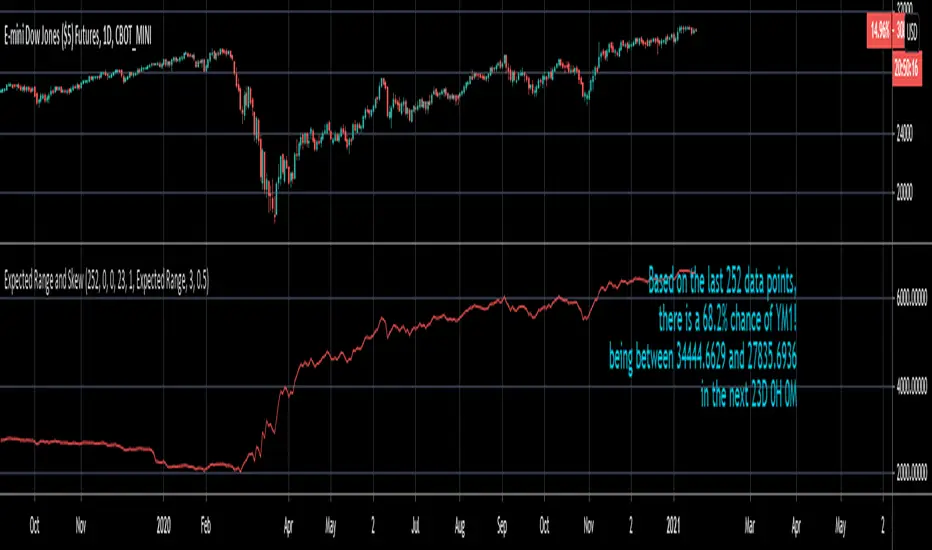
Expected Range and SkewThis is an open source and updated version of my previous "Confidence Interval" script. This script provides you with the expected range over a given time period in the future and the skew of that range. For example, if you wanted to know the expected 1 standard deviation range of MSFT over the next 20 days, this will tell you that. Additionally, this script will also tell you the skew of the expected range.
How to use this script:
1) Enter the length, this will determine the number of data points used in the calculation of the expected range.
2) Enter the amount of time you want projected forward in minutes, hours, and days.
3) Input standard deviation of the expected range.
4) Pick the type of data you want shown from the dropdown menu. Your choices are either the expected range or the skew of the expected range.
5) Enter the x and y coordinates of the label (optional). This is useful so it doesn't impede your view of the plot.
Here are a few notes about this script:
First, the expected range line gives you the width of said range (upper bound - lower bound), and the label will tell you specifically what the upper and lower bounds of the expected range are.
Second, this script will work on any of the default timeframes, but you need to be careful with how far out you try to project the expected range depending on the timeframe you're using. For example, if you're using the 1min timeframe, it probably won't do you any good trying to project the expected range over the next 20 days; or if you're using the daily timeframe it doesn't make sense to try to project the expected range for the next 5 hours. You can tell if the time horizon you're trying to project doesn't work well with the chart timeframe you're using if the current price is outside of either the upper or lower bounds provided in the label. If the current price is within the upper and lower bounds provided in the label, then the time horizon that you're projecting over is reasonable for the chart timeframe you're using.
Third, this script does not countdown automatically, so the time provided in the label will stay the same. For example, in the picture above, the expected range of Dow Futures over the next 23 days from January 12th, 2021 is calculated. But when tomorrow comes it won't count down to 22 days, instead it will show the range over the next 23 days from January 13th, 2021. So if you want the time horizon to change as time goes on you will have to update this yourself manually.
Lastly, if you try to set an alert on this script, you will get a warning about it possibly repainting. This is because of the label, not the plot itself. The label constantly updates itself, which triggers the warning. I tested setting alerts on this script both with and without the inclusion of the label, and without the label the repainting warning did not occur. So remember, if you set an alert on this script you will get a warning about it possibly repainting, but this is because of the label constantly updating, not the plot itself.
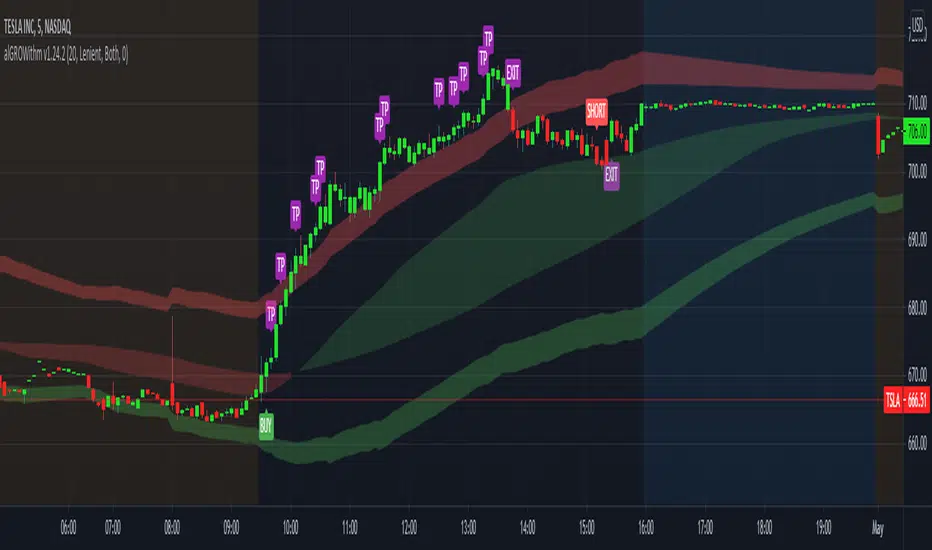
alGROWithm PremiumIntroducing the alGROWithm indicator!
Years of trading experience and endless hours of screen time has undeniably proven to me that the most fundamental rule of any market is: price moves from supply to supply and demand to demand. Specifically, this means that a breakout of a supply zone , the probability of it reaching the next supply zone before starting consolidate is very high. Similarly, a breakdown from previous demand zone will likely continue to the next demand zone . The identification method of these supply and demand channels is one of the features that sets this indicator apart from other available tools.
What separates alGROWithm from other available tools?
- Proprietary method for identifying supply & demand channels combined with a directional bias computation based on recent historical prices
- Only signaling precise entries based on supply & demand that maximize R/R
- Tracking open positions and displaying a trading plan directly on the chart immediately after signaling entry points
- Indicating precise exit levels to help you avoid exiting too early or trading by emotion
What are the features included in alGROWithm?
Trading Plan Lines : These are the Buy/Short/Take Profit/Exit lines plotted directly on the chart
Show Long Signals : These are the green "BUY" labels that appear on the chart when alGROWithm identifies a critical breakout to the next supply level
Show Short Signals : These are the red "SHORT" labels that appear on the chart when alGROWithm identifies a critical breakdown to the next demand level
Show Take Profit Signals : These are the purple "TP" labels that appear on the chart when alGROWithm identifies that the subsequent supply/ demand level has been hit
Show Exit/Stop Loss Signals : These are the purple "EXIT" labels that appear on the chart when alGROWithm identifies that the trade has run its course and it's time to exit
Show Dashboard : This is a dashboard that is displayed to the right of the latest candle, and contains the following information:
- Current Position : "Long", "Short", or "None"
- Next Profit Target : Only displays if there is an active Position
- Current Bias : alGROWithm computes a directional bias based on recent historical prices. Text will say "Long" or "Short"
- Long/Short Bias Until : alGROWithm's bias will change if this price is hit. Note that these are not BUY or SELL levels - this simply indicates whether things are looking up or down
- Enter Short/Long At : Only displays if Current Position = "None"
Note that you can enable/disable any of these chart overlays at anytime through the indicator settings.
The alGROWithm indicator works on any timeframe, any market, and standard OR Heikin Ashi candlesticks .
I have been working very hard on this indicator and I personally use it on a daily basis with options trading. I am so excited to share the wealth with you!
You can use the link below to visit our website and gain access to the script.
Probability Bands [Anan]Hello Friends,,,
===================================
This indicator is based on Bayes' Theorem and is fully based on probabilities.
===================================
Formula For Bayes' Theorem:
P(Bull|Bear) = P(Bear∣Bull) * P(Bull) / P(Bear)
where:
Bull and Bear are events and P is probability
P(Bull|Bear) is the posterior probability, the probability of Bull after taking into account Bear
P(Bear∣Bull) is the conditional probability or likelihood, the degree of belief in Bear given that proposition of Bull belief (Bull true)
P(Bull) is the prior probability, the probability of Bull belief
P(Bear) is the prior probability, the probability of Bear belief
===================================
The indicator output one trend lines and (Bull/Bear) Signal :
Bull/Bear Probability Trend :
when the price is above mid line ==> Up Trend
when the price is below mid line ==> Down Trend
And by using ATR deviation multipliers, we can get (Bullish/Bearish) zones
===================================
Disclaimer:
This script is for informational and educational purposes only.
Use of the script does not constitutes professional and/or financial advice.
You alone the sole responsibility of evaluating the script output and risks associated with the use of the script.
===================================
Probability Function [racer8]It's my birthday today! Just turned 20, so I decided to make another indicator. There's not very many indicators on TV that calculate pure probability. Many indicators on TV have the word "Probability" in their titles but they don't actually calculate probability...I call them "false titles". This indicator aims to change that. This is the indicator that every option trader dreams of having. Even if you're not an options trader, it's still very interesting to know the probability of a price movement.
Probability Function calculates the probability of a data point (price) falling within a certain number of standard deviations away from the mean.
So for example, setting the parameter to 2 standard deviations will calculate the probability of price staying within a 2-standard-deviations-channel away from the mean (or moving average). This description is exactly what Bollinger Bands are...which makes it a direct application of this indicator, and Bollinger Bands are used by many traders.
The indicator's formula is an approximation of the integral of the standard normal distribution function. It uses one parameter called "Standard deviation multiple" (SDM). An input of 1 stdev yields 68%, 2 stdevs yields 95%, 3 stdevs yields approx 99.7%, and so on eventually converging to 100%...and it makes sense the bigger the stdev channel, the more likely price will stay within it.
Enjoy and hit the like button!

Probability of ATR Index [racer8]Deriving the indicator:
PAI is an indicator I created that tells you the probability of current price moving a specified ATR distance over a specified number of periods into the future. It takes into account 4 variables: the ATR & the standard deviation of price, and the 2 parameters: ATR distance and # bars (time).
The formula is very complex so I will not be able to explain it without confusion arising.
What I can say is that I used integral calculus & the Taylor series to derive a formula that calculates the area under half of the normal distribution function. Thus, the formula was repeated twice in the code to derive the full probability (half + half = whole). If you can read the code, you might be wondering why the formula is so long...
The reason for this is because in Pine Script, the erf function doesn't exist. You see, the formula for normal distribution is: f(x) = (1/sqrt(2pi))*e^(-xx/2), assuming of course that the standard deviation = 1 and mu (mean) = 1. The next step is to take the integral of this formula in order to find the area under f(x). The problem is that I found the integral, F(x), of the normal distribution formula to be equal to F(x) = erf(x/sqrt(2))/2...and the erf function cannot be directly computed into Pinescript.
So I developed a solution...why not estimate the integral function? So that's exactly what I did using a technique involving the Taylor series. The Taylor series is an algebraic function that allows you to create a new function that can estimate the existing function. On a graph, the new function has the same values as the existing one, the only difference is that it uses a differnt formula, in this case, a formula that makes it possible to compute the integral. The disadvantage of using this new formula is that it is super long and if you want it to better represent the original integral over a wider range of x-values, you have to make it longer.
Signal Interpretion:
The hotter the colour, the more likely price will reach your specified distance.
The 2 values of PAI in the bottom window represent probability & average probability of your specifed distance geting hit.
Applications:
Stop loss placement---
This indicator is useful because it gives you an idea of the likelihood that a stop loss at a particular distance away from price (in ATRs) will be hit over a period of time specified. This is helpful in placing stop losses.
Options trading---
PAI can also be used in options trading. For example, you are using a strangle options strategy, and you want to make sure that price stays within the Strangle's profit range. So you only trade when PAI presents a low probability value of moving at a particular distance in ATRs over n periods.
Anyhow, I hope you guys like it. Enjoy! and hit that like button for me :)

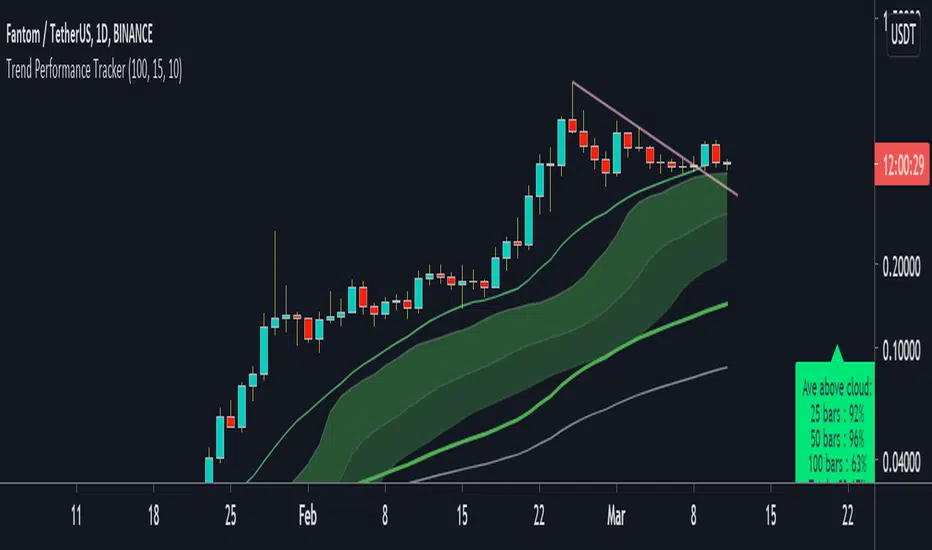
Trend Performance TrackerThis script is designed for trend trading. Currently set up for stocks long. It's main aim is checking the profitability of the trend trading system that it suggests.
How to use:
- When there is a sufficient trend and pullback for an entry yellow dots will appear under the bars. An buy-stop line (green) and a stop-loss line (red) also appear on the chart at this point.
- the script tracks having made a trade and continues to draw the stop-loss placement on the chart (red line)
- at the bottom of the chart you an see the script tracking the trades it would place.
- Yellow squares are a pending setup
- A green arrow and green squares are a open position
- A pink X means a losing trade and a green flag means a winning trade
- At the current bar will be data on how well the strategy would perform on that pair at that timeframe. "RR" is the total RR made over the number of trades (a bad trade is counted as -1). "win %" is the percentage of winning trades.
- If there RR is > 2 and win % is > 50%, the data box will show as green, indicating a good probability for trading success on that pair and time-frame at that moment.
Momentum Adjusted EMA TrendThe script draws a moving average which responds to trend changes extraordinary fast!
It's calculated using Momentum, Acceleration and Probability (Psychological Effect) by interfering the Golden Ratio!
I got the idea thanks to Tradingview user DGT (dgtrd) and his/her excellent descriptions.
The indicator is simplified for users and the default settings work great, so use it as you like specially as a trend indicator.


Cumulative distribution function - Probability Cumulative distribution function (tScore and zScore)
This script provides the calculation of the cumulative distribution function (i.e., probability). The measure allows you to calculate the chances of a value of interest being above or below a hypothesized value over the measurement period—nothing fancy here, just good old statistics and mathematics. The closer you are to 0 or 1, the more significant your measurement. We’ve included a significance level highlighting feature. The ability to turn price and/or volume off.
We have included both the Z and T statistics. Where the ‘Z’ is looking at the difference of the current value, minus the mean, and divided by the standard deviation. This is usually pretty noisy on a single value, so a smoother is included. Nice shoutout to the Pinecoders Github Page with this function also. The t-statistic is measuring the difference between a short measurement, an extended measurement, and divided by the standard error (sigma/sqrt(n)). Both of these are neatly wrapped into a function, so please feel free to use them in your code. Add a bit of science to your guessing game. For the purists out there, we have chosen to use sigma in the t-statistic because we know the population's behavior (as opposed to the s-measure). We’ve also included two levels of the t-statistic cumulative distribution function if you are using a short sample period below 6.
Finally, because everyone loves choices, we’ve included the ability to measure the probability of:
the current value (Price and volume)
change
percent change
momentum (change over a period of time)
Acceleration (change of the change)
contribution (amount of the current bar over the sum)
volatility (natural log ratio of today and the previous bar)
Here is a chart example explaining some of the data for the function.
Here are the various options you have the print the different measurements
A comparison of the t-statistic and z-statistic (t-score and z-score)
And the coloring options

Bull/Bear Probability [Anan]Hello Friends,,,
===================================
This indicator is based on Bayes' Theorem and is fully based on probabilities.
===================================
Formula For Bayes' Theorem:
P(Bull|Bear) = P(Bear∣Bull) * P(Bull) / P(Bear)
where:
Bull and Bear are events and P is probability
P(Bull|Bear) is the posterior probability, the probability of Bull after taking into account Bear
P(Bear∣Bull) is the conditional probability or likelihood, the degree of belief in Bear given that proposition of Bull belief (Bull true)
P(Bull) is the prior probability, the probability of Bull belief
P(Bear) is the prior probability, the probability of Bear belief
===================================
The indicator output 2 trend lines and (Bull/Bear) Signal :
Bull/Bear Probability Trend :
when the price is above it = Up Trend
when the price is below it = Down Trend
Bull/Bear Probability Trend Moving Average :
when the price is above it = Up Trend
when the price is below it = Down Trend
(Bull/Bear) Signal :
when Probability Trend Moving Average crossover Probability Trend = Bull Signal
when Probability Trend Moving Average crossunder Probability Trend = Bear Signal
===================================
Disclaimer:
This script is for informational and educational purposes only.
Use of the script does not constitutes professional and/or financial advice.
You alone the sole responsibility of evaluating the script output and risks associated with the use of the script.
===================================
Thanks to my friends dgtrd because he inspired me about probability, take a look at his scripts.
===================================

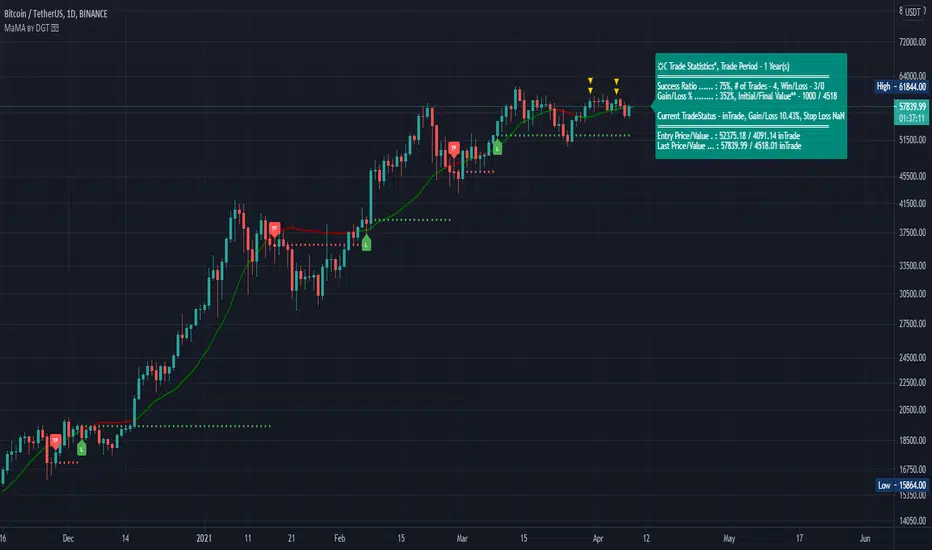
Momentum adjusted Moving Average by DGTA brand new Moving Average , calculated using Momentum, Acceleration and Probability (Psychological Effect).
Momentum adjusted Moving Average(MaMA) is an indicator that measures Price Action by taking into consideration not only Price movements but also its Momentum, Acceleration and Probability. MaMA, provides faster responses comparing to the regular Moving Average
Here is the math of the MaMA idea
Momentum measures change in price over a specified time period
momentum = source – source(length)
where,
source, indicates current bar’s price value
source(length), indicates historical price value of length bars earlier
Lets play with this formula and rewrite it by moving source(length) to other side of the equation
source = source(length) + momentum
to avoid confusion let’s call the source that we aim to predict as adjustedSource
adjustedSource = source(length) + momentum
looks nice the next value of source simply can be calculated by summing of historical value of the source value and value of the momentum. I wish it was so easy, the formula holds true only when the momentum is conserved/constant/steady but momentum move up or down with the price fluctuations (accelerating or decelerating)
Let’s add acceleration effects on our formula, where acceleration is change in momentum for a given length. Then the formula will become as (skipped proof part of acceleration effects, you may google for further details)
adjustedSource = source(length) + momentum + 1/2 * acceleration
here again the formula holds true when the acceleration is constant and once again it is not the case for trading, acceleration also changes with the price fluctuations
Then, how we can benefit from all of this, it has value yet requires additional approaches for better outcome
Let’s simulate behaviour with some predictive approach such as using probability (also known as psychological effect ), where probability is a measure for calculating the chances or the possibilities of the occurrence of a random event. As stated earlier above momentum and acceleration are changing with the price fluctuations, by using the probability approach we can add a predictive skill to determine the likelihood of momentum and acceleration changes (remember it is a predictive approach). With this approach, our equations can be expresses as follows
adjustedSource = source(length) + momentum * probability
adjustedSource = source(length) + ( momentum + 1/2 * acceleration ) * probability , with acceleration effect
Finally, we plot MaMA with the new predicted source adjustedSource, applying acceleration effect is made settable by the used from the dialog box, default value is true.
What to look for:
• Trend Identification
• Support and Resistance
• Price Crossovers
Recommended settings are applied as default settings, if you wish to change the length of the MaMA then you should also adjust length of Momentum (and/or Probability). For example for faster moving average such as 21 period it would be suggested to set momentum length to 13
Alternative usage , set moving average length to 1 and keep rest lengths with default values, it will produce a predictive price line based on momentum and probability. Experience acceleration factor by enabling and disabling it
Conclusion
MaMA provide an added level of confidence to a trading strategy and yet it is important to always be aware that it implements a predictive approach in a chaotic market use with caution just like with any indicator
Trading success is all about following your trading strategy and the indicators should fit within your trading strategy, and not to be traded upon solely
Disclaimer : The script is for informational and educational purposes only. Use of the script does not constitutes professional and/or financial advice. You alone the sole responsibility of evaluating the script output and risks associated with the use of the script. In exchange for using the script, you agree not to hold dgtrd TradingView user liable for any possible claim for damages arising from any decision you make based on use of the script
Bayes Probability Index by DGTWhat is Probability?
It is a measure for calculating the chances or the possibilities of the occurrence of a random event. In simple words, it calculates the chance of the favorable outcome amongst the entire possible outcomes. Mathematically, if you want to answer what is probability, it is defined as the ratio of the number of favorable events to the total number of possible outcomes of a random events.
Is this enough? May be or may be not
Let’s consider an example,
A simple probability question may ask: "What is the probability of Amazon.com's stock price falling?"
How about if we extend our question a step further by asking: "What is the probability of AMZN stock price falling given that the Dow Jones Industrial Average (DJIA) index fell earlier?"
Now we are ready to consider conditional probability and Bayes' Theorem is where we could find answer to this question
Bayes' Theorem
Bayes' theorem, named after 18th-century British mathematician Thomas Bayes, is a mathematical formula for determining conditional probability. Conditional probability is the likelihood of an outcome occurring, based on prior knowledge of conditions or another related event occurring. Bayes' theorem provides a way to revise existing predictions or theories (update probabilities) given new or additional evidence. Bayes' theorem thus gives the probability of an event based on new information that is, or may be related, to that event
Formula For Bayes' Theorem
P(A|B) = P(B∣A) * P(A) /P(B)
= P(B∣A) * P(A) / (P(B∣A)* P(A) + P(B∣A’)* P(A’) )
where
A and B are events and P is probability
P(A|B) is the posterior probability, the probability of A after taking into account B
P(A) is the prior probability, the probability of A belief
P(A’) is the prior probability, the probability of A disbelief : P(A’)=1- P(A)
P(B) is the prior probability, the probability of B belief
P(B∣A) is the conditional probability or likelihood, the degree of belief in B given that proposition of A belief (A true)
P(B∣A’) is the conditional probability or likelihood, the degree of belief in B given that proposition of A disbelief (A false)
Bitcoin was the first-ever cryptocurrency, designed by Satoshi Nakamoto. In its likeness, all other cryptocurrencies were then created. The relationship between Bitcoin and altcoins remains something crypto analyst watch closely. This study aims to display the likelihood of bullish movement for ALTS-USDT pairs taking into consideration of bullish move probability of BTC-USDT pair
What to look for:
Percentage Value of the Conditional Probability and/or Simple Probability. When value is above %50 than bullish move is more probable, conversely when the value is below %50 bearish move is more likely
Limitations : Conditional Probability Line will be shown for daily time frame only, Simply Probability Line would be available for all time frames
Conditional Probability is calculated with the condition of BTC-USDT pair so using Conditional Probability is suggested with ALTS-USDT pairs.
Indicators aim to generate a potential signal/indication of an upcoming opportunity, but, the Indicators themselves do not guarantee the future movement of a given financial instrument, and are most useful when used in combination with other techniques.
Trading success is all about following your trading strategy and the indicators should fit within your trading strategy, and not to be traded upon solely
Disclaimer : The script is for informational and educational purposes only. Use of the script does not constitutes professional and/or financial advice. You alone the sole responsibility of evaluating the script output and risks associated with the use of the script. In exchange for using the script, you agree not to hold dgtrd TradingView user liable for any possible claim for damages arising from any decision you make based on use of the script

multi pack fisher's and EMACross and Probabilty densityFisher dönüşümün farklı türlerini en çok kullanılan indikartörlerle yeniden sentezlenmesi sonucu ve farklı ema kesimlerine olasılık dağılım yoğunluğu eklenerek içinde bulunan piyasanın trend gücünü görseleştirme amaçlanmıştır.Çalışma tamamen eğitim amaçlı olup, farklı indikatörlerin bir arada kullanımını göstermek için hazırlanmıştır.Kesinlikle yatırım tavsiyesi değildir.
Saygılarımla...
LazEngineer ,Elecrical Engineer
// English explanation
It is aimed to visualize the trend of the market containing the result of re-synthesis with the most used indicator in different types of fisher trasform and by adding the density of the distribution Z transform, required for cutting different ema.
Yours truly ...
LazEngineer, Electrical Engineer

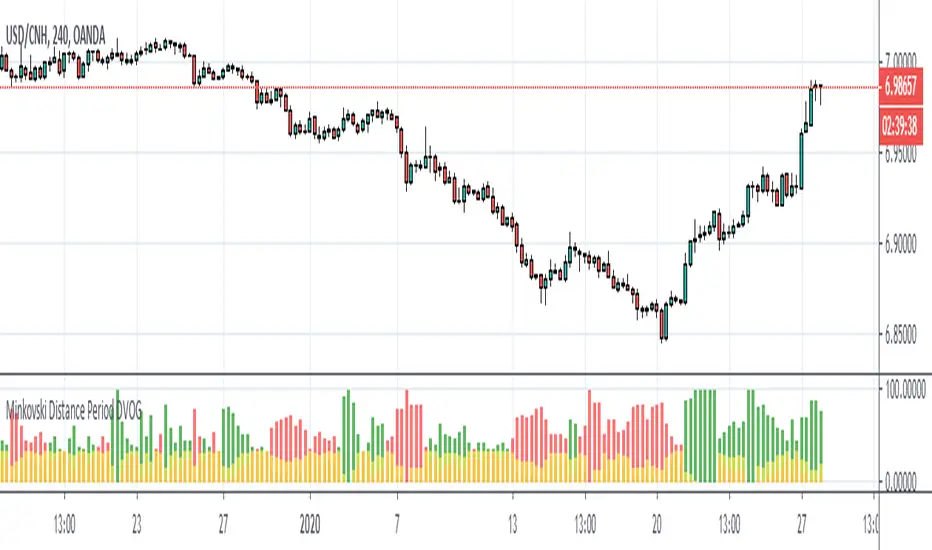
Minkovski Distance Period DVOGThis script was created by building my Dependent Variable Odd Generator script on the Minkovski Distance Adaptive Period.
I have tried this on MACD before.
Script related to MACD :
I used an older version that does not use Dow Factor to suit multi timeframe analysis.
In this way, market situations provide the opportunity to see histograms in an adaptive period as a Multi Timeframe.
Minkowski Distance Function Original Script by RicardoSantos :
Regards.
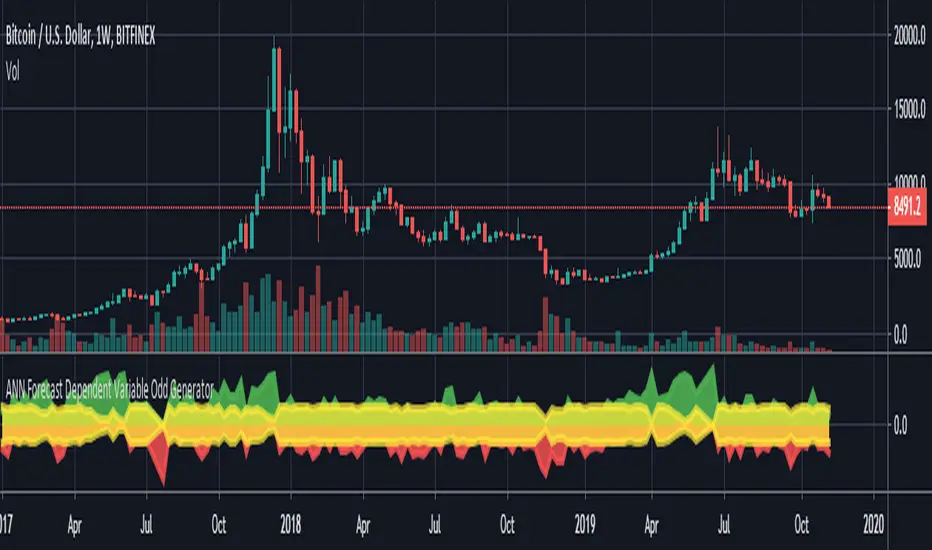
ANN Forecast Dependent Variable Odd GeneratorHello , this script is the ANN Forecast version of my "Dependent Variable Odd Generator " script.
I went to simplify a bit because the deep learning calculations are too much for this command.
The latest instruments included:
WTI : West Texas Intermediate (WTICOUSD , USOIL , CL1! ) Average error : 0.007593
BRENT : Brent Crude Oil ( BCOUSD , UKOIL , BB1! ) Average error : 0.006591
GOLD : XAUUSD , GOLD , GC1! Average error : 0.012767
SP500 : S&P 500 Index ( SPX500USD , SP1! ) Average error : 0.011650
EURUSD : Eurodollar ( EURUSD , 6E1! , FCEU1!) Average error : 0.005500
ETHUSD : Ethereum ( ETHUSD , ETHUSDT ) Average error : 0.009378
BTCUSD : Bitcoin ( BTCUSD , BTCUSDT , XBTUSD , BTC1! ) Average error : 0.01050
GBPUSD : British Pound ( GBPUSD , 6B1! , GBP1!) Average error : 0.009999
USDJPY : US Dollar / Japanese Yen ( USDJPY , FCUY1!) Average error : 0.009198
USDCHF : US Dollar / Swiss Franc ( USDCHF , FCUF1! ) Average error : 0.009999
USDCAD : Us Dollar / Canadian Dollar ( USDCAD ) Average error : 0.012162
VIX : S & P 500 Volatility Index (VX1! , VIX ) Average error : 0.009999
ES : S&P 500 E-Mini Futures ( ES1! ) Average error : 0.010709
SSE : Shangai Stock Exchange Composite (Index ) ( 000001 ) Average error : 0.011287
XRPUSD : Ripple (XRPUSD , XRPUSDT ) Average error : 0.009803
Simply select the required instrument from the tradingview analysis screen, then add this command and select the same instrument from the settings section.
The codes are not open-source because they contain forecast algorithm codes a little that I will use commercially in the future.
However, I will never remove this script, and you can use it for free unlimitedly.
For more information about my artificial neural network forecast series:
For more information about my dependent variable odd generator :
For more information about simple artificial neural networks :
(detailed information about ANN )
(25 in 1 version )
I hope it helps in your analysis. Regards , Noldo .
NOTE : In the first pass bar of the definite positive and negative zone, alerts are added for both conditions.