Visible Range Mean Deviation Histogram [LuxAlgo]This script displays a histogram from the mean and standard deviation of the visible price values on the chart. Bin counting is done relative to high/low prices instead of counting the price values within each bin, returning a smoother histogram as a result.
Settings
Bins Per Side: Number of bins computed above and below the price mean
Deviation Multiplier: Standard deviation multiplier
Style
Relative: Determines whether the bins length is relative to the maximum bin count, with a length controlled with the width settings to the left.
Bin Colors: Bin/POC Lines colors
Show POCs: Shows point of controls
Usage
Histograms are generally used to estimate the underlying distribution of a series of observations, their construction is generally done taking into account the overall price range.
The proposed histogram construct N intervals above*below the mean of the visible price, with each interval having a size of: σ × Mult / N , where σ is the standard deviation and N the number of Bins per side and is determined by the user. The standard deviation multipliers are highlighted at the left side of each bin.
A high bin count reflects a higher series of observations laying within that specific interval, this can be useful to highlight ranging price areas.
POCs highlight the most significant bins and can be used as potential support/resistances.
Profile

.srb suiteThe essential suite Indicator.
that are well integrated to ensure visibility of essential items for trading.
it is very cumbersome to put symbol in the Tradingview chart and combine essential individual indicators one by one.
Moreover even with such a combination, the chart is messy and visibility is not good.
This is because each indicator is not designed with the others in mind.
This suite was developed as a composite-solution to that situation, and will make you happy.
designed to work in the same pane with open-source indicator by default.
Recommended visual order ; Back = .srb suite, Front = .srb suite vol & info
individually turn on/off only what you need on the screen.
BTC-agg. Volume
4 BTC-spot & 4 BTC-PERP volume aggregated.
It might helps you don't miss out on important volume flows.
Weighted to spot trading volume when using PERP+spot volume .
If enabled, BTC-agg.Vol automatically applied when selecting BTC-pair.
--> This is used in calculations involving volumes, such as VWAP.
Moving Average
1 x JMA trend ribbon ; Accurately follow short-term trend changes.
3 x EMA ribbon ; zone , not the line.
MA extension line ; It provide high visibility to recognize the direction of the MA.
SPECIAL TOOLS
VWAP with Standard Deviation Bands
VWAP ruler
BB regular (Dev. 2.0, 2.5)
BB Extented (Dev. 2.5, 3.0, 3.5)
Fixed Range Volume Profile ; steamlined one, performace tuned & update.
SPECIAL TOOLS - Auto Fibonacci Retracement - New GUI
'built-in auto FBR ' has been re-born
It shows - retracement Max top/ min bottom ; for higher visibility
It shows - current retracement position ; for higher visibility
The display of the Fib position that exceeds the regular range is auto-determined according to the price.
tradingview | chart setting > Appearance > Top margin 0%, Bottom margin 0% for optimized screen usage
tradingview | chart setting > Appearance > Right margin 57
.srb suite vol & info --> Visual Order > Bring to Front
.srb suite vol & info --> Pin to scale > No scale (Full-screen)
Visual order ; Back = .srb suite, Front = .srb suite vol & info
1. Fib.Retracement core is from tradingview built-in FBR ---> upgrade new-type GUI, and performance tuned.
2. Fixed-range volume-profile core is from the open-source one ---> some update & perf.tuned.
---------------------------------------------------------------------------------------------------------------------------------------
if you have any questions freely contact to me by message on tradingview.
but please understand that responses may be quite late.
Special thanks to all of contributors of community.
The script may be freely distributed under the MIT license.

Naked Intrabar POCThis indicator with an unfortunate and very non PC sounding name approximates (!) the intrabar point of control (POC) either from time or volume at price.
Due to pine limitations, bin size and the sample lower time frame selection will have at least some effect on the accuracy of the approximation. The trade off is between accuracy and historical availability, however bar replay can be used to view prior historical states beyond what is visible from the current real time bar.
In order for all intrabar POC circles to be visible, you will need to manually set the visual order of the indicator by bringing it to the front.
Since the POC represents a price point around which the highest market participation occurred, the exposed global variable intrabar_poc may (or may not) be interesting as an alternative to ohlc based source input.

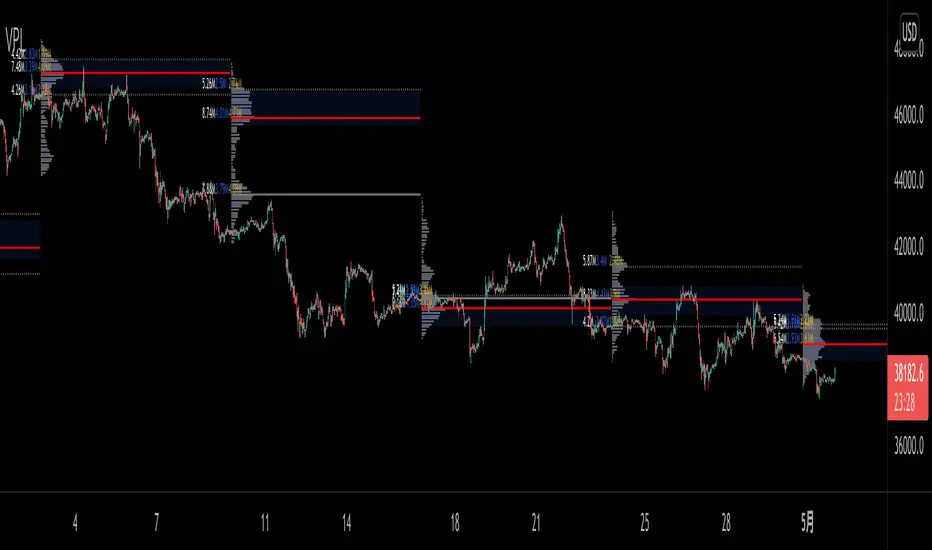
VPLineVPLine is a brand-new line indicator which automatically draws historical POC line with volume profile histograms based on user input session and configurations.
A colossal amount of function is deployed on the indicator: historical POC line, historical VA, historical VA high/low, volume profile histograms, volume profile value text (bid/ask/total), threshold function that limits the extension of the POC line based on user input etc.
Session TPO Market ProfileIntroduction
Wikipedia: A Market Profile is an intra-day charting technique (price vertical, time/activity horizontal) devised by J. Peter Steidlmayer, a trader at the Chicago Board of Trade (CBOT), ca 1959-1985. Steidlmayer was seeking a way to determine and to evaluate market value as it developed in the day time frame. The concept was to display price on a vertical axis against time on the horizontal, and the ensuing graphic generally is a bell shape--fatter at the middle prices, with activity trailing off and volume diminished at the extreme higher and lower prices. In this structure he recognized the 'normal', Gaussian distribution he had been introduced to in college statistics.
Important : The market profile tool is designed to be used on the 30min timeframe, however, you can modify its parameters and use it on lower timeframes (15/10/5min)
This indicators displays the following information
Session open
TPO
Value area calculation zone
POC
Highlight of Single prints
Session High/Low
The current price (TPO Profile is often used isolated without any candlesticks on it)
Parameters
Session beginning configuration (not coded with a session input yet)
Number of candles to use for calculation (default 13 for a single session)
Extend yesterday's levels (VAH/VAL/POC)
Show/Hide Market profile calculation area (background color)
Bars number (number of rows that will be used to draw the profile)
Show/Hide TPO's
TPO Colors customization (For in/out of VA, VAL/VAH/POC/High/Low levels and single prints)
Show/Hide High/Low levels
Show/Hide VAL/VAH/POC Levels as lines
Enable/Disable Single prints highlighting
Value area size (as percent)
Show/Hide current price (corresponding to a line scaled on the "close" price)
Additional Notes
Each session is drawn when the day is over
To use as much space as possible, TPO's are not directly drawn on the area of their calculation (which can be confusing if you use candlesticks directly over it)
This script will probably be updated in the future (especially concerning its implementation which is a bit spaghetti coded for now) .
If you have interesting suggestions about new features that are usual within market profile tools and missing from this script , don't hesitate to suggest it.

MarketProfile HLMarketProfile HL dynamically calculates and displays a side histogram of the distribution of volumes with colors along a gradient, which is set to a given number of candles. The histogram is overlaid on the candlesticks to visually represent areas of market balance and imbalance. The indicator uses the concepts of statistical distribution and is based on the market profile theory.
The gradient color of the levels shows where more or less horizontal volume accumulates.
Adapts to any timeframe or instrument.
Customizable display of horizontal levels HL and POC.
The HL and POC levels protrude beyond the boundaries of the main histogram on the right for a more convenient determination of dynamic centers and accumulation boundaries.
-------------------------------------------
MarketProfile HL динамически рассчитывает и отображает боковую гистограмму распределения объемов с цветами по градиенту, которая настроена на заданное количество свечей. Гистограмма накладывается на свечи, чтобы визуально представить области рыночного баланса и дисбаланса. Индикатор использует концепции статистического распределения и основан на теории профиля рынка.
Градиентный цвет уровней показывает, где накапливается больше или меньше горизонтального объема.
Адаптируется к любому таймфрейму или инструменту.
Настраиваемое отображение горизонтальных уровней HL и POC.
Уровни HL и POC выступают за границы основной гистограммы справа для более удобного определения динамических центров и границ накоплений.

Market Profile Fixed ViewSome instruments does not provide any volume information, therefore, as a fixed volume profile user, I needed a fixed market profile indicator to use the same principles, regardless of whether the volumes are available or not.
This script draws a market profile histogram corresponding to price variations within a specific duration, you only need to specify Start and End date/time values to see the histogram on your chart.
Details
Two lines corresponding to highest/lowest prices are displayed around the histogram
The redline corresponds to the POC (point of control)
Options
Start calculation
End calculation
Bars number (histogram resolution, currently locked to a max value of 50 bars)
Display side/Width (allows to modify size of bars, to the left or to the right)
Bars/Borders/POC Color customization
Notes
This script will probably be updated (to add VAH/VAL zones, and maybe other options). However, some common market profile attributes have not been implemented yet since I don't really use them)

Market Profile Visible RangeSup TV, 2 important points .
1) surprisingly, it's the first MP Visible Range script on TV;
2) This one doesn't use any bagging/binning*, instead each row represents the time spent on the actual minimal price steps (aka ticks).
The script will be further extended with usual market profile related functionally in future updates. At this point we have:
- Profile itself (each row represents how many bars touch the given price);
- Mode of the profile (called POC)**;
* Still it will be introduced in future when I will find / design the proper aggregating technique. It is vital for processing very wide price ranges (for example, 500 days on ES futures).
** The script correctly calculates POC by finding all the modes in the data & choosing the closest one to data's midrange.
For this kind of technical instrument finally it was more convenient to use Pine Script 5 (btw it's my first Pine 5).
Basically this script is a side-effect of another R&D I'm doing, the stuff is useful tho so let's go.
By choosing length we both specify the amount of data to be processed & the profile's location screen-wise. It's pretty cool and & useful, on my screen it's always almost touching the left side and still always visible.
The code is heavily commented in order to be understood fast, nothing fantastic, just a lil patience required this time.
Rationale
Market & volume profiles are well known concepts, lotta info available, the most important point of all that is that MP is just another way of visualizing data that lets you notice things you don't usually notice on sequential charts. From my side I can only add that it's better to use your own brain for thinking and reconsidering using volume profile in all the cases, especially on decentralized markets (unless you're aggregating ALL the volume data from everywhere, including options, OTC etc).
Here is it, for you

CDOI ProfileCumulative Delta of Open Interest Profile
This script lets you visualize where there were Open Interest build-ups and discharges on a price basis.
It only supports pairs where TradingView added the appropriate Open Interest data (at the time of posting that is only Binance and Kraken perpetual contracts)
The script uses my own functions to poll lower timeframe data and compile it into a higher timeframe profile. And as such, it needs some tweaking to adjust it to your timeframe until Tradingview lets me do it codewise (hopefully one day)
The instructions for using the Indicators are as follows:
Condition: How often a new profile should be generated
Sampling Rate and 1/Nth of the TF: These have to be calculated together to have a product that should correspond to the current timeframe in minutes. A few examples below
----------- Sampling - 1Nth of the TF
5 min ------- 5 --------------- 1
10 min ------ 10 ------------- 1
15 min ------ 5 --------------- 3
20 min ------ 10 ------------- 2
30 min ------ 10 -------------- 3
45 min ------- 9 -------------- 5
1 hour ------- 10 ------------- 6
4 hours ----- 10 -------------- 24
1 day -------- 10 ------------- 144
Transparency: This one is pretty self-explanatory but only applies to the Profile bars
% change for a bar: This one indicates how precise each bar will be, but if you go too low the script becomes too heavy and stop running
Bar limit: Limits the amounts of bars the script is run for (ae for the last 1000 bars). Lower = faster loading, too high will stop running
UI color: Color and transparency of the center line and the box surrounding the whole profile

Swing Assassin's Consolidated ScriptI put this script together to essentially consolidate a number of scripts that I use on a daily basis into one script. This is an ongoing improvement effort, so there may be some garbage in here right now so keep that in mind if you intend to use this to help in your trading.
There are 5 moving averages (Hull). I use the Fast, Mid and Slow to find entries after I us the Medium Slow and Super Slow to identify a trend. Otherwise, I have those three turned off.
This script also uses Bollinger Bands which I literally cannot trade without.
The script also has anchored VWAP , automated support/resistance lines, and a homebrewed Volume Profile that is a copy from Ildar Akhmetgaleev's indicator "Poor Man's Volume Profile" used under Mozilla Public License Version 2.0.

SpaceTime Profile CompositesSpaceTime Profile Composites
SpaceTime Profiel Composites provides an alternative composite builder to the existing solution in the SpaceTime Profile Advanced.
Using the new pinev5 I utilize the ability for user confirmed data to give them the choice in time in a more interactable and user friendly way.
The main advantage of this is the ability to create multiple composites without multiple uses of SpaceTime Profile Advanced, additionally the user can select the indicator and edit the composite start time using the chart as opposed to the date picker in pine.
The indicator is fully fleshed out with all the features:
PoC
NPoC
Single Prints
Naked Single Prints
Value Area
Value Area Levels
Naked Value Area Levels
Excess
Poor highs and lows
Initial Balance
Auto TickSize
Auto TickSize
This has been heavily adjusted to allow greater detail, and less reliant on volatility, should this work well consistently SpaceTime Profile Advanced may also recieve this change to auto ticksize.
How To Use
Composites are best utilized when multiple value areas are overlapping with their POCS in range of the previous VA's, using a composite
the user is able to generate the greater picture for how this area will provide useful levels of interest, instead of multiple smaller profiles, the user can utilize one larger profile to give more accurate levels of reaction.

Single PrintsThis indicator plots Single Print levels when applied on the 30min time frame.
In the settings the user can change:
Level Colors
Level Width
Level Linestyle (Dotted, Dashed, Solid)
Toggle Retested Levels on/off
Toggle Profile Mode on/off
______________________________________________
Limitations:
1. Must be on 30min time frame. If you use other time frames to trade I recommend using a separate chart.
2. By default, retested levels are set to hide. For some tickers, the time/space between the creation of the Single Print, and the retest of that Single Print is too large. This causes errors due to a limitation from Tradingview. However, this limitation does not effect untested (naked) Single Prints. Naked Single Prints can be drawn accurately for any ticker without error, so that is the default setting.
______________________________________________
About Single Prints:
Single Prints come from Market Profile charting.
They represent a breakout from an old area of value to a newer area of value.
After a confirmed breakout from value, the extreme of the old area of value is the Single Print.
The level is often sensitive and can provide good trade locations especially on lower time frames.

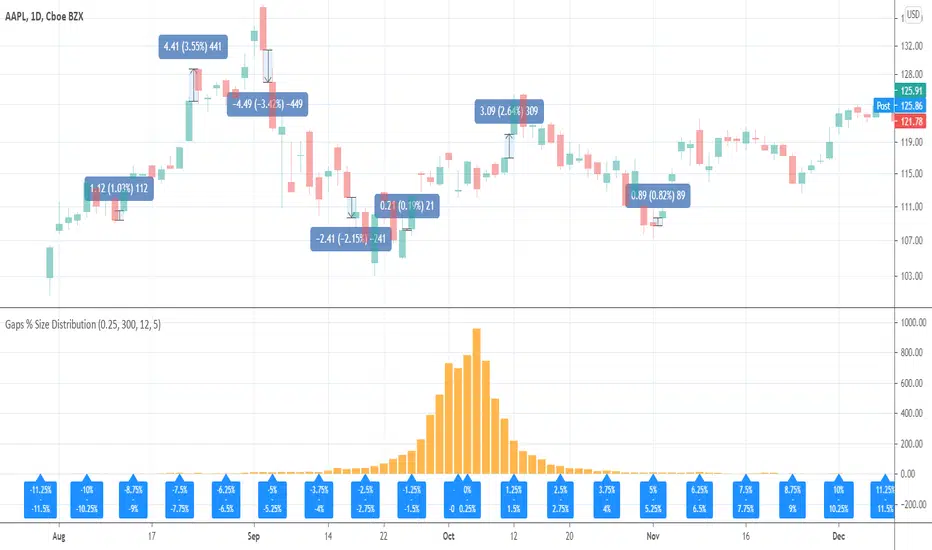
Gaps % Size DistributionThis tool is to visualize the distribution of gap % sizes, i.e. those things that I marked on the main chart. The tool uses the entire history of an instrument.
The detalization depends on the Binning Step parameter. The lower chart timeframe the lower that step should be.
Good luck.
PRIME - Krypto Kiss+CCI+VPIntroducing from Prime Academy, the experimental "KryptO Kis$" algorithm, which combines our most powerful scripts all in one indicator. Available to the user are a full options platform to adjust parameters as well as individually blind indications for precise chart analysis. The following algorithms have been utilized:
* Prime Pulse (3 Candle System) - The original impulse and momentum indication system, it take rsi and tsi data to provide users with the indication of initial impulses, as well as a yellow candle to ascertain when there is a possible change of momentum in the current impulse.
* 5 SMA - The original Sniper Cross system seen from previous strategies, using the 4, 21, 50, 185, and 800 SMA's to determine changes of trend, continuation and support levels.
*CCI Indication on Chart - The system provides realtime CCI data in correlation to price positions within the general chart matrix, receiving system variables from various crosses on the 100 to -100 scale for CCI. Bullish and Bearish indications are clearly defined by separate colors.
* Volume Profile with tags - This system provides current volume data for the current time frame and sequence, also giving available tags at prices holding high volume orders, historically and present as indicated by the difference in length of indications. color saturations indicate the intensity of volume at the price in question .
* Shadow ZoneZ - Provides Support and resistance levels using rsi overbought and over sold data, sourced on the close of previous prices. Also embedded in the code is an additional volume confluence via indications of dotted lines with prices available, giving sequence positions of "Whales" and their support and resistance levels by order volume at price.
* An added bonus of the Shadow ZoneZ is the auto trend line and trend channel function , as well as the highlighted zones of liquidity waiting to be filled from previous impulses and lack of present retracements.
Any questions can be directed here on site via Direct Message. Any feedback is welcomed, and thank you in advance. Trade Well, Family!
- Dee Prime
//Disclaimer:
//Trading success is all about following your trading strategy and the indicators should fit within your trading strategy, and not to be traded upon solely
//The script is for informational and educational purposes only. Use of the script does not constitute professional and/or financial advice.
//You alone have the sole responsibility of evaluating the script output and risks associated with the use of the script.
//In exchange for using the script, you agree not to hold the publishing TradingView user liable for any possible claim for damages arising from any decision you make based on use of the script.
Waindrops [Makit0]█ OVERALL
Plot waindrops (custom volume profiles) on user defined periods, for each period you get high and low, it slices each period in half to get independent vwap, volume profile and the volume traded per price at each half.
It works on intraday charts only, up to 720m (12H). It can plot balanced or unbalanced waindrops, and volume profiles up to 24H sessions.
As example you can setup unbalanced periods to get independent volume profiles for the overnight and cash sessions on the futures market, or 24H periods to get the full session volume profile of EURUSD
The purpose of this indicator is twofold:
1 — from a Chartist point of view, to have an indicator which displays the volume in a more readable way
2 — from a Pine Coder point of view, to have an example of use for two very powerful tools on Pine Script:
• the recently updated drawing limit to 500 (from 50)
• the recently ability to use drawings arrays (lines and labels)
If you are new to Pine Script and you are learning how to code, I hope you read all the code and comments on this indicator, all is designed for you,
the variables and functions names, the sometimes too big explanations, the overall structure of the code, all is intended as an example on how to code
in Pine Script a specific indicator from a very good specification in form of white paper
If you wanna learn Pine Script form scratch just start HERE
In case you have any kind of problem with Pine Script please use some of the awesome resources at our disposal: USRMAN , REFMAN , AWESOMENESS , MAGIC
█ FEATURES
Waindrops are a different way of seeing the volume and price plotted in a chart, its a volume profile indicator where you can see the volume of each price level
plotted as a vertical histogram for each half of a custom period. By default the period is 60 so it plots an independent volume profile each 30m
You can think of each waindrop as an user defined candlestick or bar with four key values:
• high of the period
• low of the period
• left vwap (volume weighted average price of the first half period)
• right vwap (volume weighted average price of the second half period)
The waindrop can have 3 different colors (configurable by the user):
• GREEN: when the right vwap is higher than the left vwap (bullish sentiment )
• RED: when the right vwap is lower than the left vwap (bearish sentiment )
• BLUE: when the right vwap is equal than the left vwap ( neutral sentiment )
KEY FEATURES
• Help menu
• Custom periods
• Central bars
• Left/Right VWAPs
• Custom central bars and vwaps: color and pixels
• Highly configurable volume histogram: execution window, ticks, pixels, color, update frequency and fine tuning the neutral meaning
• Volume labels with custom size and color
• Tracking price dot to be able to see the current price when you hide your default candlesticks or bars
█ SETTINGS
Click here or set any impar period to see the HELP INFO : show the HELP INFO, if it is activated the indicator will not plot
PERIOD SIZE (max 2880 min) : waindrop size in minutes, default 60, max 2880 to allow the first half of a 48H period as a full session volume profile
BARS : show the central and vwap bars, default true
Central bars : show the central bars, default true
VWAP bars : show the left and right vwap bars, default true
Bars pixels : width of the bars in pixels, default 2
Bars color mode : bars color behavior
• BARS : gets the color from the 'Bars color' option on the settings panel
• HISTOGRAM : gets the color from the Bearish/Bullish/Neutral Histogram color options from the settings panel
Bars color : color for the central and vwap bars, default white
HISTOGRAM show the volume histogram, default true
Execution window (x24H) : last 24H periods where the volume funcionality will be plotted, default 5
Ticks per bar (max 50) : width in ticks of each histogram bar, default 2
Updates per period : number of times the histogram will update
• ONE : update at the last bar of the period
• TWO : update at the last bar of each half period
• FOUR : slice the period in 4 quarters and updates at the last bar of each of them
• EACH BAR : updates at the close of each bar
Pixels per bar : width in pixels of each histogram bar, default 4
Neutral Treshold (ticks) : delta in ticks between left and right vwaps to identify a waindrop as neutral, default 0
Bearish Histogram color : histogram color when right vwap is lower than left vwap, default red
Bullish Histogram color : histogram color when right vwap is higher than left vwap, default green
Neutral Histogram color : histogram color when the delta between right and left vwaps is equal or lower than the Neutral treshold, default blue
VOLUME LABELS : show volume labels
Volume labels color : color for the volume labels, default white
Volume Labels size : text size for the volume labels, choose between AUTO, TINY, SMALL, NORMAL or LARGE, default TINY
TRACK PRICE : show a yellow ball tracking the last price, default true
█ LIMITS
This indicator only works on intraday charts (minutes only) up to 12H (720m), the lower chart timeframe you can use is 1m
This indicator needs price, time and volume to work, it will not work on an index (there is no volume), the execution will not be allowed
The histogram (volume profile) can be plotted on 24H sessions as limit but you can plot several 24H sessions
█ ERRORS AND PERFORMANCE
Depending on the choosed settings, the script performance will be highly affected and it will experience errors
Two of the more common errors it can throw are:
• Calculation takes too long to execute
• Loop takes too long
The indicator performance is highly related to the underlying volatility (tick wise), the script takes each candlestick or bar and for each tick in it stores the price and volume, if the ticker in your chart has thousands and thousands of ticks per bar the indicator will throw an error for sure, it can not calculate in time such amount of ticks.
What all of that means? Simply put, this will throw error on the BITCOIN pair BTCUSD (high volatility with tick size 0.01) because it has too many ticks per bar, but lucky you it will work just fine on the futures contract BTC1! (tick size 5) because it has a lot less ticks per bar
There are some options you can fine tune to boost the script performance, the more demanding option in terms of resources consumption is Updates per period , by default is maxed out so lowering this setting will improve the performance in a high way.
If you wanna know more about how to improve the script performance, read the HELP INFO accessible from the settings panel
█ HOW-TO SETUP
The basic parameters to adjust are Period size , Ticks per bar and Pixels per bar
• Period size is the main setting, defines the waindrop size, to get a better looking histogram set bigger period and smaller chart timeframe
• Ticks per bar is the tricky one, adjust it differently for each underlying (ticker) volatility wise, for some you will need a low value, for others a high one.
To get a more accurate histogram set it as lower as you can (min value is 1)
• Pixels per bar allows you to adjust the width of each histogram bar, with it you can adjust the blank space between them or allow overlaping
You must play with these three parameters until you obtain the desired histogram: smoother, sharper, etc...
These are some of the different kind of charts you can setup thru the settings:
• Balanced Waindrops (default): charts with waindrops where the two halfs are of same size.
This is the default chart, just select a period (30m, 60m, 120m, 240m, pick your poison), adjust the histogram ticks and pixels and watch
• Unbalanced Waindrops: chart with waindrops where the two halfs are of different sizes.
Do you trade futures and want to plot a waindrop with the first half for the overnight session and the second half for the cash session? you got it;
just adjust the period to 1860 for any CME ticker (like ES1! for example) adjust the histogram ticks and pixels and watch
• Full Session Volume Profile: chart with waindrops where only the first half plots.
Do you use Volume profile to analize the market? Lucky you, now you can trick this one to plot it, just try a period of 780 on SPY, 2760 on ES1!, or 2880 on EURUSD
remember to adjust the histogram ticks and pixels for each underlying
• Only Bars: charts with only central and vwap bars plotted, simply deactivate the histogram and volume labels
• Only Histogram: charts with only the histogram plotted (volume profile charts), simply deactivate the bars and volume labels
• Only Volume: charts with only the raw volume numbers plotted, simply deactivate the bars and histogram
If you wanna know more about custom full session periods for different asset classes, read the HELP INFO accessible from the settings panel
EXAMPLES
Full Session Volume Profile on MES 5m chart:
Full Session Unbalanced Waindrop on MNQ 2m chart (left side Overnight session, right side Cash Session):
The following examples will have the exact same charts but on four different tickers representing a futures contract, a forex pair, an etf and a stock.
We are doing this to be able to see the different parameters we need for plotting the same kind of chart on different assets
The chart composition is as follows:
• Left side: Volume Labels chart (period 10)
• Upper Right side: Waindrops (period 60)
• Lower Right side: Full Session Volume Profile
The first example will specify the main parameters, the rest of the charts will have only the differences
MES :
• Left: Period size: 10, Bars: uncheck, Histogram: uncheck, Execution window: 1, Ticks per bar: 2, Updates per period: EACH BAR,
Pixels per bar: 4, Volume labels: check, Track price: check
• Upper Right: Period size: 60, Bars: check, Bars color mode: HISTOGRAM, Histogram: check, Execution window: 2, Ticks per bar: 2,
Updates per period: EACH BAR, Pixels per bar: 4, Volume labels: uncheck, Track price: check
• Lower Right: Period size: 2760, Bars: uncheck, Histogram: check, Execution window: 1, Ticks per bar: 1, Updates per period: EACH BAR,
Pixels per bar: 2, Volume labels: uncheck, Track price: check
EURUSD :
• Upper Right: Ticks per bar: 10
• Lower Right: Period size: 2880, Ticks per bar: 1, Pixels per bar: 1
SPY :
• Left: Ticks per bar: 3
• Upper Right: Ticks per bar: 5, Pixels per bar: 3
• Lower Right: Period size: 780, Ticks per bar: 2, Pixels per bar: 2
AAPL :
• Left: Ticks per bar: 2
• Upper Right: Ticks per bar: 6, Pixels per bar: 3
• Lower Right: Period size: 780, Ticks per bar: 1, Pixels per bar: 2
█ THANKS TO
PineCoders for all they do, all the tools and help they provide and their involvement in making a better community
scarf for the idea of coding a waindrops like indicator, I did not know something like that existed at all
All the Pine Coders, Pine Pros and Pine Wizards, people who share their work and knowledge for the sake of it and helping others, I'm very grateful indeed
I'm learning at each step of the way from you all, thanks for this awesome community;
Opensource and shared knowledge: this is the way! (said with canned voice from inside my helmet :D)
█ NOTE
This description was formatted following THIS guidelines
═════════════════════════════════════════════════════════════════════════
I sincerely hope you enjoy reading and using this work as much as I enjoyed developing it :D
GOOD LUCK AND HAPPY TRADING!

Silen's Pseudo VPVR / Pseudo Volume Profile Custom RangeDisclamer: This indicator does not use actual Volume data and doesn't display any Volume data. It creates a pseudo Volume Profile by counting the high-low-2 values of candles and simulates something that is similar to a Volume Profile without using any Volume data.
Core facts:
Creates a pseudo Volume Profile by counting values of candles and sorting them into a Profile.
Works for charts that don't provide any Volume Information.
Can display up to 5 different Value Levels.
Value level colors are (from largest to smallest level): Red, Orange, Yellow, Green, Blue.
The Value levels can be used as Support and Resistance indicators.
The Custom Range of the Volume Profile can be adjusted from 10 to 1500 bars.
Much faster than the other custom pseudo VPVRs out there.
Shortcomings:
As the chart progresses with bars the line positions will distort to the left side. Refreshing the tradingview page or switching to another time interval fixes this. I might fix this issue in the future.
Does not use actual Volume nor display actual Volume.
Note: For those who wondered what happened to my first version of this indicator: It got taken down by Tradingview because it was misleading as to using the words "Volume Profile" and "Visible Range". I fully support their decision and I hope I could clear any misunderstandings! Give their team a heads up for the hard work they're doing in keeping this place clean and well organized!
Enjoy! :)

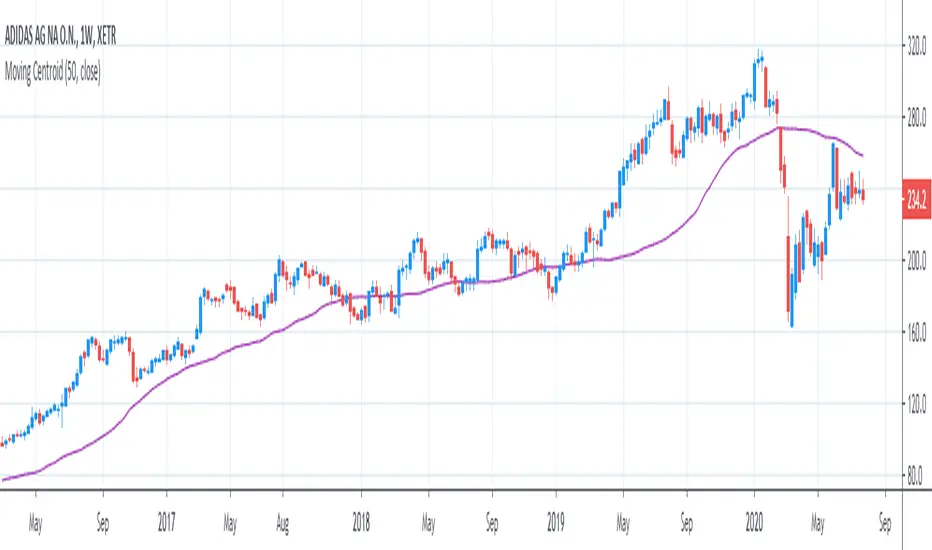
[R&D] Moving CentroidThis script utilizes this concept. Instead of weighting by volume, it weights by amount of price action on every close price of the rolling window. I assume it can be used as an additional reference point for price mode and price antimode.
it is directly connected with Market (not volume) profile, or TPO charts.
The algorithm:
1) takes a rolling window of, for example, 50 data points of close prices:
2) for each of this closing prices, the algorithm will check how many bars touched this close price.
3) then: sum of datapoints * weights/sum of weights
Since the logic is implemented in pretty non-efficient way, the script sometimes can take time to make calculations. Moreover, it calculates the centroid taking into account only close prices, not every tick. of a given rolling window That's why it's still experimental.
Poor man's volume profileThis is an attempt to get something more or less similar to the volume profile for free.
The code is generated using a template. To change the settings, you may need to regenerate the code. The code has a link to the repository with the template.
Volume Profile [Makit0]VOLUME PROFILE INDICATOR v0.5 beta
Volume Profile is suitable for day and swing trading on stock and futures markets, is a volume based indicator that gives you 6 key values for each session: POC, VAH, VAL, profile HIGH, LOW and MID levels. This project was born on the idea of plotting the RTH sessions Value Areas for /ES in an automated way, but you can select between 3 different sessions: RTH, GLOBEX and FULL sessions.
Some basic concepts:
- Volume Profile calculates the total volume for the session at each price level and give us market generated information about what price and range of prices are the most traded (where the value is)
- Value Area (VA): range of prices where 70% of the session volume is traded
- Value Area High (VAH): highest price within VA
- Value Area Low (VAL): lowest price within VA
- Point of Control (POC): the most traded price of the session (with the most volume)
- Session HIGH, LOW and MID levels are also important
There are a huge amount of things to know of Market Profile and Auction Theory like types of days, types of openings, relationships between value areas and openings... for those interested Jim Dalton's work is the way to come
I'm in my 2nd trading year and my goal for this year is learning to daytrade the futures markets thru the lens of Market Profile
For info on Volume Profile: TV Volume Profile wiki page at www.tradingview.com
For info on Market Profile and Market Auction Theory: Jim Dalton's book Mind over markets (this is a MUST)
BE AWARE: this indicator is based on the current chart's time interval and it only plots on 1, 2, 3, 5, 10, 15 and 30 minutes charts.
This is the correlation table TV uses in the Volume Profile Session Volume indicator (from the wiki above)
Chart Indicator
1 - 5 1
6 - 15 5
16 - 30 10
31 - 60 15
61 - 120 30
121 - 1D 60
This indicator doesn't follow that correlation, it doesn't get the volume data from a lower timeframe, it gets the data from the current chart resolution.
FEATURES
- 6 key values for each session: POC (solid yellow), VAH (solid red), VAL (solid green), profile HIGH (dashed silver), LOW (dashed silver) and MID (dotted silver) levels
- 3 sessions to choose for: RTH, GLOBEX and FULL
- select the numbers of sessions to plot by adding 12 hours periods back in time
- show/hide POC
- show/hide VAH & VAL
- show/hide session HIGH, LOW & MID levels
- highlight the periods of time out of the session (silver)
- extend the plotted lines all the way to the right, be careful this can turn the chart unreadable if there are a lot of sessions and lines plotted
SETTINGS
- Session: select between RTH (8:30 to 15:15 CT), GLOBEX (17:00 to 8:30 CT) and FULL (17:00 to 15:15 CT) sessions. RTH by default
- Last 12 hour periods to show: select the deph of the study by adding periods, for example, 60 periods are 30 natural days and around 22 trading days. 1 period by default
- Show POC (Point of Control): show/hide POC line. true by default
- Show VA (Value Area High & Low): show/hide VAH & VAL lines. true by default
- Show Range (Session High, Low & Mid): show/hide session HIGH, LOW & MID lines. true by default
- Highlight out of session: show/hide a silver shadow over the non session periods. true by default
- Extension: Extend all the plotted lines to the right. false by default
HOW TO SETUP
BE AWARE THIS INDICATOR PLOTS ONLY IN THE FOLLOWING CHART RESOLUTIONS: 1, 2, 3, 5, 10, 15 AND 30 MINUTES CHARTS. YOU MUST SELECT ONE OF THIS RESOLUTIONS TO THE INDICATOR BE ABLE TO PLOT
- By default this indicator plots all the levels for the last RTH session within the last 12 hours, if there is no plot try to adjust the 12 hours periods until the seesion and the periods match
- For Globex/Full sessions just select what you want from the dropdown menu and adjust the periods to plot the values
- Show or hide the levels you want with the 3 groups: POC line, VA lines and Session Range lines
- The highlight and extension options are for a better visibility of the levels as POC or VAH/VAL
THANKS TO
@watsonexchange for all the help, ideas and insights on this and the last two indicators (Market Delta & Market Internals) I'm working on my way to a 'clean chart' but for me it's not an easy path
@PineCoders for all the amazing stuff they do and all the help and tools they provide, in special the Script-Stopwatch at that was key in lowering this indicator's execution time
All the TV and Pine community, open source and shared knowledge are indeed the best way to help each other
IF YOU REALLY LIKE THIS WORK, please send me a comment or a private message and TELL ME WHAT you trade, HOW you trade it and your FAVOURITE SETUP for pulling out money from the market in a consistent basis, I'm learning to trade (this is my 2nd year) and I need all the help I can get
GOOD LUCK AND HAPPY TRADING

Volume Analysis Tool - CryptoShoots Volume Analysis Tool
Volume Analysis Tool is a technique to simulate tick volume data to get Buying volume and Selling Volume in each bar to any asset .
*** Features
* Delta Volume Mode .
* Detailed Volume mode - Buying and selling for each candle .
* Better understanding to the Accumulation and Distribution using volume analysis easily .
*** Usage
* Turn only one Mode(Delta or Detailed ) ON to let the indicator Shows you its magic .
* Volume Search : by default it's 1 MIN . Note : if you want to change the value understand that the lower the value the better the Accuracy .
//
As a rule of thump use 1 MIN Volume Search for these time frames ( from 5 min to 4 hours ) and 5 min Volume Search for Daily time frame .
Market Profile for Futures with Session and After Hours SplitAdapted existing Market Profile scripts to be move suitable for Futures Markets with Session and After Hours split
Script Provides split Market Profiles for Session and After Hours
Users can customize the Session and AH hours inputs to suit any ticker and their interpretation of prime and non-prime hours

Hybrid Profile [DW]This is an experimental study inspired by J. Peter Steidlmayer's Market Profile tool with an alternative set of calculations for analyzing price action and distribution over a defined interval.
This tool is geared toward finding price reactive points for better entry and exit positions.
In this script, price range over a user defined interval (up to 4000 bars) is divided into 50 sections, then TPOs are counted for each section to generate the distribution histogram. Histogram lines are calculated in real time, and recalculate on each new bar.
Areas of significance are displayed as purple lines in the histogram, making it incredibly simple to identify levels that price will likely react to. The significance sensitivity can be manually adjusted for desired output.
Rather than using POC, I created a series of proprietary calculations to generate what I call the Point Of Focus (POF). This line is similar to POC, but does not always follow the highest count in the distribution.
The POF is designed to experience less whipsaws than POC, which makes trading using the POF much simpler since its value is more consistent. On historical data, price has shown to either revert to or launch from the POF rather frequently.
Unlike a conventional Market Profile, this profile doesn't have a "value area". Instead it has a Mean Value Zone, which is calculated using a series of custom VWAP calculations. The output is similar to VA, but much smoother.
This script has a built in tick volume substitution for charts with no real volume data, making all elements of the script compatible with any cryptocurrency, stock, currency pair, or index you want to analyze.
A bar color scheme is included within this script which can be used to help determine dominant trend and local extremes of the interval.
This tool is not necessarily better or worse than the classic Market Profile, nor is it a replacement for Volume Profile.
However, this is a powerful alternative that can both simplify and improve your technical analysis.
Jurik RSX+Hello friends,
Meet Jurik RSX+, a powerful standalone oscillator that also integrates perfectly with Profitable Jurik RSX optimizer.
It enhances Jurik's original RSX by introducing a Values Distribution Profile , Point of Control (POC) , and Value Area visualization — transforming a traditional oscillator into a statistically guided market sentiment tool.
These additions help identify where true equilibrium, overbought, and oversold zones occur based on the actual behavior of RSX values rather than fixed numeric levels.
🛠 How It Works
Jurik RSX+ applies advanced smoothing and statistical profiling to analyze how RSX values are distributed over time.
The Values Distribution Profile builds a frequency map of RSX activity, allowing traders to see:
The Point of Control (POC) — the statistically dominant RSX level.
The Value Area — the range where RSX values cluster most frequently.
By studying this distribution, the indicator reveals true overbought, oversold, and midline zones , adapting dynamically to different instruments and market conditions.
On top of that, traders can construct fully customized Buy/Sell signals using crossover conditions between RSX, Signal Line, Midline, or POC — creating a flexible signal generation framework.
🔥 Key Features
Jurik RSX foundation with enhanced smoothing and adaptive distribution modeling
Values Distribution Profile identifying statistically balanced and extreme zones
Point of Control (POC) and Value Area visualization for precision analysis
Customizable Buy/Sell logic — up to 4 Buy and 4 Sell slots using flexible crossover conditions
Strategy Mode preventing overlapping Buy/Sell signals
Multiple visualization styles — Labels , Dots , Stripes , or combined modes
Integrated alerts for RSX, POC, and OB/OS conditions
If you'd like access or have any questions, feel free to reach out to me directly via DM.
👋 Good luck and happy trading!
Script a pagamento
