Put/Call RatioPut/Call Ratio Indicator
This indicator visualizes the Put/Call Ratio for various market symbols, helping traders assess market sentiment and potential reversals. It offers a dropdown menu to select from a range of Put/Call Ratios, including broad equities (CBOE), major indices (SPX, QQQ, IWM, VIX), and individual stocks (TSLA, GOOG, META, AMZN, MSFT, INTC).
The indicator plots the Put/Call Ratio with adjustable moving averages and standard deviation bands to highlight overbought or oversold conditions. A short-term moving average (default: 10 periods) is displayed with trend-based coloring, while longer-term moving averages (defaults: 30 and 200 periods) are calculated but hidden by default. Bands at 1, 1.5, and 2 standard deviations provide context for extreme readings.
Key Overbought/Oversold Signals:
Short-Term Extremes: The 10-day moving average moves beyond 1 standard deviation from the 200-day moving average, signaling potential overbought (above) or oversold (below) conditions. This will be highlighted by red or green background color.
Ratio Extremes: The Put/Call Ratio line itself crosses outside 2 standard deviations from the 200-day moving average, indicating stronger overbought or oversold zones.
Conditional coloring of the ratio line reflects its position relative to the bands, and background shading highlights when the short-term moving average crosses key levels.
Key Features:
Selectable Put/Call Ratio symbols.
Trend-colored moving averages.
Standard deviation bands for volatility analysis.
Dynamic line and background coloring for quick insights.
Usage:
Use this indicator to gauge market sentiment—high ratios may suggest bearish sentiment or oversold conditions, while low ratios may indicate bullish sentiment or overbought conditions. Combine with price action or other tools for confirmation.
Put

NSE Option Chain
This Indicator show Options Data on signal dashboard , that help trader to analyse the market.
Options data consist of two things , Call and Put.
Every Strike has its Call and Put price.
So if user Opens any chart which is traded in options , dashboard will show total 16 Call and 16 Put strikes
8 Above from ATM and 8 Below from ATM.
On left hand side of dashboard there is Call data and on right side there is Put data.
Call side datas are , Call LTP which is latest price of that call strike , Call Chg which is change in points from previous day close and third is Call % which is % change from previous day close.
Same is on put side.
Color code is done based on positive or negative of data. If change or % is negative then color is red else green.
ATM strike data is plotted in bold
Inputs :
Spot Symbol Input for Option dashboard
Expiry date of that option contract
Strike interval between 2 strikes
Reference ATM strike ( user should keep this input as current ATM strike )
How to Use :
If dashboard shows call side is negative and put side is positive then that means market Bearish , because falling market leads to falling price of call and increase in price of Put.
Similarly if put is negative and call is positive then market is bullish.
This dashboard give trend conformation , trader should take other conformation also before taking trade.

Put to Call Ratio CorrelationHello!
Excited to share this with the community!
This is actually a very simple indicator but actually usurpingly helpful, especially for those who trade indices such as SPX, IWM, QQQ, etc.
Before I get into the indicator itself, let me explain to you its development.
I have been interested in the use of option data to detect sentiment and potential reversals in the market. However, I found option data on its own is full of noise. Its very difficult if not impossible for a trader to make their own subjective assessment about how option data is reflecting market sentiment.
Generally speaking, put to call ratios generally range between 0.8 to 1.1 on average. Unless there is a dramatic pump in calls or puts causing an aggressive spike up to over this range, or fall below this range, its really difficult to make the subjective assessment about what is happening.
So what I thought about trying to do was, instead of looking directly at put to call ratio, why not see what happens when you perform a correlation analysis of the PTC ratio to the underlying stock.
So I tried this in pinescript, pulling for Tradingview's ticker PCC (Total Equity Put to Call Ratio) and using the ta.correlation function against whichever ticker I was looking at.
I played around with this idea a bit, pulled the data into excel and from this I found something interesting. When there is a very significant negative or positive correlation between PTC ratio and price movement, we see a reversal impending. In fact, a significant negative or positive correlation (defined as a R value of 0.8 or higher or -0.8 or lower) corresponded to a stock reversal about 92% of the time when data was pulled on a 5 minute timeframe on SPY.
But wait, what is a correlation?
If you are not already familiar, a correlation is simply a statistical relationship. It is defined with a Pearson R correlation value which ranges from 0 (no correlation) to 1 (significant positive correlation) and 0 to -1 (significant negative correlation).
So what does positive vs negative mean?
A significant positive correlation means the correlation is moving the same as the underlying. In the case of this indicator, if there is a significant positive correlation could mean the stock price is climbing at the same time as the PTC ratio.
Inversely, it could mean the stock price is falling as well as the PTC ratio.
A significant negative correlation means the correlation is moving in the opposite direction. So in this case, if the stock price is climbing and the PTC ratio is falling proportionately, we would see a significant negative correlation.
So how does this work in real life?
To answer this, let's get into the actual indicator!
In the image above, you will see the arrow pointing to an area of significant POSITIVE correlation.
The indicator will paint the bars on the actual chart purple (customizable of course) to signify this is an area of significant correlation.
So, in the above example this means that the PTC ratio is increase proportionately to the increase in the stock price in the SAME direction (Puts are going up proportionately to the stock price). Thus, we can make the assumption that the underlying sentiment is overwhelmingly BEARISH. Why? Because option trading activity is significantly proportionate to stock movement, meaning that there is consensus among the options being traded and the movement of the market itself.
And in the above example we will see, the stock does indeed end up selling:
In this case, IWM fell roughly 1 point from where there was bearish consensus in the market.
Let's use this same trading day and same example to show the inverse:
You will see a little bit later, a significant NEGATIVE correlation developed.
In this case identified, the stock wise RISING and the PTC ratio was FALLING.
This means that Puts were not being bought up as much as calls and the sentiment had shifted to bullish .
And from that point, IWM ended up going up an additional 0.75 points from where there was a significant INVERSE correlation.
So you can see that it is helpful for identifying reversals. But what is also can be used for is identifying areas of LOW conviction. Meaning, areas where there really is no relationship between option activity and stock movement. Let's take spy on the 1 hour timeframe for this example:
You can see in the above example there really is no consensus in the option trading activity with the overarching sentiment. The price action is choppy and so too is option trading activity. Option traders are not pushing too far in one direction or the other. We can also see the lack of conviction in the option trading activity by looking at the correlation SMA (the white line).
When a ticker is experiencing volatile and good movement up and down, the SMA will generally trade to the top of the correlation range (roughly + 1.0) and then make a move down to the bottom (roughly - 1.0), see the example below:
When the SMA is not moving much and accumulating around the centerline, it generally means a lot of indecision.
Additional Indicator Information:
As I have said, the indicator is very simple. It pulls the data from the ticker PCC and runs a correlation assessment against whichever ticker you are on.
PCC pulls averaged data from all equities within the market and is not limited to a single equity. As such, its helpful to use this with indices such as SPY, IWM and QQQ, but I have had success with using it on individual tickers such as NVDA and AMD.
The correlation length is defaulted to 14. You can modify it if you wish, but I do recommend leaving it at this as the default and the testing I have done with this have all been on the 14 correlation length.
You can chose to smooth the SMA over whichever length of period you wish as well.
When the indicator is approaching a significant negative or positive relationship, you will see the indicator flash red in the upper or lower band to signify the relationship. As well, the chart will change the bar colour to purple:
Everything else is pretty straight forward.
Let me know your questions/comments or suggestions around the indicator and its applications.
As always, no indicator is meant to provide a single, reliable strategy to your trading regimen and no indicator or group of indicators should be relied on solely. Be sure to do your own analysis and assessments of the stock prior to taking any trades.
Safe trades everyone!

Accumulated Put/Call Ratio V2This is an updated version of the Accumulated P/C Ratio. Some changes include:
- Pinescript privacy changed from protected to open.
- Utilizes the "request.security_lower_tf" function for weekly and monthly charts.
- Now acquires and sums raw put volume (ticker: PVOL) and call volume (ticker: CVOL) separately, then divides the aggregate put to aggregate call to get the P/C ratio, as opposed to the original version which directly sums the put call ratio (ticker: PCC). Mathematically this calculation makes more sense, but the major drawback of this change seems to be that PVOL and CVOL don't have as much historical data as PCC.
The way to interpret the indicator is the same as the original version - higher values are bullish while lower values are bearish. A solid (0 transparency) bar means that the value is beyond 3 standard deviations within a particular period.

Implied Volatility Estimator using Black Scholes [Loxx]Implied Volatility Estimator using Black Scholes derives a estimation of implied volatility using the Black Scholes options pricing model. The Bisection algorithm is used for our purposes here. This includes the ability to adjust for dividends.
Implied Volatility
The implied volatility (IV) of an option contract is that value of the volatility of the underlying instrument which, when input in an option pricing model (such as Black–Scholes), will return a theoretical value equal to the current market price of that option. The VIX , in contrast, is a model-free estimate of Implied Volatility. The latter is viewed as being important because it represents a measure of risk for the underlying asset. Elevated Implied Volatility suggests that risks to underlying are also elevated. Ordinarily, to estimate implied volatility we rely upon Black-Scholes (1973). This implies that we are prepared to accept the assumptions of Black Scholes (1973).
Inputs
Spot price: select from 33 different types of price inputs
Strike Price: the strike price of the option you're wishing to model
Market Price: this is the market price of the option; choose, last, bid, or ask to see different results
Historical Volatility Period: the input period for historical volatility ; historical volatility isn't used in the Bisection algo, this is to serve as a comparison, even though historical volatility is from price movement of the underlying asset where as implied volatility is the volatility of the option
Historical Volatility Type: choose from various types of implied volatility , search my indicators for details on each of these
Option Base Currency: this is to calculate the risk-free rate, this is used if you wish to automatically calculate the risk-free rate instead of using the manual input. this uses the 10 year bold yield of the corresponding country
% Manual Risk-free Rate: here you can manually enter the risk-free rate
Use manual input for Risk-free Rate? : choose manual or automatic for risk-free rate
% Manual Yearly Dividend Yield: here you can manually enter the yearly dividend yield
Adjust for Dividends?: choose if you even want to use use dividends
Automatically Calculate Yearly Dividend Yield? choose if you want to use automatic vs manual dividend yield calculation
Time Now Type: choose how you want to calculate time right now, see the tool tip
Days in Year: choose how many days in the year, 365 for all days, 252 for trading days, etc
Hours Per Day: how many hours per day? 24, 8 working hours, or 6.5 trading hours
Expiry date settings: here you can specify the exact time the option expires
*** the algorithm inputs for low and high aren't to be changed unless you're working through the mathematics of how Bisection works.
Included
Option pricing panel
Loxx's Expanded Source Types
Related Indicators
Cox-Ross-Rubinstein Binomial Tree Options Pricing Model

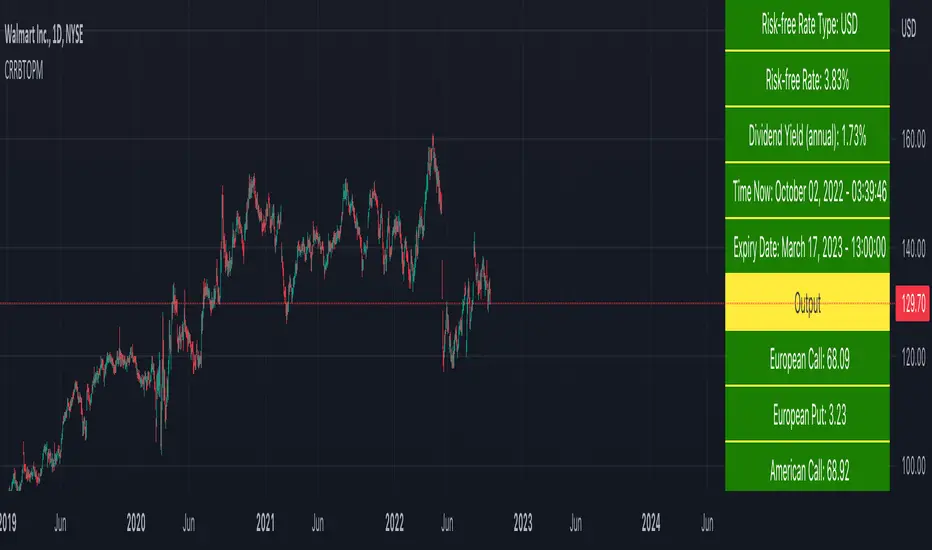
Cox-Ross-Rubinstein Binomial Tree Options Pricing Model [Loxx]Cox-Ross-Rubinstein Binomial Tree Options Pricing Model is an options pricing panel calculated using an N-iteration (limited to 300 in Pine Script due to matrices size limits) "discrete-time" (lattice based) method to approximate the closed-form Black–Scholes formula. Joshi (2008) outlined varying binomial options pricing model furnishes a numerical approach for the valuation of options. Significantly, the American analogue can be estimated using the binomial tree. This indicator is the complex calculation for Binomial option pricing. Most folks take a shortcut and only calculate 2 iterations. I've coded this to allow for up to 300 iterations. This can be used to price American Puts/Calls and European Puts/Calls. I'll be updating this indicator will be updated with additional features over time. If you would like to learn more about options, I suggest you check out the book textbook Options, Futures and other Derivative by John C Hull.
***This indicator only works on the daily timeframe!***
A quick graphic of what this all means:
In the graphic, "n" are the steps, in this case we can do up to 300, in production we'd need to do 5-15K. That's a lot of steps! You can see here how the binomial tree fans out. As I said previously, most folks only calculate 2 steps, here we are calculating up to 300.
Want to learn more about Simple Introduction to Cox, Ross Rubinstein (1979) ?
Watch this short series "Introduction to Basic Cox, Ross and Rubinstein (1979) model."
Limitations of Black Scholes options pricing model
This is a widely used and well-known options pricing model, factors in current stock price, options strike price, time until expiration (denoted as a percent of a year), and risk-free interest rates. The Black-Scholes Model is quick in calculating any number of option prices. But the model cannot accurately calculate American options, since it only considers the price at an option's expiration date. American options are those that the owner may exercise at any time up to and including the expiration day.
What are Binomial Trees in options pricing?
A useful and very popular technique for pricing an option involves constructing a binomial tree. This is a diagram representing different possible paths that might be followed by the stock price over the life of an option. The underlying assumption is that the stock price follows a random walk. In each time step, it has a certain probability of moving up by a certain percentage amount and a certain probability of moving down by a certain percentage amount. In the limit, as the time step becomes smaller, this model is the same as the Black–Scholes–Merton model.
What is the Binomial options pricing model ?
This model uses a tree diagram with volatility factored in at each level to show all possible paths an option's price can take, then works backward to determine one price. The benefit of the Binomial Model is that you can revisit it at any point for the possibility of early exercise. Early exercise is executing the contract's actions at its strike price before the contract's expiration. Early exercise only happens in American-style options. However, the calculations involved in this model take a long time to determine, so this model isn't the best in rushed situations.
What is the Cox-Ross-Rubinstein Model?
The Cox-Ross-Rubinstein binomial model can be used to price European and American options on stocks without dividends, stocks and stock indexes paying a continuous dividend yield, futures, and currency options. Option pricing is done by working backwards, starting at the terminal date. Here we know all the possible values of the underlying price. For each of these, we calculate the payoffs from the derivative, and find what the set of possible derivative prices is one period before. Given these, we can find the option one period before this again, and so on. Working ones way down to the root of the tree, the option price is found as the derivative price in the first node.
Inputs
Spot price: select from 33 different types of price inputs
Calculation Steps: how many iterations to be used in the Binomial model. In practice, this number would be anywhere from 5000 to 15000, for our purposes here, this is limited to 300
Strike Price: the strike price of the option you're wishing to model
% Implied Volatility: here you can manually enter implied volatility
Historical Volatility Period: the input period for historical volatility; historical volatility isn't used in the CRRBT process, this is to serve as a sort of benchmark for the implied volatility,
Historical Volatility Type: choose from various types of implied volatility, search my indicators for details on each of these
Option Base Currency: this is to calculate the risk-free rate, this is used if you wish to automatically calculate the risk-free rate instead of using the manual input. this uses the 10 year bold yield of the corresponding country
% Manual Risk-free Rate: here you can manually enter the risk-free rate
Use manual input for Risk-free Rate? : choose manual or automatic for risk-free rate
% Manual Yearly Dividend Yield: here you can manually enter the yearly dividend yield
Adjust for Dividends?: choose if you even want to use use dividends
Automatically Calculate Yearly Dividend Yield? choose if you want to use automatic vs manual dividend yield calculation
Time Now Type: choose how you want to calculate time right now, see the tool tip
Days in Year: choose how many days in the year, 365 for all days, 252 for trading days, etc
Hours Per Day: how many hours per day? 24, 8 working hours, or 6.5 trading hours
Expiry date settings: here you can specify the exact time the option expires
Take notes:
Futures don't risk free yields. If you are pricing options of futures, then the risk-free rate is zero.
Dividend yields are calculated using TradingView's internal dividend values
This indicator only works on the daily timeframe
Included
Option pricing panel
Loxx's Expanded Source Types
SPY Option returns calculations This script allows you to calculate returns on double butterfly options, specifically for 0 DTE and 1 DTE(days to expiration) for options that have expiration on Monday, Tuesday and Friday(Mostly SPY). The script is bi-directional, meaning it will calculate the returns on a put and call butterfly simultaneously, not just a put or just a call butterfly. The script was developed to calculate how much return could be made on opening a double butterfly option by opening a position right at the open of the day on a 0 DTE option. The script rounds the price up or down to the nearest strike price at open. From there you would need to chose how far to select your options from the opening strike price. You would also need to select how many contracts you would like to open, negative - is selling an option positive + is buying an option. As an example the script is defaulted to a 0,2,4 strike position with buying 1 contract at the 0, selling 3 contracts at the +/- 2 strike and selling 2 contracts at the +/- strike. The default is set to an unbalanced double butterfly as it allows a better credit collection than a standard butterfly. To change to a standard butterfly change the # of contracts to 1 -2 and 1 respectively.
The script defaults a return of 0 on Tuesdays and Thursdays as there are no 0 DTE options available on those days.
If you have questions about script ask ... if you have questions about options ... the answers will likely take too much time to answer.

Options Theoritcal PriceThis script is useful as a quick glance for checking the theoritcal price of the Call and Put option strike.
Spot price is automatically derived from live market.
Enter the strike price and IV value.
For NSE stocks, use 6% as risk free rate if not sure.

Weekly Put SaleWeekly Put Sale
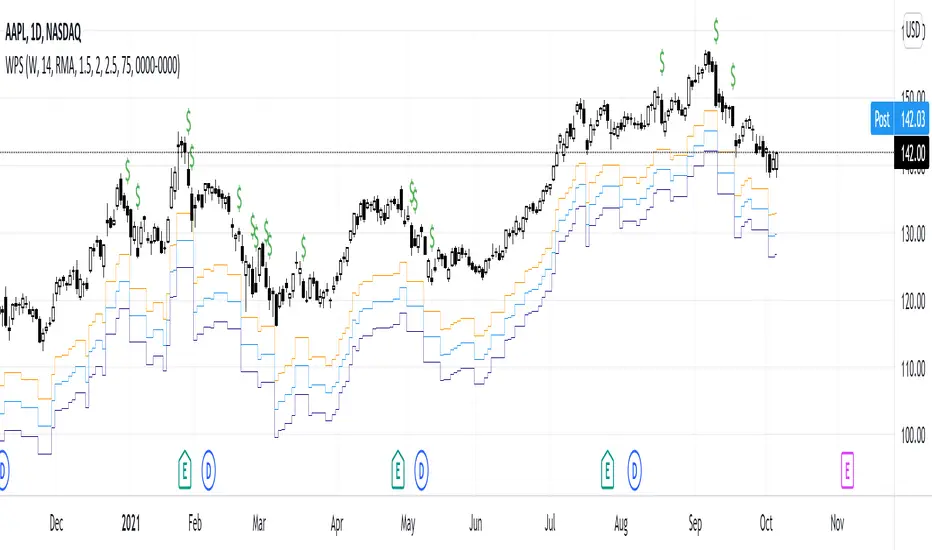
This study is a tool I use for selling weekly puts at the suggested strike prices.
1. The suggested strike prices are based on the weekly high minus an ATR multiple which can be adjusted in the settings
2. You can also adjust the settings to Monthly strike prices if you prefer selling options further out
3. I suggest looking for Put sale premium that is between 0.25% to 0.75% of the strike price for weekly Puts and 1% to 3% of the strike price for monthly Puts
Disclaimers: Selling Puts is an advanced strategy that is risky if you are not prepared to acquire the stock at the strike price you sell at on the expiration date. You must make your own decisions as you will bear the risks associated with any trades you place. To sum it up, trading is risky, and do so at your own risk.
strangle_pricerUsage:
1. Set the put and call strike inputs to values of your choosing.
2. Select "days to expiration".
3. Set the put and call standard deviations using the output table.
The indicator is meant help price a strangle using historical data and a volatility model. By default, the model is an ewma-method historical volatility. After selecting strikes and standard their corresponding standard deviation, theoretical values and probabilities will be shown in the table. The script is initialized with -1 for several inputs, and won't show any data until these are adjusted.
The theoretical values shown assume a strangle was bought or sold on every historical bar, and averaging their value at expiration.
For example, if you choose the $50 call and $40 put when the underlying is at $45 and there are 30 days until expiration, suppose the volatility is N and
these strikes correspond to M standard deviations. Input those and the resulting theoretial values shown will be based on opening a 30 dte call and put at M standard deviations with respect to the volatility at each bar.
- Past volatility forecasts are plotted in blue, and hidden by default.
- The current volatility forecast is drawn as a blue line.
- The put and call strikes are drawn as red lines.
This indicator is only meant for the daily chart!
Since I won't be able to edit this description later, also check the release notes and script comments for important changes.

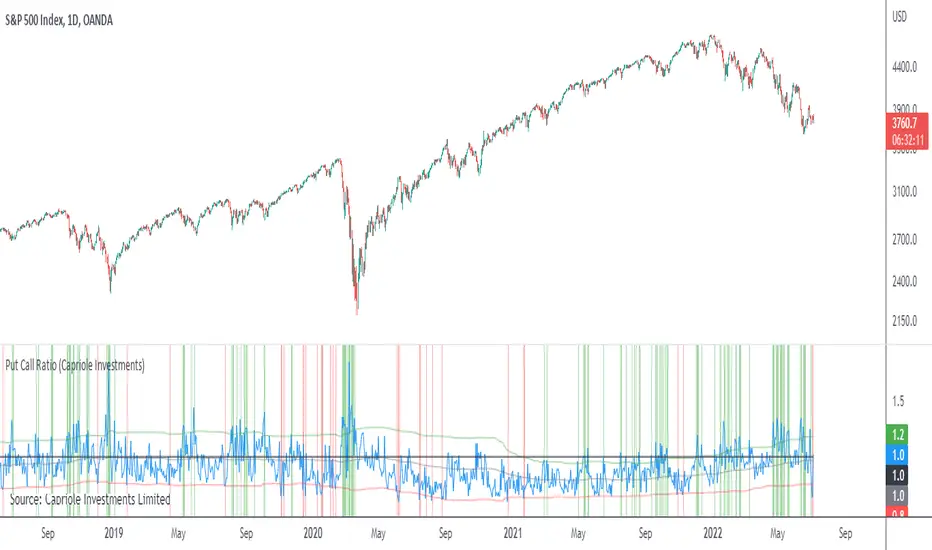
Put Call RatioPlots the CBOE Put Call Ratio and marks up locations of extremities.
Useful as a factor of confluence in identifying extremities in the market.
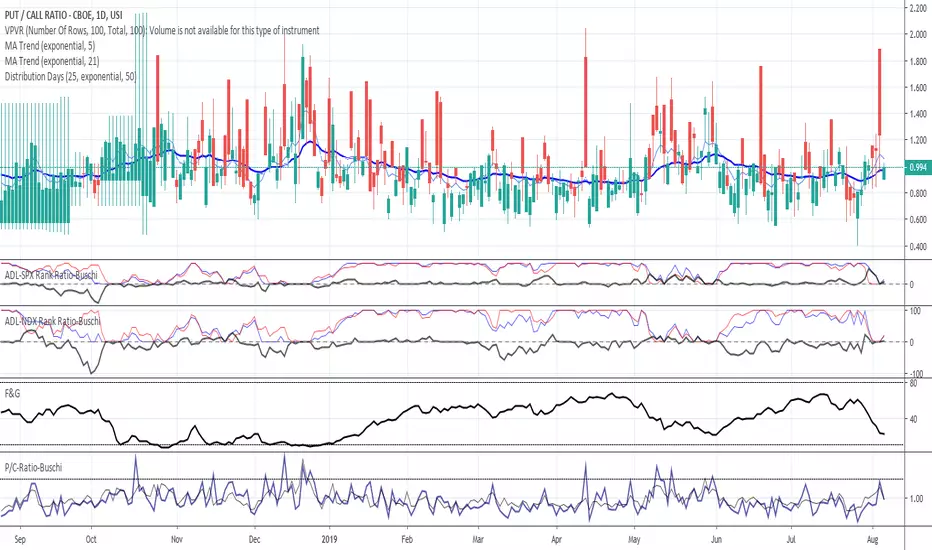
Put/Call-Ratio-Buschi
English:
This script shows the Put/Call-Ratio as seen on the Cboe-Website: www.cboe.com
A higher Put/Call-Ratio means a higher trading volume of puts compared to calls, which is a sign of a higher need for protection in the market.
For best reflection of the Cboe's data, which is shown in 30 minutes intervals, a 30 min-chart is recommended.
30 min-data as well as end-of-day data are shown.
Deutsch:
Dieses Skript zeigt das Put/Call Ratio, wie es auf der Cboe-Website angegeben ist: www.cboe.com
Ein höheres Put/Call Ratio bedeutet ein höheres Handelsvolumen von Puts gegenüber Calls, was ein Zeichen für Absicherungsbedarf im Markt darstellt.
Um die Cboe-Daten bestmöglich wiederzugeben, die in 30 Minuten-Intervallen herausgegeben werden, wird ein 30 min-Chart empfohlen.
Es werden sowohl die 30-Minuten-Daten als auch die Tagesenddaten angezeigt.