Rainbow OscillatorRainbow Oscillator script.
This indicator was developed and described by Dr. Mel Widner (Stocks & Commodities V.15:7: Rainbow Charts).
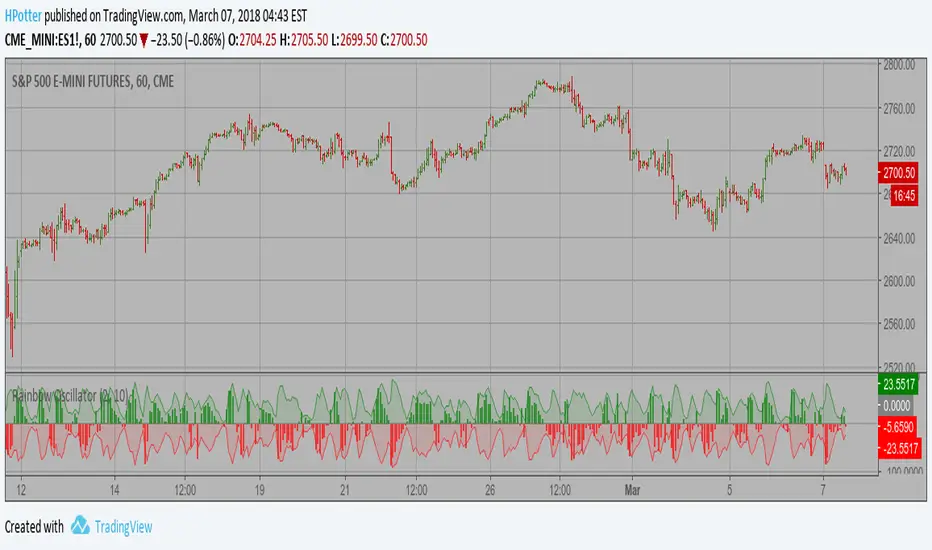
Rainbow
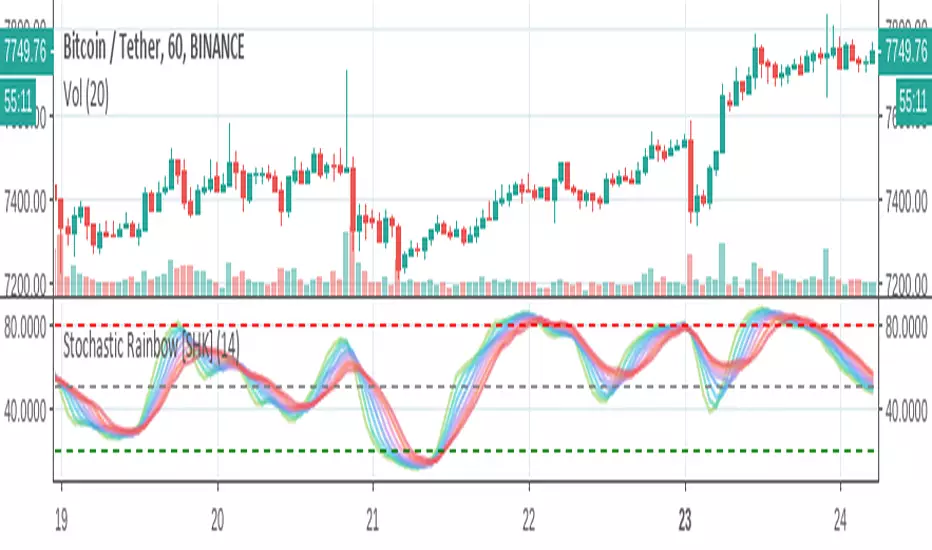
Stochastic Rainbow [SHK]Stochastic Rainbow consists of 8 stochastic oscillators with different speeds. So It has lower noises and better visualization comparing to simple stochastic.
I welcome comments, suggestions.
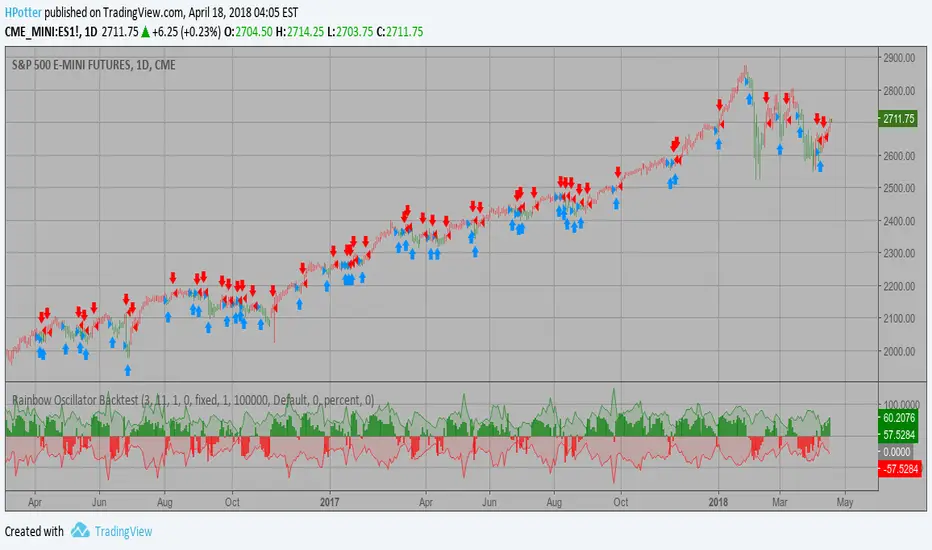
Rainbow Oscillator Backtest Ever since the people concluded that stock market price movements are not
random or chaotic, but follow specific trends that can be forecasted, they
tried to develop different tools or procedures that could help them identify
those trends. And one of those financial indicators is the Rainbow Oscillator
Indicator. The Rainbow Oscillator Indicator is relatively new, originally
introduced in 1997, and it is used to forecast the changes of trend direction.
As market prices go up and down, the oscillator appears as a direction of the
trend, but also as the safety of the market and the depth of that trend. As
the rainbow grows in width, the current trend gives signs of continuity, and
if the value of the oscillator goes beyond 80, the market becomes more and more
unstable, being prone to a sudden reversal. When prices move towards the rainbow
and the oscillator becomes more and more flat, the market tends to remain more
stable and the bandwidth decreases. Still, if the oscillator value goes below 20,
the market is again, prone to sudden reversals. The safest bandwidth value where
the market is stable is between 20 and 80, in the Rainbow Oscillator indicator value.
The depth a certain price has on a chart and into the rainbow can be used to judge
the strength of the move.
You can change long to short in the Input Settings
WARNING:
- For purpose educate only
- This script to change bars colors.
Rainbow Oscillator Strategy Ever since the people concluded that stock market price movements are not
random or chaotic, but follow specific trends that can be forecasted, they
tried to develop different tools or procedures that could help them identify
those trends. And one of those financial indicators is the Rainbow Oscillator
Indicator. The Rainbow Oscillator Indicator is relatively new, originally
introduced in 1997, and it is used to forecast the changes of trend direction.
As market prices go up and down, the oscillator appears as a direction of the
trend, but also as the safety of the market and the depth of that trend. As
the rainbow grows in width, the current trend gives signs of continuity, and
if the value of the oscillator goes beyond 80, the market becomes more and more
unstable, being prone to a sudden reversal. When prices move towards the rainbow
and the oscillator becomes more and more flat, the market tends to remain more
stable and the bandwidth decreases. Still, if the oscillator value goes below 20,
the market is again, prone to sudden reversals. The safest bandwidth value where
the market is stable is between 20 and 80, in the Rainbow Oscillator indicator value.
The depth a certain price has on a chart and into the rainbow can be used to judge
the strength of the move.
WARNING:
- This script to change bars colors.

Rainbow Oscillator Ever since the people concluded that stock market price movements are not
random or chaotic, but follow specific trends that can be forecasted, they
tried to develop different tools or procedures that could help them identify
those trends. And one of those financial indicators is the Rainbow Oscillator
Indicator. The Rainbow Oscillator Indicator is relatively new, originally
introduced in 1997, and it is used to forecast the changes of trend direction.
As market prices go up and down, the oscillator appears as a direction of the
trend, but also as the safety of the market and the depth of that trend. As
the rainbow grows in width, the current trend gives signs of continuity, and
if the value of the oscillator goes beyond 80, the market becomes more and more
unstable, being prone to a sudden reversal. When prices move towards the rainbow
and the oscillator becomes more and more flat, the market tends to remain more
stable and the bandwidth decreases. Still, if the oscillator value goes below 20,
the market is again, prone to sudden reversals. The safest bandwidth value where
the market is stable is between 20 and 80, in the Rainbow Oscillator indicator value.
The depth a certain price has on a chart and into the rainbow can be used to judge
the strength of the move.
Rainbow StrategyThe strategy is based on the following idea:
www.youtube.com
Not a fan of this but no script was present to show this idea's performance.
Best suitable for the 1-minute chart. You can change the ema values as per your needs.
For Tips to continue :) -
BTC: 1BjswGcRR6c23pka7qh5t5k56j46cuyyy2
ETH: 0x64fed71c9d6c931639c7ba4671aeb6b05e6b3781
LTC: LKT2ykQ8QSzzfTDB6Tnsf12xwYPjgq95h4

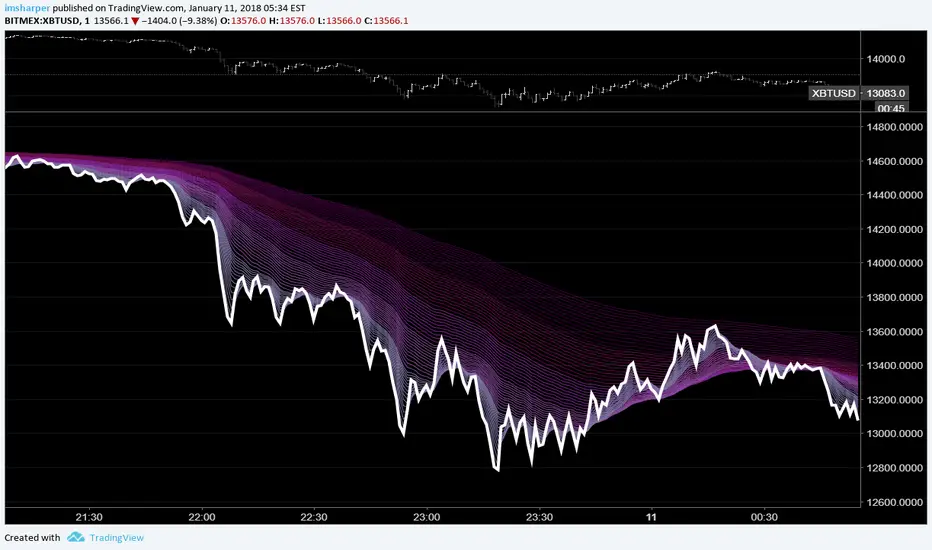
Rainbow MA StudyI've been interested in 'Multiple Moving Averages' lately and came across another script on here for a Rainbow MA.
Unfortunately its source is private and I wanted to try things out with other MA types so I put this together.
I also wanted to make it a seperate study so I could view regular bars without the clutter.
The general rule of thumb with these is the larger the price movement the wider the lines become giving you sort of a wave effect.
When the lines bunch up together you know there's going to be a breakout opportunity that will present itself.
Partly art, partly practical, entirely overkill. Enjoy!
The anchor multiplier should basically allow you to view things in relation to another time period, but it takes forever to load and will likely time out.
Since there are 63 MA's being calculated and plotted changing options on the fly takes some time to process and load.
I'm also pretty new to pine script so it's probably not the best implementation.
MA types: EMA (default), SMA, WMA, VWMA, SMMA, DEMA, TEMA, HullMA, ZEMA, TMA, SSMA
Play around with these to see some different effects.
The white line is the current close price.
Color 1 МАs: 2,3, 4, 5, 6, 7, 8, 9, 10, 11, 12, 13, 14, 15
Color 2 MAs: 17, 19, 21, 23, 25, 27, 29, 31, 33, 35, 37, 39, 41
Color 3 MAs: 44, 47, 50, 53, 56, 59, 62, 65, 68, 71, 74
Color 4 MAs: 78, 82, 86, 90, 94, 98, 102, 106, 110, 114, 118, 122
Color 5 MAs: 126, 131, 137, 143, 149, 155, 155, 161, 167, 173, 179, 185, 191, 197
You can more easily change the colors at the top of this source code instead of one by one in the settings.
If you want this on your main chart instead of a separate window you'll just need to change overlay=true in the study.
References & Thanks:
JustUncleL:
For the timeframe anchor, MA variants, and generally awesome work. This is more practical.
StickyCheeba:
For the idea.
Here's some shots to get an idea of the differences.
HullMA:
VWMA:
SSMA:
TMA: