TrendCylinder (Expo)█ Overview
The TrendCylinder is a dynamic trading indicator designed to capture trends and volatility in an asset's price. It provides a visualization of the current trend direction and upper and lower bands that adapt to volatility changes. By using this indicator, traders can identify potential breakouts or support and resistance levels. While also gauging the volatility to generate trading ranges. The indicator is a comprehensive tool for traders navigating various market conditions by providing a sophisticated blend of trend-following and volatility-based metrics.
█ How It Works
Trend Line: The trend line is constructed using the closing prices with the influence of volatility metrics. The trend line reacts to sudden price changes based on the trend factor and step settings.
Upper & Lower Bands: These bands are not static; they are dynamically adjusted with the calculated standard deviation and Average True Range (ATR) metrics to offer a more flexible, real-world representation of potential price movements, offering an idea of the market's likely trading range.
█ How to Use
Identifying Trends
The trend line can be used to identify the current market trend. If the price is above the trend line, it indicates a bullish trend. Conversely, if the price is below the trend line, it indicates a bearish trend.
Dynamic Support and Resistance
The upper and lower bands (including the trend line) dynamically change with market volatility, acting as moving targets of support and resistance. This helps set up stop-loss or take-profit levels with a higher degree of accuracy.
Breakout vs. Reversion Strategies
Price movements beyond the bands could signify strong trends, making it ideal for breakout strategies.
Fakeouts
If the price touches one of the bands and reverses direction, it could be a fakeout. Traders may choose to trade against the breakout in such scenarios.
█ Settings
Volatility Period: Defines the look-back period for calculating volatility. Higher values adapt the bands more slowly, whereas lower values adapt them more quickly.
Trend Factor: Adjusts the sensitivity of the trend line. Higher values produce a smoother line, while lower values make it more reactive to price changes.
Trend Step: Controls the pace at which the trend line adjusts to sudden price movements. Higher values lead to a slower adjustment and a smoother line, while lower values result in quicker adjustments.
-----------------
Disclaimer
The information contained in my Scripts/Indicators/Ideas/Algos/Systems does not constitute financial advice or a solicitation to buy or sell any securities of any type. I will not accept liability for any loss or damage, including without limitation any loss of profit, which may arise directly or indirectly from the use of or reliance on such information.
All investments involve risk, and the past performance of a security, industry, sector, market, financial product, trading strategy, backtest, or individual's trading does not guarantee future results or returns. Investors are fully responsible for any investment decisions they make. Such decisions should be based solely on an evaluation of their financial circumstances, investment objectives, risk tolerance, and liquidity needs.
My Scripts/Indicators/Ideas/Algos/Systems are only for educational purposes!
Rangetrading

Custom Range Creator + Normalized Oscillators (Obv, Rsi, Mfi) Hello Traders!
Custom Range Creator is a specialized trading tool designed for traders who incorporate range analysis into their trading strategy.
Once you set the desired number of past candles or provide a manual input, the indicator will automatically draw a range for you. This unique feature allows you to customize the range based on the highest and lowest points within a specified number of bars, known as the "Dynamic Range." Furthermore, you have the flexibility to define up to three additional ranges manually using custom inputs. The lines and labels associated with these ranges can be fully customized in terms of style, color, and width to align with your personal preferences.
Dynamic Range Capabilities:
The indicator automatically generates a range by default, identifying the highest and lowest points within the last 200 bars. However, you have the ability to define the number of bars back by adjusting the setting in the menu. Moreover you can define the range based on either the wicks or the bodies of the candles.
The range includes the following components:
☀ Range High: The highest price point within the selected number of bars in the past
☀ Range Low: The lowest price point within the selected number of bars in the past
☀ Range Mid-Point: The calculated middle value between the Range High and Range Low
☀ First Quartile (Q1): The midpoint between the Range Low and the Range Mid-Point, effectively identifying the 25% level within the range
☀ Third Quartile (Q3): The midpoint between the Range Mid-Point and the Range High, identifying the 75% level within the range
By incorporating these critical levels within a price range, our Dynamic Range provides you with a comprehensive view of how the market evolves, enabling you to make more informed trading decisions.
Manual Ranges Capabilities:
In addition to the Dynamic Range, you can manually define up to three more ranges. By specifying your desired high and low price values as inputs, the system automatically draws the range based on your inputs. Once drawn, you can further adjust the range using the bar offset option, which allows you to shift the entire range backward or forward by a specified number of bars.
Each manually defined range includes the following components:
☀ Range High: Your user-defined highest price point
☀ Range Low: Your user-defined lowest price point
☀ Range Mid-Point: The calculated middle value between the Range High and Range Low
☀ First Quartile (Q1): The midpoint between the Range Low and the Range Mid-Point, identifying the 25% level within the range
☀ Third Quartile (Q3): The midpoint between the Range Mid-Point and the Range High, identifying the 75% level within the range
This allows you to precisely define your desired price range and visually represent it on the chart. The customizable manual ranges provide you with a powerful tool for analyzing price dynamics and identifying potential support and resistance levels.
Both Dynamic Range and Manual Ranges Capabilities:
a) Timeframe-Adaptive: This indicator dynamically adjusts to your selected timeframe. Whether you are a day trader or a long-term investor, this tool adapts to meet your needs.
b) Complete Customization: You have the flexibility to customize every aspect of "Custom Range Indicator". You can modify the color, style, and width of each of the five lines to seamlessly integrate them into your chart setup. Choose from various line styles, including solid, dashed, or dotted, and select colors that suit your visual preferences. Additionally, you can customize the color and text of the labels. Additionally, you can utilize the bar offset option to fine-tune the placement of the range within your analysis.
c) Hide Lines and Labels: You have the option to hide each line or label of the range individually, or hide the entire range with labels or without labels. This customization feature allows you to focus on specific aspects of the chart and declutter the visual representation of the ranges when needed.
Normalized Oscillators
Normalization is a process applied in data handling and statistics, and in the context of trading indicators, it can be incredibly useful. Trading indicators such as Volume, the Relative Strength Index (RSI), the Money Flow Index (MFI), and On Balance Volume (OBV), often vary in their range and scale.
Normalization adjusts these values to fit within a specific range, making different indicators directly comparable and aiding in the interpretation of their relationship and impact on price action. This can offer additional insights for traders, making it easier to identify trends, patterns, and potential trading signals across different indicators.
This indicator offers a selection of three oscillators to normalize and Volume Data:
☀Volume: The amount of a particular asset that is traded within a particular period.
☀Relative Strength Index (RSI): A momentum oscillator that measures the speed and change of price movements. It is typically used to identify overbought or oversold conditions in a market.
☀Money Flow Index (MFI): A momentum indicator that uses price and volume data to identify overbought or oversold signals in an asset.
☀On Balance Volume (OBV): A technical trading momentum indicator that uses volume flow to predict changes in price. It does this by cumulatively adding volume on days when the price increases, and subtracting volume on days when the price decreases.
This script also offers aesthetic customizations for the plot, which can enhance readability and visual appeal:
✔"Plot Color": This input lets users select the color of the plotted line on the chart, allowing for personalization and better visual differentiation when multiple indicators are used.
✔"Plot Width": Users can also adjust the thickness of the plotted line, enhancing visibility based on individual preference or screen resolution.
Why is useful the Normalization?
Normalization plays a crucial role in trading as it helps bring together diverse sets of information to support more informed decision-making. For instance, observing the correlation between the price chart and oscillators like On Balance Volume (OBV) near range levels can provide valuable insights.
Consider this example using a daily (1D) Ethereum (ETH) chart:
We observe that the price is at a Range Quarter, making a higher high while the OBV makes a higher low. This scenario presents a significant degree of confluence. The price is at a critical range level and there is a bearish divergence between the OBV and the price. Such confluence often indicates a potential shift in market dynamics, and as observed, the price trends lower subsequently.
Below is the same scenario represented on a linear chart, providing a clearer visualization:
Normalization enables us to make these comparisons more accurately, ultimately leading to more reliable trading signals and better trading outcomes. By adjusting the scale of various indicators to a standard range, traders can directly compare and correlate them to price action, making it easier to spot trends, divergences, and other key market patterns.
Keep attention!
It is important to note that no trading indicator or strategy is foolproof, and there is always a risk of losses in trading. While this indicator may provide useful information for making conclusions, it should not be used as the sole basis for making trading decisions. Traders should always use proper risk management techniques and consider multiple factors when making trading decisions.

Predictive Ranges [LuxAlgo]The Predictive Ranges indicator aims to efficiently predict future trading ranges in real-time, providing multiple effective support & resistance levels as well as indications of the current trend direction.
Predictive Ranges was a premium feature originally released by LuxAlgo in 2020.
The feature was discontinued & made legacy, however, due to its popularity and reproduction attempts, we deemed it necessary to release it open source to the community.
🔶 USAGE
The primary purpose of this indicator is to provide potential support & resistance levels on the chart by estimating future trading ranges.
When the price reaches one of the upper/lower levels of the Predictive Ranges we can expect the price to reverse.
If the price exits the predicted range, new levels are given in real-time & they do not repaint. Higher "Factor" values allow returning longer term and wider ranges less susceptible to be exited.
🔹 Estimating Trend Directions
Users are able to easily estimate trend directions by looking at the central levels of the predictive ranges, which represent an estimate of the price central tendency.
If this central level increases it means the price is up-trending, if it is decreasing price is down-trending.
🔶 SETTINGS
Length: ATR Length used for the indicator calculation. Higher values will tend to return ranges of equal width.
Factor: Control the ranges width. Higher values will return less frequent ranges, each having a higher width.
Timeframe: Indicator timeframe output.
Source: Input source of the indicator. It is recommended to use input sources on the same scale as the price.

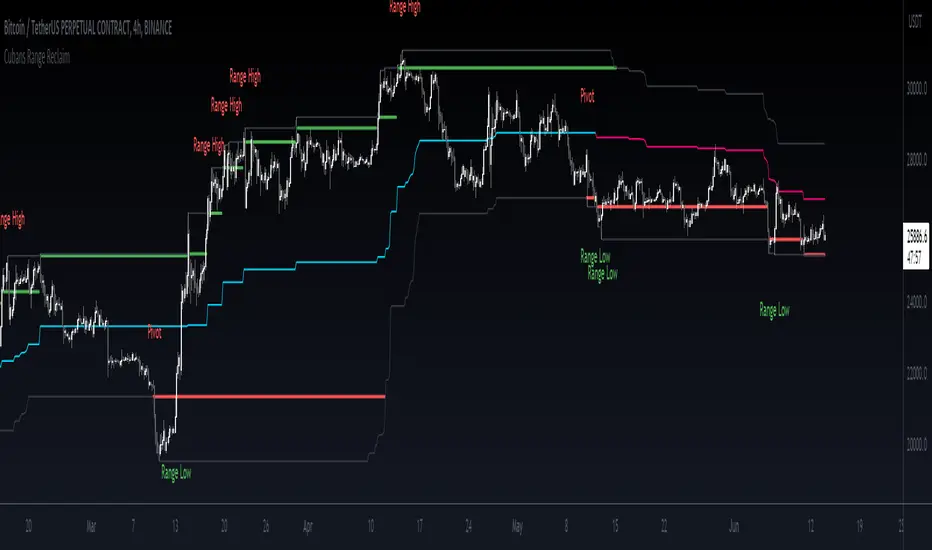
Cuban's Range Reclaim [CE]Cuban's Range Reclaim is an indicator that minimizes the time that traders need to spend manually adjusting the range extremes and identifying range deviations.
By tracking the previous levels of the range, the indicator then signals to the trader when price trades back below that level, and assigns a 'Range High' or 'Range Low' print to the deviation. When there is a potential break in the trend, the indicator also prints a 'Pivot' label.
Among other features, the indicator tracks the midline of the range excluding the deviations, giving a far more accurate trend line with less signal noise than regular donchian channels.
There is also the option to view dynamic supply and demand within the channel, plus midlines for the supply and demand, and for a regular channel.
Within the user inputs, the indicator also allows the user to adjust the following:
Source input for range level confirmations
Period for range lookback
Supply and demand sensitivity
TO DO:
Allow for color changes within the Style menu
Monday_Weekly_Range/ErkOzi/Deviation Level/V1"Hello, first of all, I believe that the most important levels to look at are the weekly Fibonacci levels. I have planned an indicator that automatically calculates this. It models a range based on the weekly opening, high, and low prices, which is well-detailed and clear in my scans. I hope it will be beneficial for everyone.
***The logic of the Monday_Weekly_Range indicator is to analyze the weekly price movement based on the trading range formed on Mondays. Here are the detailed logic, calculation, strategy, and components of the indicator:
***Calculation of Monday Range:
The indicator calculates the highest (mondayHigh) and lowest (mondayLow) price levels formed on Mondays.
If the current bar corresponds to Monday, the values of the Monday range are updated. Otherwise, the values are assigned as "na" (undefined).
***Calculation of Monday Range Midpoint:
The midpoint of the Monday range (mondayMidRange) is calculated using the highest and lowest price levels of the Monday range.
***Fibonacci Levels:
// Calculate Fibonacci levels
fib272 = nextMondayHigh + 0.272 * (nextMondayHigh - nextMondayLow)
fib414 = nextMondayHigh + 0.414 * (nextMondayHigh - nextMondayLow)
fib500 = nextMondayHigh + 0.5 * (nextMondayHigh - nextMondayLow)
fib618 = nextMondayHigh + 0.618 * (nextMondayHigh - nextMondayLow)
fibNegative272 = nextMondayLow - 0.272 * (nextMondayHigh - nextMondayLow)
fibNegative414 = nextMondayLow - 0.414 * (nextMondayHigh - nextMondayLow)
fibNegative500 = nextMondayLow - 0.5 * (nextMondayHigh - nextMondayLow)
fibNegative618 = nextMondayLow - 0.618 * (nextMondayHigh - nextMondayLow)
fibNegative1 = nextMondayLow - 1 * (nextMondayHigh - nextMondayLow)
fib2 = nextMondayHigh + 1 * (nextMondayHigh - nextMondayLow)
***Fibonacci levels are calculated using the highest and lowest price levels of the Monday range.
Common Fibonacci ratios such as 0.272, 0.414, 0.50, and 0.618 represent deviation levels of the Monday range.
Additionally, the levels are completed with -1 and +1 to determine at which level the price is within the weekly swing.
***Visualization on the Chart:
The Monday range, midpoint, Fibonacci levels, and other components are displayed on the chart using appropriate shapes and colors.
The indicator provides a visual representation of the Monday range and Fibonacci levels using lines, circles, and other graphical elements.
***Strategy and Usage:
The Monday range represents the starting point of the weekly price movement. This range plays an important role in determining weekly support and resistance levels.
Fibonacci levels are used to identify potential reaction zones and trend reversals. These levels indicate where the price may encounter support or resistance.
You can use the indicator in conjunction with other technical analysis tools and indicators to conduct a more comprehensive analysis. For example, combining it with trendlines, moving averages, or oscillators can enhance the accuracy.
When making investment decisions, it is important to combine the information provided by the indicator with other analysis methods and use risk management strategies.
Thank you in advance for your likes, follows, and comments. If you have any questions, feel free to ask."

Trend Finder++ (by Alex L.)This indicator seeks for a short term trend within a bigger long term trend and displays both in a channel with an extension lines (optional).
Use of this indicator is quite simple: when the stock is near the trend line bottom (default RED) it can be a good time to buy and when the stock is near the trend line top (default GREEN) it can be a good time to sell.
What new ideas and cool stuff this indicator offers:
- 'Trend (Months)' -
Trend channels will always be displayed over the period: last 'X' months (regardless of the 'Time Interval' set in your chart)
This allows you to go into a larger or smaller resolution and still see the same trend lines!
- ' Trend (Bars)' -
Optional. You can choose to display the Trend channel based on bars instead of months.
This can be useful for advanced traders, or in case a security is new and there isn't even 1 month of data.
- 'Show long-term trend' -
Optional. Displays a larger 3rd (even more long-term) trend in addition to the two current trends.
This is for advanced traders who want to see an even more bigger picture. It is best viewed on a weekly time interval.
- Customizable channel size, channel colors and channel style.
- 'Extend lines' -
Optional (default: yes). Trend channels' can be displayed with extension or without using this option.
- Internal Feature -
When trend channel goes below zero (can happen if stock's price falls sharply) - its below-zero portion will be drawn as 'extension' instead.
This is useful if such occurs, and we're in an auto-scaled chart - the lines will take less space on screen (for cleaner view).
Based on an idea/indicator by @ DevLucem called "Linear Regression ++"
Open Source.
Enjoy!

EMAflowPRO -Ranges-DISCLAIMER: Always, please keep in mind that market conditions change, past results cannot guarantee the same results in the future.
EMAflowPRO - Ranges-
EMAflowPRO ranges indicator will detect key movements in the market that fit certain conditions and based on that create key tradable zones by providing dynamic and static range levels.
Before reading further please take a look at the indicator values names on the right in the main chart above - these names are linked to the content below when we talk about range structure. The examples included in charts are linked to the area we're discussing (if something was said - most likely closest chart demonstrates it - Also arrows present entries; can be limit or can be market buy/sell in to the wicks.)
Let's find out what indicator does...
Static range logic:
Indicator uses combination of market timing indicators (counting relationship between candles) , fisher transform, stoch rsi, bollinger bands to detect important market price action that show strenght - based on that it will project a static range where key goal is to predict where market will be extremely oversold, extremely overbought or where market could change bias etc.
The setups it provides are very similar to those that come out of harmonic patterns - but it was developed with unique approach without knowing what harmonic patterns are.. so it's not completly the same.
Range is represented by 3 tradable areas (actual trade ideas on charts - arrow points towards a level - on the right there is a scale with a number- limit order can be placed there )
Top of the range - It serves as a shorting area or if top is converted to support can also signal a potential breakout or start of new trend.
Example of a short the top of the range:
29732 - is area where wicks can be sold in to , or limit sell is placed - with higher leverage sl should be tight, with lower sell orders can be spread out up to the middle with sl just above 30500, targets can be choosen based on the provious range top as % moves point.
Example of longing the levels on the recent rise - price staying above middle of the top of the range keeps bias on the upside and potentially signals a break out or start of new trend
Uppper, Middle, Lower part of the range: Sideway area - middle of the range decides direction , above favors the upper levels , below favors the lower levels.
Very nice example where white line is middle of the range and shows that even in strong trend - range projection is able to accurately predict key pullback areas that provide substantial gain. See image below - again settign limit orders where middle of the range is allows you to get a comfortable entry with very big risk reward ratio.
Bottom of the range - market is extremely oversold
Spx example of our recent range from last year's summer - again chart includes both EMAflow indicator and EMAflow ranges as all indicators are extremely complementary and present two sides of the medal sideway and trend view.
Chart only contains ranges but shows the same pair and time:
If price goes below middle of the bottom of the range it could signal a break down or start of new bearish trend.
Dynamic range logic
Since sometimes static range gets broken out or is not respected and the price action is not yet sufficient to generated a new one we included a dynamic supply demand part where dynamic range is generated working in a similar way but does add clarity when static range fails.
example of this can be seen when ftx caused a btc dump we broke through the bottom of the range but dynamic range later showed us new bottom we could trade.
Confluence between both can also provide even more sure levels to place limit orders or to market buy or sell when wicks in to that area occurs.
Minuses:
Since ranges tend to work best when market is sideway - a second part is recommended with EMAflowPRO where focus on moving averages helps you navigate stronger trends.
Not all tfs are well synced with ranges on various assets so you will need to flip through few ones to find the best timeframes that historically worked the best - if you come across an asset that doens't look good you should just change timeframe to higher until you see something that fits or change asset until you get something that looks clear.
Settings:
EMAflow - Ranges - allows you to preset minimum potential of a trade setup you want to look for - default is 6% that ensures you can get a good setup on lower and higher tfs.

Risk-Adjusted Return OscillatorThe Risk-Adjusted Return Oscillator (RAR) is designed to aid traders in predicting future price action by analysing the risk-adjusted performance of an asset. This oscillator is displayed directly on the price chart, unlike other oscillators.
By considering the risk-return relationship, the indicator helps identify periods of overvaluation or undervaluation, allowing traders to anticipate potential price reversals or trend accelerations.
HOW TO USE
The Risk-Adjusted Return Oscillator analyses the risk-adjusted performance of an asset to detect price reversals and accelerations. Here's how to interpret its signals:
Ranging Market:
Overbought Signal: When the RAR curve reaches the overbought level (upper red line), it suggests a potential reversal signal. It indicates that the asset may be overvalued, and a price correction or trend reversal could occur.
Oversold Signal: When the RAR curve reaches the oversold level (lower red line), it indicates a potential reversal signal. It suggests that the asset may be undervalued, and a price correction or trend reversal could take place.
Trending Market:
Overbought Signal: In a trending market, an overbought signal (RAR curve reaching upper red line) suggests trend acceleration. It indicates that the existing trend is gaining strength, and buying pressure is increasing.
Oversold Signal: In a trending market, an oversold signal (RAR curve reaching lower red line) also signifies trend acceleration. It suggests that the prevailing trend is intensifying, and selling pressure is increasing.
Thus, it's important to consider the market context when interpreting overbought and oversold signals. In ranging markets, these signals act as potential reversal points. However, in trending markets, they indicate trend acceleration, reinforcing the current price direction.
SETTINGS
Period Length: Adjust the number of bars used to calculate returns and standard deviation.
Smoothing: Define the smoothing period for the RAR curve.
Show Overbought/Oversold Signals: Choose whether to display triangular shapes for overbought and oversold conditions.

Range BreakerStrategy Description: Range Breaker
The Range Breaker strategy is a breakout trading strategy that aims to capture profits when the price of a financial instrument moves out of a defined range. The strategy identifies swing highs and swing lows over a specified lookback period and enters long or short positions when the price breaks above the swing high or below the swing low, respectively. It also employs stop targets based on a percentage to manage risk and protect profits.
Beginner's Guide:
Understand the concepts:
a. Swing High: A swing high is a local peak in price where the price is higher than the surrounding prices.
b. Swing Low: A swing low is a local trough in price where the price is lower than the surrounding prices.
c. Lookback Period: The number of bars or periods the strategy analyzes to determine swing highs and swing lows.
d. Stop Target: A predetermined price level at which the strategy will exit the position to manage risk and protect profits.
Configure the strategy:
a. Set the initial capital, order size, commission, and pyramiding as needed for your specific trading account.
b. Choose the desired lookback period to identify the swing highs and lows.
c. Set the stop target multiplier and stop target percentage as desired to manage risk and protect profits.
Backtest the strategy:
a. Set the backtest start date to analyze the strategy's historical performance.
b. Observe the backtesting results to evaluate the strategy's effectiveness and adjust the parameters if necessary.
Implement the strategy:
a. Apply the strategy to your preferred financial instrument on the TradingView platform.
b. Monitor the strategy's performance and adjust the parameters as needed to optimize its effectiveness.
Risk management:
a. Always use a stop target to protect your trading capital and manage risk.
b. Don't risk more than a small percentage of your trading capital on a single trade.
c. Be prepared to adjust the strategy or stop trading it if the market conditions change significantly.
Adjusting the Lookback Period and Timeframes for Optimal Strategy Performance
The Range Breaker strategy uses a lookback period to identify swing highs and lows, which serve as the basis for determining entry and exit points for long and short positions. By adjusting the lookback period and analyzing different timeframes, you can potentially find the best strategy configuration for each specific asset.
Adjusting the lookback period:
The lookback period is a critical parameter that affects the sensitivity of the strategy to price movements. A shorter lookback period will make the strategy more sensitive to smaller price fluctuations, resulting in more frequent trading signals. On the other hand, a longer lookback period will make the strategy less sensitive, generating fewer signals but potentially capturing larger price movements.
To optimize the lookback period for a specific asset, you can test different lookback values and compare their performance in terms of risk-adjusted returns, win rate, and other relevant metrics. Keep in mind that using an overly short lookback period may lead to overtrading and increased transaction costs, while an overly long lookback period may cause the strategy to miss profitable trading opportunities.
Analyzing different timeframes:
Timeframes refer to the duration of each bar or candlestick on the chart. Shorter timeframes (e.g., 5-minute, 15-minute, or 30-minute) focus on intraday price movements, while longer timeframes (e.g., daily, weekly, or monthly) capture longer-term trends. The choice of timeframe affects the number of trading signals generated by the strategy and the length of time each position is held.
To find the best strategy for each asset, you can test the Range Breaker strategy on different timeframes and analyze its performance. Keep in mind that shorter timeframes may require more active monitoring and management due to the increased frequency of trading signals. Longer timeframes, on the other hand, may require more patience as positions are held for extended periods.
Finding the best strategy for each asset:
Every asset has unique price characteristics that may affect the performance of a trading strategy. To find the best strategy for each asset, you should:
a. Test various lookback periods and timeframes, observing the strategy's performance in terms of profitability, risk-adjusted returns, and win rate.
b. Consider the asset's historical price behavior, such as its volatility, liquidity, and trend-following or mean-reverting tendencies.
c. Evaluate the strategy's performance during different market conditions, such as bullish, bearish, or sideways markets, to ensure its robustness.
d. Keep in mind that each asset may require a unique set of strategy parameters for optimal performance, and there may be no one-size-fits-all solution.
By experimenting with different lookback periods and timeframes, you can fine-tune the Range Breaker strategy for each specific asset, potentially improving its overall performance and adaptability to changing market conditions. Always practice proper risk management and be prepared to make adjustments as needed.
Remember that trading strategies carry inherent risk, and past performance is not indicative of future results. Always practice proper risk management and consider your own risk tolerance before trading with real money.

The HoneyChai RSI by CoffeeShopCryptoHere is a fun new way to view the RSI. A new TradingView Indicator for you RSI enthusiasts. This is the Honey Chai RSI Indicator.
This indicator combines the RSI oscillator with additional features to enhance its functionality and visual study.
The purpose of this indicator is to provide a more comprehensive view of the RSI and aid in identifying trends, potential entry / exit points, and ranging conditions.
How it's Built.
The RSI:
The RSI is represented by its common line which you can turn on and off, as usual.
Japanese candlesticks:
In this indicator, are also Japanese candlesticks giving you their representation of the RSI. This provides a clearer visualization of the RSI movements across its Open, High, Low, and Close, unlike the OHLC of the Heiken Ashi candles in the Heiken Ashi Algo.
In addition to the RSI line and Japanese candles, there are two moving averages applied to the RSI value. For the purpose of keeping with my CoffeeShop theme, the High average line is the Honey Line and the Low average line is the Chai Line. The user can choose between Exponential Moving Average or Simple Moving average. These moving averages are calculated based on the high vs low values of the past RSI readings, with the high average acting as the leading line.
When the Honey line is above the Chai Line, it indicates an uptrend, whereas when the Honey Line is below the Chai Line, it suggests a downtrend.
If the price is moving up but the Honey line is still below the Chai line, you're technically still in a downtrend and you should trade this like a pullback.
Identifying Trends.
To identify short entries, you need to wait for the Japanese candles to open and close below the Honey line while the Honey line is below the Chai Line. Conversely, you wait for the Japanese candles to open and close above the Honey line while the Honey line is above the Chai Line. This confirmation helps in identifying potential reversal points.
Range Bound Market.
The indicator also incorporates a visual representation of a ranging area. The 60 and 40 levels of the RSI are visually differentiated to indicate this range. When the Japanese candles are opening and closing within this range and the RSI remains contained within these levels, it suggests that the price is likely in a ranging phase, and traders should wait for a breakout from this range before taking action.
In summary, this custom indicator provides a comprehensive view of the RSI oscillator by incorporating Japanese candlestick visuals, moving averages, and a visual representation of the ranging area. By analyzing these elements, traders can gain insights into trends, potential entry points, and ranging conditions in the market.
---------HOW TO TRADE-----------
LONGS AND SHORTS
An example on how to use this in a long trade is to wait for your moving averages to be high (yellow) over low (orange). For the purpose of the description in this indicator you're looking for the honey to be over the chai.
Even if the RSI and Japanese candles in the oscillator are falling, however the honey is above the Chai, you are still in an uptrend.
The positioning of the moving averages will always determine the direction of the overall price trend so in this position you're looking for long entries.
take a long position as an entry when the open and the close of the Japanese candle in the oscillator is above your honey line.
when you notice a bearish candle closing below the honey line in an uptrend position you can exit your trade.
Confluence for short trades would be just the opposite and using the moving averages in an upside down pattern. In other words the honey needs to be below the chai and your Japanese candle needs to be closing bearish however they open and the close of that candle needs to be below both of your moving averages. exit when you get a bullish candle closing in between the averages.
TRADING RANGES
Wait for your moving average to enter into the range bound 60/40 area as well as your Japanese candles to Wick above and below this area but not close above and below the area.
At this point you can mark off the high and the low of the range as it pertains to your price chart and start using your range trading strategy.

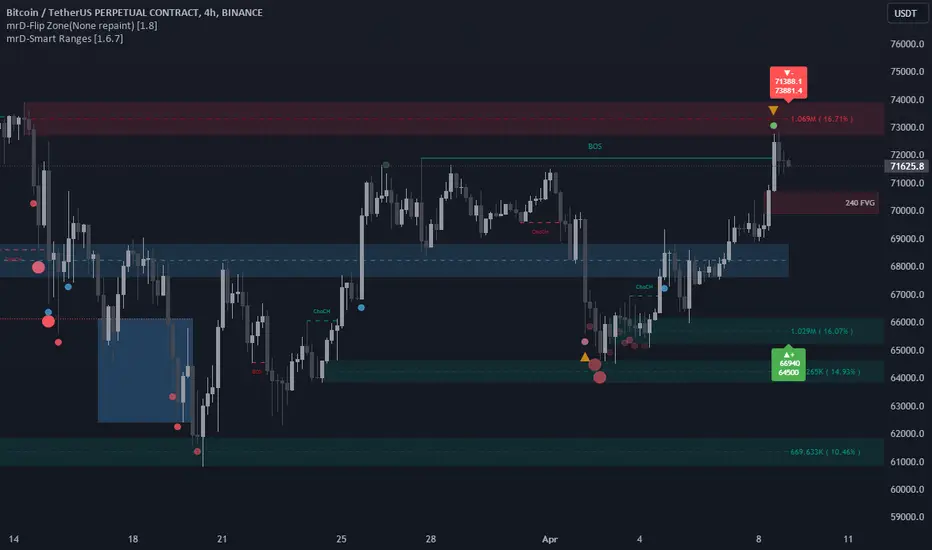
mrD-Smart RangesmrD-Smart Ranges aims to offer a complete strategy based on Order Blocks. Ranges signals based on order volume are highlighted, from which smart ranges are suggested to provide potential entries.
This script also includes warnings for each signal marked.
🔶 SETTINGS
Pair Strategy: Select the desired from the list. Change the chart to the one specified in the Strategy.
Current TF Order Blocks: Allows the user to select how many most recent Internal Order Blocks appear in the current time frame on the chart.
Order Block Filter: Allows the user to select how the script mitigates an Order Block.
Hide Overlap: Allows the user to display overlapping Order Blocks.
Show Metrics: Allows the user to display volume % metrics within the Order Blocks.
Show Volume Box: Allows the user to display buy/sell activity within Order Blocks.
High Timeframe: Allows the user to choose a higher or lower timeframe to find the Signals.
Show Failed Buy Sell: Allows the user to display the Signals.
Show HTF Box: Allows the user to display a higher or lower timeframe Order Blocks.
🔶 DETAILS
Order blocks are formed after a slight bearish order block, these can provide an opportunity to change polarity, thus acting as a potential support/resistance level.
A retest/retrace on the order block, combined with order volume between the current timeframe and from the higher timeframe will establish the conditions for smart ranges are suggested to provide potential entries.
🔶 USAGE
mrD-Smart Ranges aims to provide users with a minimalistic screen next to the optimal ranges to keep in mind to find trading setups as shown below.
Here we can see a suggested Sell range and display a label to confirm this range
Signal(s) that can be used for potential entries only during range retest are order blocks.
Users can search for more potential entry ranges based on larger timeframes in the settings: High Timeframe
In the image above, we can see that the price has generated potential orange and bearish entry signals. A confirmation signal with a red label is displayed on the chart when the price retests the Sell range.
Note: While range retests can still work well if they occur later in price action, it's best to look for signals only when price retests the range at the outset rather than retesting it. second price.
The logic of generating signal ranges using different rules is described below:
- Define order blocks in the current timeframe.
- Define the order blocks with the largest volume in the current timeframe.
- Define order blocks in larger timeframes in High Timeframe settings
- Define order blocks with the largest volume in larger timeframes in High Timeframe settings
Entry Range: The combination of the highest volume order blocks in the current timeframe and the highest volume order blocks in the larger timeframe.
🔶General disclaimer:
Trading stocks, futures, forex, options, ETFs, cryptocurrency, or any other financial instrument has huge potential rewards and risks.
You must be aware of the risks and willing to accept them to invest in stocks, futures, forex, options, ETFs, or cryptocurrencies.
Don't trade with money you can't afford to lose.
This is not an offer or an offer to Buy/Sell stocks, futures, Forex, options, ETFs, cryptocurrencies, or any other financial instrument.
Do not represent that any account will or is likely to achieve profit or loss of any kind.
The past performance of any trading system or method is not necessarily indicative of future results.
My Scripts/Indicators/Ideas/Algos/Systems are only for educational purposes!
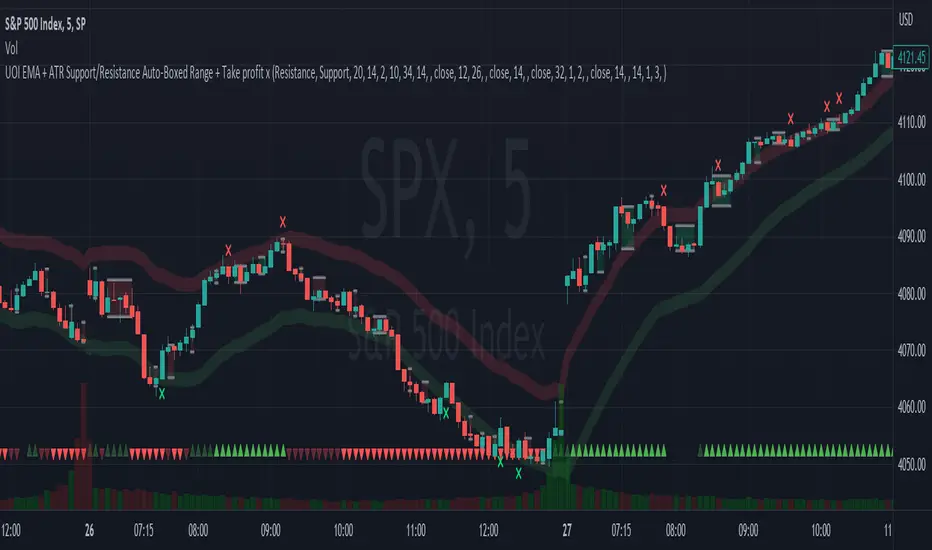
EMA + ATR Support/Resistance Auto-Boxed Range + Take profitUnveiling the 'EMA + ATR Support/Resistance Auto-Boxed Range + Take profit signal' tool, an innovative resource engineered for discerning traders to pinpoint crucial dynamic support and resistance levels (not like the common pivot based support and resistance indictors). The tool ingeniously amalgamates the power of EMA and ATR indicators to delineate these levels as green and red bands, offering invaluable insights into potential trading windows.
The real game-changers in this tool are the newly incorporated 'Auto Boxed Range Detector' and the 'Bull Bear Tug of War' detector. The Auto Boxed Range Detector is at the core of this update, illuminating price ranges to give you the upper hand in detecting breakouts or breakdowns. This feature has been designed meticulously to automate the identification of trading ranges, thereby increasing the accuracy and speed of your decision-making process. Also, this helps avoiding fake breakouts. If the top of the boxed range is near resistance line it is less likely to breakout unless we are on a trend day.
Simultaneously, the Bull Bear Tug of War detector (the little red and green triangles at the bottom) introduces an entirely new dimension of market dominance visualization. This detector embodies market power struggles through vivid red and green triangles, supplemented by translucent colors for transitional periods or potential false-outs. It's a dynamic, real-time pictorial representation of the ceaseless tug of war between bulls and bears captured by a combination of RSI, CCI, MACD, STOCHASTIC, AND VWAP, enabling you to anticipate market swings better. You can change the position of the triangles in the setting and move the red ones to top and keep the green ones in the bottom.
Customization options are plentiful, including the ability to tweak the EMA and ATR lengths, with default values set at 20 and 14 respectively. Additionally, you can modify the ATR multiplier in the S/R length setting, defaulted at 2, and the line width for optimal visibility. The EMA line can be made visible in the settings, while support and resistance lines are color-coded in green and red for instant recognition.
When prices make contact with these levels, the tool generates visual cues in the form of crosses above or below the price bars, thus serving as potential take profit or entry/exit points. Should you prefer, take profit signals can be deactivated in the settings.
To leverage this tool to its maximum potential:
- Fine-tune the EMA and ATR lengths to resonate with your trading strategy. Longer lengths yield smoother lines but may trail current prices.
- Determine the S/R length to govern the spacing of support and resistance lines from the EMA line.
- Stay alert for crosses above or below the price bar, signaling when prices have met support or resistance levels. These are key indicators for potential take profit or entry/exit decisions.
- For best results, this tool should be used in conjunction with other indicators to corroborate signals and minimize false alerts. The ultimate aim is to utilize other indicators to initiate a trade and rely on this tool to provide timely take profit reminders.
Bear in mind, this tool should not be the sole determinant in your investment decisions. Comprehensive research and a multifaceted approach are indispensable when contemplating any trades.
Range Analysis - By LeviathanThe Interactive Range Analysis script is an essential tool for analyzing price ranges. It automatically draws important range levels, generates a Volume Profile or Open Interest profile and horizontal/vertical heatmaps, plots the anchored VWAP, draws Fibonacci levels, and much more.
How to use the indicator:
1. The script will prompt you to select the "Start Time" and "End Time" using Tradingview's interactive interface. These two points will determine the length of the range.
2. Once you have selected the range, the script will automatically anchor the range highs and lows to the highest and lowest close/wick/hlc3/ohlc4 (whichever you prefer).
3. You can then begin exploring different tools and options such as Quarters, Eighths, Fibonacci, Outer Levels, VWAP, Horizontal Volume/OI Heatmap, Vertical Volume/OI Heatmap, Fixed Range Volume Profile, Open Interest Profile, Value Area, VAH, VAL, and POC.
4. You can adjust the range by dragging the Start Time and End Time anchors or by removing/reapplying the script.
Tool overview
Range Levels
After selecting your preferred time range, the script will identify and draw a range high level and a range low level, which serve as a base for other important levels. “Half” is the level halfway between the range high and range low. “Quarters” will, as the name suggests, split the range into four equal zones (quarters) and “Eighths” will split the range into eight equal zones (eighths).
”Fibonacci” option allows you to display Fibonacci retracement levels (0.786, 0.618, 0.382, 0.236). “VWAP” will plot a Volume Weighted Average Price, anchored to the start of the range. “Direction” input lets you choose whether your range is UP or DOWN trending in order to make sure that the Fibonacci levels and labels are generated and assigned correctly. With “Outer” turned ON, the script will also generate active levels (quarters/eighths/Fibonacci) above and below the selected price range. “Extend Right” will extend all levels to the right indefinitely, while “Extend (+Bars)” lets you choose how far right the levels get extended. “Diagonal Line” is drawn from the bottom left of the range to the top right of the range or from the top left of the range to the bottom right of the range, depending on the “Direction” input.
Volume Profile / Open Interest Profile
After selecting the “Data Type”, Volume Profile or OI Profile can be generated by turning ON the “Volume/OI Profile” option.
“Resolution” input defines the amount of nodes/rows in the range that are used in profile/heatmap generation for distributing the data. While you can increase the “Resolution” to get better, more granular profiles, you should keep in mind that you might need to lower the resolution when generating profiles for larger ranges.
”Node Type” offers you two options when it comes to the representation of data: Up/Down - divides a node in two sections for up volume/OI and down volume/OI, Total - one node for total volume/OI and Delta - net difference in up volume/OI and down volume/OI.
”Profile Position” lets you choose whether the profile is positioned on the left side of the range or on the right side of the range.
“Profile Direction” determines whether the profile nodes are facing right or left.
“Profile Type” enables you to visualize the nodes in a classic way (Type 1) or in a way where down volume/negative OI are positioned on the left side of the y axis and up volume/positive OI on the right side of the y axis.
“Node Size (%)” defines how much space in the range can be taken by the profile’s nodes. Eg. 50% will allow the largest node to extend to the middle of the range (and others scaled accordingly), 100% will allow the largest node to extend the max right point of the range (and others scaled accordingly).
”Value Area (%)” defines the VA zone, which represents the area where the most volume occured (usually 70% or 68%).
”Horizontal Heatmap” will display a heatmap-like overlay, that will help you identify the price levels where most volume/open interest action occurred.
”Vertical Heatmap” will display a heatmap-like overlay, that will help you identify the points in time where most volume/open interest action occurred.
A more detailed description of this indicator is coming in the next few days.
Important:
* If volume or OI profile does not get generated, try lowering the resolution.
* Once in a while, the script will disappear from your chart. Just remove and reapply.
* Open Interest data is only avaiable on Binance Perpetual Futures pairs
To learn more, read the tooltips in the indicator’s settings and stay tuned for upcoming additions (Range Market Structure, Liquidation Levels, Range Statistics,…)

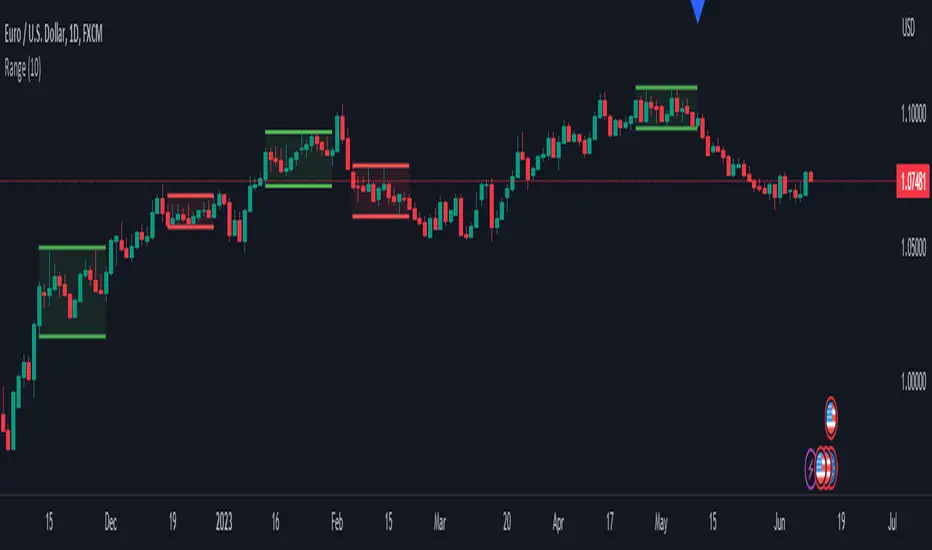
Range DetectionThis is a simple indicator to find the sideways market or ranging market.
It is mainly focused on BTCUSD as BTCUSD doesn’t make big moves each and every candle. It makes big breakouts with one candle and then goes sideways for a longer period of time.
So, this indicator identifies those big candles and plots high and lows of those big candles using lines. New range is created only when new candles close above or below previous major candles high or low.
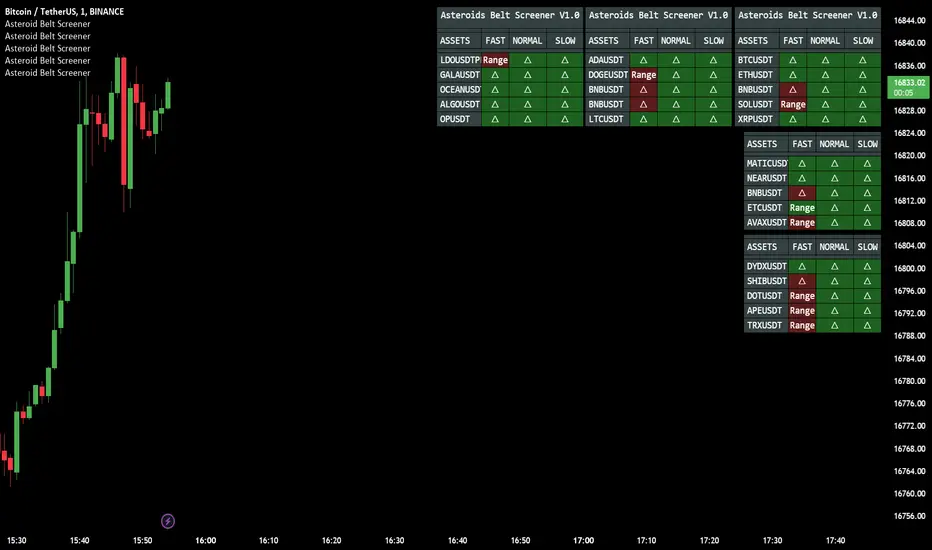
Asteroid Belt ScreenerAsteroid Belt Screener Observe the market in relation to the dynamic trend strength Asteroids Belt indicator, reference for trend trading opportunities.
SCAN MULTI ASSETS WITH ALL 3 RESPONSIVE TIMES ALL AT ONCE
The New Compliment Indicator to the much loved Asteroids Belt, providing a unique way to scan the market, never miss an opportunity with multi Asset Alerts and customizable display.
With additional Pre configured Aggregators, users of asteroids belt will be pleased to know that the indicator does come with 50 automated aggregation settings,
Using the custom position coordinates X,Y users can load multiple instances of the screener, choose individual assets, place them on their chart as they wish and scan for 5 assets PER screener.
Users can also choose to use assets outside of the list of 50, and control the aggregators manually, this allows for complete customization with no limit to symbols.
Users are also given the chance to set alerts for the following:
Alerts
Bullish Trend: Fast,Normal Slow (belt trend color change)
Bearish Trend: Fast,Normal Slow (belt trend color change)
Entering Belt: Fast Normal Slow (belt level detections)
Leaving Belt: Fast,Normal Slow (belt level detections)
TO DO:
Additional alerts e.g. fast trend green with red slow belt. Allowing for filtered opportunities.
Increase pre made aggregator asset lists, and improve.
Range Band (Expo)█ Overview
Range Band (Expo) measures an asset's volatility and price movements to plot the most relevant price range. Identifying ranges in trading is extremely important for traders to assess the current market and make informed decisions about when to enter and exit positions.
By identifying ranges, traders can identify support and resistance levels , and use these levels to determine when to enter and exit a trade. Ranges also help traders to identify potential entry and exit points and set stop-loss and take-profit levels. Additionally, ranges can help traders to identify potential trends and reversals .
█ How to use
Identify potential trading opportunities
For example, if the price is bouncing between the upper and lower range bands, it may indicate that traders could potentially profit from short-term contrarian trades. Similarly, if the price is trading near the upper or lower range band, it may indicate that traders could potentially profit from long-term trend trades.
Price Ranges and SR Levels
Range bands help traders identify price ranges that are likely to be profitable. It is a graphical representation of price movement and is typically used to identify support and resistance levels. Range bands are also used to identify potential entry and exit points.
Trends
Range bands are used in to identify trends.
Reversals
Range bands are used in technical analysis to identify potential reversal points.
Overbought and Oversold
When the price reaches the upper range band, it may indicate that the asset is overbought and that the price is likely to fall. When the price reaches the lower range band, it may indicate that the asset is oversold and that the price is likely to rise.
-----------------
Disclaimer
The information contained in my Scripts/Indicators/Ideas/Algos/Systems does not constitute financial advice or a solicitation to buy or sell any securities of any type. I will not accept liability for any loss or damage, including without limitation any loss of profit, which may arise directly or indirectly from the use of or reliance on such information.
All investments involve risk, and the past performance of a security, industry, sector, market, financial product, trading strategy, backtest, or individual's trading does not guarantee future results or returns. Investors are fully responsible for any investment decisions they make. Such decisions should be based solely on an evaluation of their financial circumstances, investment objectives, risk tolerance, and liquidity needs.
My Scripts/Indicators/Ideas/Algos/Systems are only for educational purposes!

Mastering Market Structure"Market structure first, always" - Mr. Anderson aka TrueCrypto28 right before he went on to master Kung-Fu
Understanding and identifying market structure is essential for successful and consistent profitability. No system is perfect, but trading in the direction of the prevailing market structure can reduce the likelihood of being caught severely offsides and can yield trades with tighter invalidations and greater risk-to-reward potential.
This script will automatically identify and plot the following:
Market Structure
Pivot highs and lows using the lookback left and right lengths are analyzed to identify major swing highs and lows to identify the current trading range.
Bullish structure is characterized by a series of higher highs and higher lows.
Bearish Structure is characterized by lower highs and lower lows.
Structure breaks when a bar closes outside the current trading range. Major swing highs and lows will update following these breaks to continue following the current price action
Current market structure bias, bullish or bearish, can be displayed in a table in the location of your choosing.
Structure is fractal, so seeing low time frame structure shift against the high time frame structure can identify the beginning of a pullback. When it realigns with the high timeframe structure, it can identify the beginning of the high time frame trend continuation. You can choose to analyze structure on any timeframe with this script and even add multiple copies of it to your chart each analyzing different a timeframes to easily find high quality trade opportunities.
Fibonacci Levels of the current trading range
These are included to help identify areas of interest for trade execution and profit levels.
We want to buy at a discount and sell at a premium. The "Wholesale Zone" can be considered below the 50% retracement level in bullish structure, or above it in a bearish structure.
When in a bullish structure, "discount" buy opportunities can be found below the 50% retracement level with the expectation of trend continuation.
In a bearish structure, more ideal "premium' sell opportunities can be found above the 50% retracement with the expectation of trend continuation.
Optimal trade entry (OTE) zone, between the 61.8% and 78.6% retracement can offer a great risk-to-reward ratio for execution of a new position in trending environments.
When trading sideways in a range, opening new buy positions near the bottom of the range or new sell positions from the top of the range are preferred. Midrange 50% level commonly sees some reaction and can be used as a primary target with further targets either being the opposite end of the range or lower support levels (see order block section).
Order Blocks
New Bullish and bearish order blocks are created and plotted with every respective market structure break. They identify the price level from which the most recent leg of price action that yielded the structure break began.
In strong trending environments, these levels should continue to support or resist price. They are great areas to look to enter new positions.
Order blocks can also be used as targets for your trades to avoid giving back unrealized profits as price tends to react off of these levels.
To keep your chart clean and the order blocks relevant, an order block will be automatically deleted if price trades through and closes beyond it. Otherwise, printed order blocks will remain on your chart until either it's origin bar is out of TradingView's maximum bar history allowance or their maximum box count allowance.
Pairing these with fibonacci levels, retracements into order blocks that are in the Wholesale Zone or even the OTE zone offer higher probability trades with more favorable risk-to-reward potential.
Swing Failure
Swing failure patterns (SFPs) arise when a candle takes out a swing high or low, but fails to close beyond it.
Again, pairing these with other features of this script like range boundaries, wholesale zones, OTE zones, and order blocks can help traders identify the best times to actually execute their trade as SFPs are commonly seen at points of inflection in price action.
Moving Averages
Up to 4 moving averages from the current time frame are available. MA type and lengths can be adjusted to your preference.
Up to 4 MTF MAs. By Default this is an EMA 200 as it is commonly used for trend identification and support/resistance.
These are included for confluence of trend direction and strength.
They can also act as dynamic support and resistance and so can be useful for trade execution if price bounces or rejects off of them or targets as price may do so when it reaches them.
Additionally, alerts have been coded for the following scenarios:
MS Break alerts will trigger on bar close when a break in market structure has been confirmed.
SFP alerts will trigger on bar close when the swing failure pattern has been confirmed.
Entering OB alerts will trigger as soon as price touches the closest order block.
Entering Wholesale Zone alerts will trigger as soon as price cross the 50% retracement level. This can be used as an early alert to identify assets that have undergone a significant pullback before potential continuation in the direction of the main trend.
Entering OTE Zone alerts will trigger as soon as price crosses into the Optimal Trade Entry zone between the 61.8% and 78.6% retracement.
This script is unique in the way that it tracks market structure, automatically updates as price action continues to develop, presents high quality areas of interest, and SFPs for trend reversal and continuation. Traders will no longer need to constantly monitor their charts or exhaustively update their alerts to find good trade opportunities. This script takes care of all of it automatically. Collectively, all of the included features can be used to build a complete trading system.

Range Detector Indicator [Misu]█ This indicator shows an upper and lower band based on Highs and Lows.
Depending on this, the indicator interprets a ranging market, an uptrend or a downtrend.
█ Usages:
The purpose of this indicator is to identify when the price is ranging.
It's also used to identify changes in trends, breaking points, and trend reversals.
But it can also be used to show resistance or support levels.
█ Features:
> Price Action Change Alerts
> Price Action Change Labels
> Color Bars
> Show Bands
█ Parameters:
Deviation: A parameter used to calculate pivots.
Depth: A parameter used to calculate pivots.
Activate Range Detection: Check the box to activate range detection.
Band% Offset: A factor that is used to vary the bands offset.

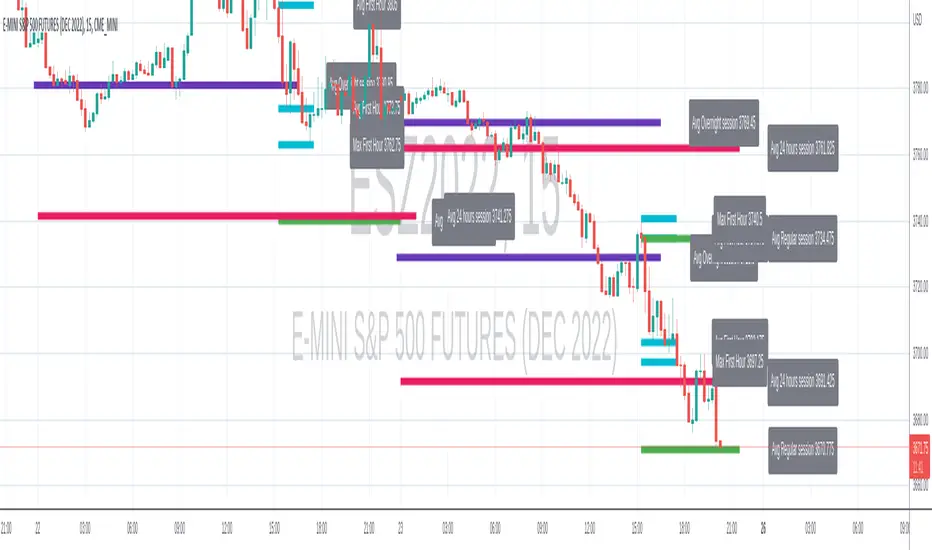
Range-AnalysisMarkets usually tend to stay within a range during a specific time frame (for example first hour of the regular trading session, the whole regular trading session). For traders before initiating a trade it can be helpful to determine the range potential left for the targeted time frame. So they can decide to either try to ride the current trend further or fade the current trend in the case there is no range potential left for the specific time frame. This could be especially helpful for example in the E-Mini S&P future during the first hour.
The script calculates the average range for the last x days of the session defined and plots a line at the expected range extremes based on that average (for example: RangeExtremeHigh would be currentSessionLow+average Range of the last x days.
Any feedback is appreciated.
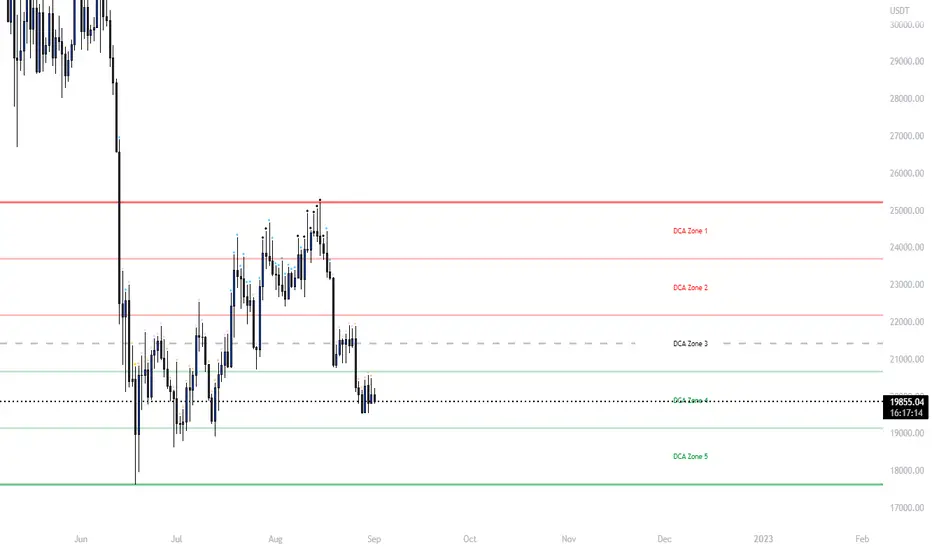
Ultimate Grid Tool + Alerts (DCA & Limit Orders) [enzedengineer]Overview
The "Ultimate Grid Tool + Alerts" script works much like a grid bot from automated trading services such as 3Commas making it a good free alternative with some extra utility.
How it works
The user is prompted to set up a grid by manually defining a lower and upper range and then by selecting how many grid segments they want (max 20). The script will automatically create equally spaced grids within this defined range. The script has built in alerts which are intended to be used in conjunction with a third-party application to execute buy and sell orders on an exchange.
The script has two alert functionalities to choose between:
Limit orders (like traditional grid bots) or;
DCA zones (time-based)
DCA zones:
This is the default selection. Each zone has its own alert condition which is triggered if the price closes within that zone. The frequency of the alert is determined by the user's chart resolution, therefore you can have the alert trigger every day, or 4 hours, or 30 minutes and so on. This allows for flexibility, for example, you could go from DCA'ing at $20 per day at higher prices to $100 per day as the price drops into the lower end of your grid range.
Limit orders:
This mode is selected by checking the "Limit Order" box. As mentioned earlier, this mode works like traditional grid bots with each grid line representing a limit order. The alert condition is met when ta.cross(close, gridline) = true.
Buy and Sell:
This mode is selected by checking the "Buy and Sell" box. This is a visual modification only which changes the colour of the grids to help plan the user's trading. Please note, there is no buying or selling logic within the script itself - this should be built into the alert message to be used with a third-party application for exchange order execution.
Use case: The author of this script has been using it with the default settings to DCA into Bitcoin in the current bear market. Using a chart resolution of 15 minutes the script purchases x-amount of Bitcoin every 15 minutes (Alertatron executes the exchange orders). This method provides a well blended average price and takes away the internal conundrum of "should I buy some today". No matter what, the bot will make a purchase within at least 15 minutes of the ultimate Bitcoin bottom and arguably this gives a psychological edge and reduces FOMO (fear of missing out).
Impatient TS VWAP BandsImpatient VWAP bands are based of Traderskew's VWAP bands but are for more impatient traders.
Wicking or crossing down through the upper band indicates a good short trade entry for range-bound trading periods while wicking or crossing up through the lower band indicates a good long entry in range-bound conditions.
By default, impatience is disabled. If it is turned on, adjusting impatience determines how quickly the bands approach price: higher impatience approaches price faster. Rebound indicates how far from price the bands bounce after hitting price.

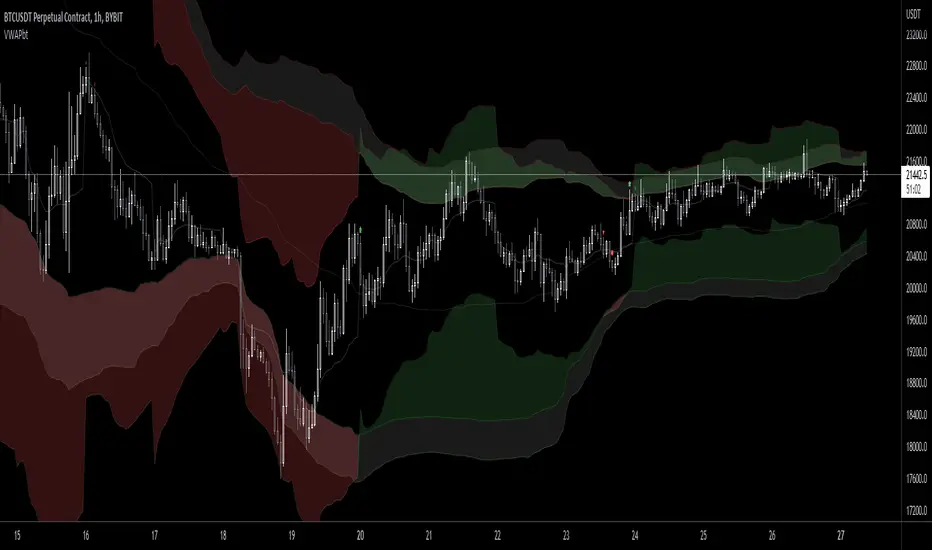
VWAP Band TrendThis indicator combines two features: VWAP bands for range trading and trends for trend-following.
The white bands offer support/resistance levels ideal for range trading: short when rejecting off the upper band, long when rejecting off the lower. Take profit either when hitting the (faint gray) midline and/or when hitting the band on the far side.
The trend analysis shows green or red ranges above or below the bands to indicate trend strength - larger swaths of green or red indicates strong trend while shorter swathes indicate weak. If the upper trend color doesn't match the lower trend color, the trend is undecided or transitioning.
Optionally, trend initiation indicators can be turned on to show above/below candles where a trend switch is taking place.
Oasis Trading Group Market Making Bot - Mean Reversion BandsThe OTG Market Making Bot was designed with mean reversion trading in mind. It uses advanced ATR and other volatility formulas to create a set of bands that price should stay within. If price is testing the upper or lower bands then it is "extended" and a mean reversion back to the midline is likely.
The indicator comes with two sets of reversion bands, by default they are set to two and three standard deviations away from the midline, these can be changed to your preference. The indicator will give you Buy and Sell arrows if the conditions are being met. The conditions can be as simple as price hitting the bands or with certain filters, the filters are as follows:
Volatility Filter: Based on your settings it will look at the Current ATR vs Historic ATR Average if the Current ATR is higher than the average it will not show the mean reversion Buy/Sell signals because the volatility is too high. This filter can be turned on and off in the settings.
Trend Filter: Based on your settings it will lookback a certain amount of candles to see if the current price action is ranging or trending. If the current price action is determined to be trending it will not show the mean reversion Buy/Sell signals because it wants to trade within a range. This filter cannot be turned off in the settings, but if you wish to see all the Mean Reversion Buy/Sell signals without any filters you can turn them on in the style settings.
Midline: The midline is color coded based on your Trend Lookback settings. If it determines that the market is ranging it will be colored Green, if it determines that the market is trending it will be colored Red. Green means you are safe to take Mean Reversion trades.
The indicator comes with multiple alerts for all the different Buy/Sell signals. These signals can come from the first set of bands, second set, or unfiltered.
This indicator is designed to be paired with the ATR Improved Indicator I have created which is open source, it can be found here.
Also, paired with the OTG Automated Trading Bot. The OTG Trading Bot is a trend following bot, it excels in trend trading but fails in range trading. This Mean Reversion bot was designed to compliment the OTG Bot perfectly.
The Oasis Trading Group Market Making Bot will be available as a free add-on to all OTG Trading Bot users.
If you have any questions feel free to let me know in the comments or DM me.
