Custom CVD with signalCustom CVD with signal
This signal based on different CVD parts of volume crossing
Important! Since the indicator works exclusively on volumes, choosing an exchange for analysis is crucial for the accuracy of the signals. I recommend using either Coinbase or Binance when analyzing spot volumes.
RCI

Quantum RCI FusionDescription:
Overview: The Quantum Momentum Engine Quantum RCI Fusion is a sophisticated momentum oscillator designed to solve the #1 problem of classic indicators: false signals in sideways markets. At the core of this script is the Rank Correlation Index (RCI), a powerful statistical tool based on Spearman’s correlation. Unlike RSI or Stochastic which only look at price levels, the RCI evaluates the "quality" of a trend by measuring the temporal correlation of price ranks.
This script is not just a line drawing: it is a complete trading ecosystem that fuses three RCI timeframes, volatility filters, and a real-time Risk Management simulation.
🛠 How It Works: The "Fusion" Logic
The strength of this indicator lies in the synergy between its components. It is not a simple mashup, but a filtered logical system:
Triple RCI Engine (Fast, Mid, Slow):
Fast (13) & Mid (18): These generate the Crossover signal for precise entry timing.
Slow (30) - The "Trend Shield": The true innovation. It acts as a directional shield; if the baseline is bullish, the script protects Long positions by ignoring premature exit signals, allowing you to ride the full trend.
HMA Smoothing: Raw price data passes through a Hull Moving Average before the RCI calculation. This drastically reduces market "noise" without sacrificing the responsiveness typical of the RCI.
Intelligent Filters (Anti-Whipsaw):
ADX Integration: Signals are blocked if the ADX is below the threshold (default 20), preventing trading in flat/ranging markets.
Momentum Impulse: Requires a minimum variation (Delta) in the RCI to confirm that the move has real drive and is not just random fluctuation.
🛡 Risk Management & Simulation
Since timing is useless without risk management, Quantum RCI Fusion includes a Dashboard and sophisticated exit logic:
Multiple Exits:
Take Profit / Stop Loss: Based on dynamic ATR multipliers.
Shield Break: Safety exit if the underlying trend (Slow RCI) changes direction.
Emergency: Immediate close if momentum sharply reverses across the zero line.
Live Dashboard: Monitors Win Rate, virtual PnL, and Trade Status (Long/Short/Scanning) in real-time directly on the chart, removing the need for external backtesters.
🚀 How to Use It
Setup: Add the script to a separate pane below your price chart.
Entry Signals:
LONG (Green Triangle): RCI Fast crosses Mid upwards + Oversold Zone (< -80) + ADX > 20 + Bullish Shield.
SHORT (Red Triangle): RCI Fast crosses Mid downwards + Overbought Zone (> 80) + ADX > 20 + Bearish Shield.
Customization:
Scalping: Reduce RCI lengths (e.g., 8/12/20) and disable the "Trend Shield" for quick entries and exits.
Swing Trading: Keep defaults and use the ATR Trailing logic to manage positions on H4 or Daily timeframes.
⚖️ Notes & Credits
Originality: This script enhances the standard RCI by implementing Array-based calculations (optimized for Pine v6), proprietary HMA smoothing, and unique "Trend Shield" logic.
Open Source: The code is released under the MPL 2.0 license. Credits to the Pine community for the foundational mathematical formulas of Spearman's correlation.
Disclaimer: The statistics shown in the dashboard are simulations based on live data and do not guarantee future profits. You are responsible for your own trading decisions.
🖼 Instructions for the Publication Chart (Preview)
To ensure your script gets approved and attracts users, follow these steps for the cover image:
Symbol: Use a volatile and liquid asset, e.g., BTCUSD or XAUUSD (Gold), on a 1H or 4H timeframe.
Clean Layout: Remove all other indicators from the chart (no Moving Averages on price, no Bollinger Bands). The focus must be solely on your script in the bottom pane.
Visualization:
Ensure the Dashboard (stats table) is clearly visible and does not obscure the most recent candle.
The chart should show at least one clear BUY and one clear SELL signal, ideally with the exit icons (the "X" or flags) visible to demonstrate the exit logic.

RCI4linesRCI4lines plots four Rank Correlation Index (RCI) lines in a single panel to help you read momentum and trend conditions at a glance.
It shows two short-term RCIs (default: 7 and 9), a middle-term RCI (26), and a long-term RCI (52).
The script also draws shaded threshold zones between +80 to +95 and -80 to -95, making it easier to spot potential overbought / oversold areas and compare short-term moves with the bigger trend.
Useful for scalping to day trading, and for checking whether short-term momentum is aligned with mid/long-term direction.

RCI Strategy [PineIndicators]RCI Strategy
This strategy leverages the Rank Correlation Index (RCI) — a statistical oscillator that measures the relationship between time and price rank — combined with a configurable moving average filter. It offers clean, rule-based entries and exits, and visually enhanced trade tracking via labeled markers and boxes on the chart.
The RCI Strategy is well-suited for momentum traders looking to capture directional shifts with confirmation through RCI smoothing.
Core Logic
1. Rank Correlation Index (RCI)
Measures how closely price changes correlate with time rankings.
Values range between -100 and +100.
Thresholds at ±80 help identify potential reversals or extremes.
2. RCI Smoothing via Moving Average
A moving average (MA) is applied to the RCI to smooth out fluctuations.
Supported MA types:
SMA
EMA
SMMA (RMA)
WMA
VWMA
Users can disable the smoothing by selecting "None".
Trade Entry Logic
Long Entry: RCI crosses above the selected moving average.
Short Entry: RCI crosses below the moving average.
Entries are restricted by trade direction settings:
Long Only
Short Only
Long & Short
Visual Features
RCI Panel Display
Plots RCI line and its moving average in a separate pane.
Horizontal guide lines at 0, +80, and -80 help visualize signal zones.
Trade Labels on Chart
Buy Label: Plotted when a long entry is executed.
Close Label: Plotted when any position is closed.
Triangle markers for visual emphasis on direction change.
Trade Visualization Boxes
A colored box is drawn between entry and exit prices.
Green = profitable trade; Red = losing trade.
Two horizontal lines connect entry and exit prices for reference.
Customization Parameters
RCI Source: Select input price for the RCI (default: close).
RCI Length: Set sensitivity of the oscillator.
MA Type and Length: Choose and configure the smoothing filter.
Trade Direction Mode: Define whether to allow Long, Short, or both.
Use Cases
Swing traders who want to trade directional reversals with statistical backing.
Traders seeking a clean and visual strategy based on rank momentum.
Environments where both trend and range dynamics occur.
Conclusion
The RCI Strategy is a non-repainting, rule-based trading model that combines rank correlation momentum with smoothed trend logic. Its clean visual markers, labeled trades, and flexible MA filters make it a valuable tool for discretionary and systematic traders alike.

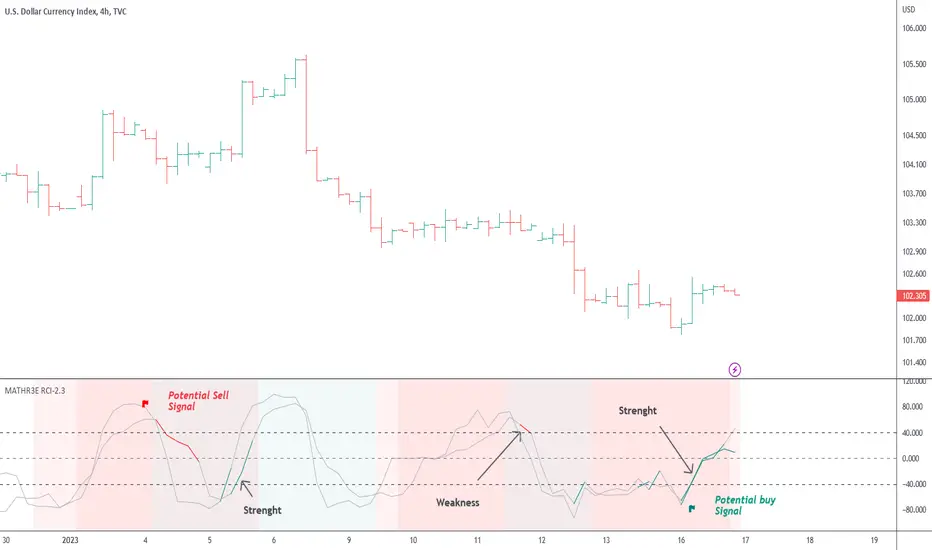
MATHR3E Range Conquest Index█ OVERVIEW
MATHR3E Range Conquest Index (RCI) is an arithmetic oscillator for trend analysis.
█ CONCEPTS
Disclaimer
MATHR3E RCI indicator is intended for advanced traders and may fit your profile, whether you are a day trader or a long-term investor.
It was originally developed by a renowned market analyst and documented in numerous books. Among them is the author Jason Perl.
It is recommended to have read the trading techniques mentioned in the books covering this indicator beforehand.
Introduction
MATHR3E RCI can serve several purposes:
• By helping to confirm price reversals.
• By giving low risk potential entry indication
• By outlining the emergence of a price trend
How to use
MATHR3E RCI is a dual oscillator.
Each oscillator compares the price evolution of a given day with that of two trading days earlier.
They differ in the amount of trading bars taken into account when calculating the RCI.
Oscillator values fluctuate between overbought and oversold levels
The time spent above or below these levels is compared to the Duration Analysis parameter (in bars).
When it is greater than this Duration, an excessive move is underway which usually require the oscillator to return to the neutral zone.
Strengths or weaknesses are then detected when the oscillator returns to its zone of excess by marking a mild reading, i.e. spending less time than the duration analysis parameter.
█ FEATURES & BENEFITS
Versatile
The indicator is designed to work with other indicators by the same author, including the identification of exhaustion points.
This indicator can be applied to any market or time frame.
Price Oscillator Qualifier
Identify low-risk buy or sell opportunities with
• Qualified upside breakouts
• Qualified downside breakouts
Fully Customizable
Multiples settings available to configure
• Oscillator Periods
• Duration Analysis
• Overbought and oversold reading
Alerts
Get notified on:
• Weakness signal
• Strength signal
• POQ signals
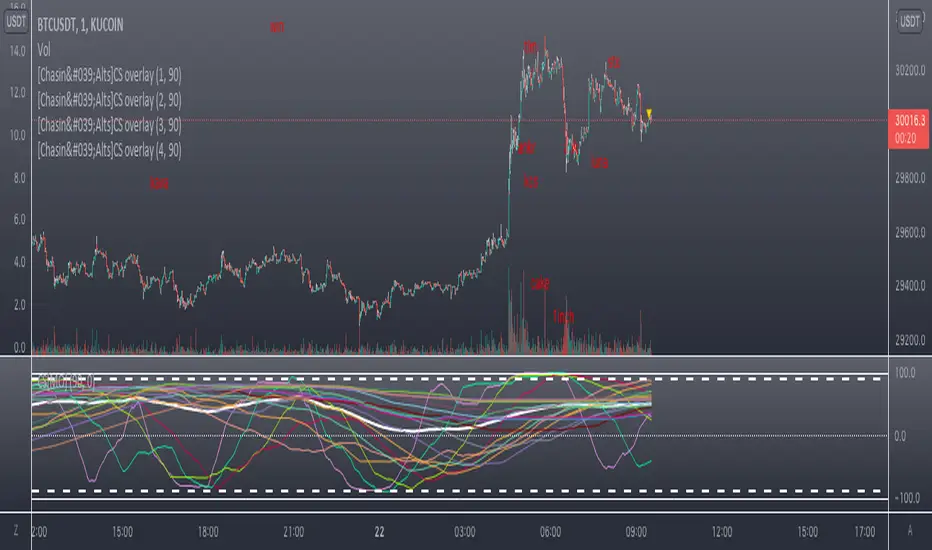
Counting Stars Overlay [Market Overview Series]Hi fellow tradeurs,
So it's always been my goal to provide one of my best scripts. This is from what I call my "Market Overview" series. It is a scanner for my second best script to date. Market Overview bc of its origins as a scanner of the Kucoin Margin Coins. I realize that there are more coins that there are more margin coins that Kucoin has but I wanted to have a solid 40 coins on each coin "set". If you are unfamiliar with what I mean by 'sets' then you can view my other scanner scripts on this account for futher elaboration but to sum it up....there are 4 sets of coins I have to choose from in the settings. Each set has 40 coins in them (as there is a cap of 40 security calls that can be made per each iteration of the script on the chart). That being said...if you have the capabilities then add this script 4 times to your chart and select a diff set for each copy of the script. This has the scanner in a way that I've yet to present in my others scripts. When the alert for a coin goes off then the coins name will be printed as a label over the main chart. BTW, this was built for the 1 min timeframe and have used it EXTENSIVELY and this is the best TF for how the settings are set. I will also publish another script that will be a visual aid for this one but will rather show all the plots associated with the code that is in this scanner. Know that for the scanner it'll be best to choose a coin that has at least 1 trade/update/printed candle per minute (to be safe use BTC or ETH chart or else some of the signals will be printed if the signal arrives at a point in time where the coin on the screen does not print a candle bc no new trade or update to trades occur in TradingView. For the visual aid script that I will add right after this, there will be 20 different plots that appear. When the AVG of all of these plots is beyond the OverBought line and then the AVG line is falling for 2 bars...THEN the long signal for that coin is generated (and vise versa for short signals) Lastly regarding the visual aid script, THAT ONE will ONLY show the 20 plots that are associated with the coin that the chart is selected for. So that one is not a scanner and is just a stand alone script (again) to show whats going on in the background of this scanner. Now, once you add it however many time you want to see however many sets of coins you want, I recommend merging the scales so that they are all on one scale. I prefer mine being on the left side but all you have to do is select the 3 dots in the scripts settings in the chart window and select the scale location line and it'll open another set of lines at which point you can select "merge to scale Z" (that will be the left scale) and will put all the scales together on the left. I forgot ****If you want to see a whole diff exchange's coins you much make changes to this original script and it is further described how to do so in one of my first publications**** I REALLY hope it becomes of some benefit to you in your trading as it abundantly has in my own. It is after all one of the best of my best. Ohh, I forgot to add alerts to this but will do so immediately following this. To finish, this script DOES NOT REPAINT as far as I have EVER seen (and I have extensively searched for it bc of how good the signals were, I figured I MUST HAVE made a mistake and it did so...but alas...it does not. If you notice something on the contrary do notify me immediately with the coin, exchange, TF, and time of the occurrence and we can go from there. If anyone has any great ideas for the script then please do also let me know and if I find anyone with some abilities that mingle well with my own then lets talk as I'm always looking for good ol chaps to help me out with other scripts bc if you think this is good....well....you must imagine that I've got better that I have not/am not publishing. Aaaaaanywho, goodluck to you all. I wish you the best. ***I've got good info on how to look out for false signals but I want to see what yall come up with first before I give away all my alpha.
AND if anyone asks questions that Ive already touched on in this description or already in the comments sections then maybe someone there would be willing to waste their time answering them bc I've done quite a bit of work here that I am HAPPY to hand over to the general public but if you are not willing to do the work in reading to possibly answer your inquiries that have already been answered then I am not willing to do that work for you again. Peace and love people...peace and love. Im out.

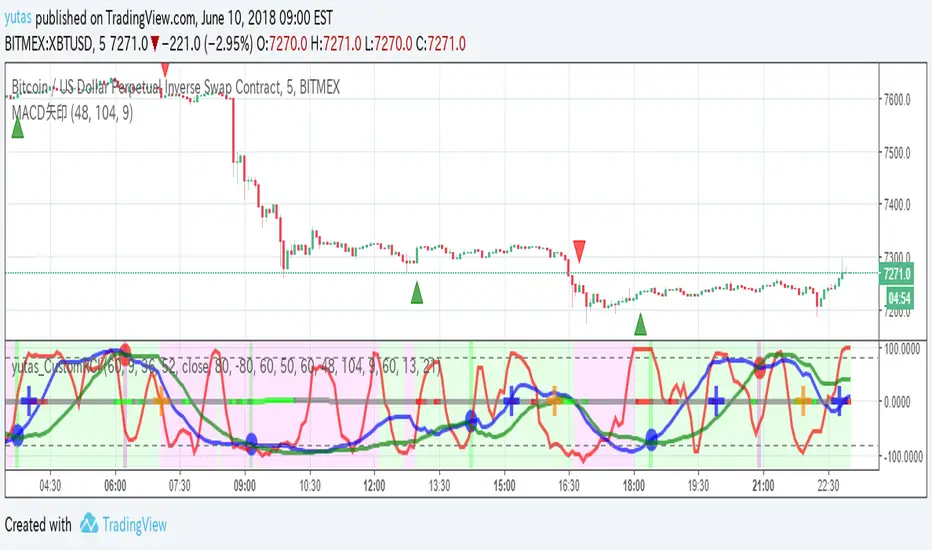
Multi-Function RCI(strategic signal,alert and divergence)Japanese below / 日本語説明は下記
Overview
Multi-function RCI indicator with functions below.
1.Multiple signals according to conditions where 3 RCI lines cross
2.Alert when signals triggered
3.Auto divergence drawing
What is RCI?
RCI is one of the oscillator indicators such as RSI and stochastic, measuring overbought/oversold. While RSI and stochastic measures overbought/oversold by price axis, RCI measures by price and time axis.
Please see the details below.
Functions:
1.Multiple signals according to conditions where RCI 3 lines cross
There is two types of signals available in this indicator
A. Overbought/oversold signals
B. Strategic signals
A. Overbought/oversold signals
These signals are displayed when each RCI line crosses upperband/lowerband.
Conditions are as follows:
-RCI(Short) cross over/under upper band
-RCI(Short) cross over/under lower band
-RCI(Middle) cross over/under upper band
-RCI(Middle) cross over/under lower band
-RCI(Long) cross over/under upper band
-RCI(Long) cross over/under lower band
Upper band and lower band can be parameterized.
a. Cross over upper band/Cross under lower band:
These signal are good to judge trend maturity. Once trends get matured, market usually goes into sideways and lead to trend reversal.
b. Cross under upper band/Cross over lower band:
These signal are good to catch trend reversal.
The longer RCI period gets, the bigger price movement gets.
Sample chart
RCI(middle,dark blue) and RCI(Long, magenta) crosses over/under upper band/lower band
B. Strategic signals
Strategic signals are more appropriate to judge timing to enter a trade.
Signals will be appeared when conditions below met with option to select signal sensitivity.
-RCI(Short) crosses over RCI(Middle)
-RCI(Middle) crosses over RCI(Long) and RCI(Long) is below zero line
-RCI(Short) crosses over RCI(Long) and RCI(Long) is below zero line
-RCI(Short) crosses under RCI(Middle)
-RCI(Middle) crosses under RCI(Long) and RCI(Long) is below zero line
-RCI(Short) crosses under RCI(Long) and RCI(Long) is below zero line
With signal sensitivity “Advanced” selected, signals will be displayed when conditions above are met above upper band or below lower band.
Advanced mode is more suitable to aim bigger trend while standard mode is for short term up/down movement.
Signal sensitivity is designed for users to select depending on their trading style(Day trading, swing trading, scalping) and strategy.
Once strategic signals triggered, prepare for trend reversal, observing price action.
The two charts below describe how different signal sensitivity makes.
Sample chart(Standard)
RCI(middle, dark blue) and RCI(long,magenta) cross signals are displayed as an example
Sample chart(Advanced)
RCI(middle, dark blue) and RCI(long,magenta) cross signals are displayed as an example
As you can see, advanced mode is more suitable to aim big movement as RCI cross happens after maximum stretch, while standard is good to catch smaller wave.
2.Alert when signals triggered
Alert can be set with above-mentioned signal conditions.
3.Auto divergence drawing
Divergence line will be automatically drawn as per the logic below.
Also, users can select which RCI line(Short/middle/long) will be targeted to detect divergence.
Bearish : When two consecutive pivot highs go up but RCI values corresponding to each high go down.
Bullish: When two consecutive pivot lows go down but RCI values corresponding to each low go up.
Pivot highs(lows) are identified when those are preceded by n lower highs(lows) and proceeded by n lower highs(lows).
* n is parameterized.
See the diagram below.
How to access this indicator?
This indicator is paid and invited-only indicator.
Please see the instruction below.
Comment section is only for comments on the indicator or updates. Please refrain from contacting me using comments to follow TradingView house rules.
———————————————————————————————————————
多機能RCIインジケーターです。以下の機能が搭載されています。
1.複数タイプのシグナル表示(シグナル感度制御付き)
2.アラート設定
3.ダイバージェンス自動描画
RCIとは?
RCIはRSIやストキャスティクスと同様に買われすぎ・売られすぎを数値化するオシレーター系インジケーターの一つです。
RSIやストキャスティクスが価格軸だけを元に買われすぎ・売られすぎを数値化するのに対して、RCIは価格と時間軸の双方を考慮して買われすぎ・売られすぎを数値化するという違いがあります。
機能詳細は以下の通りです。
機能詳細
1.複数タイプのシグナル表示(シグナル感度制御付き)
3本のRCIとアッパーバンド・ロワーバンドとの交差条件で異なるシグナルを表示することができます。
このインジケーターには以下の2つのタイプのシグナルが存在します。
A. 買われすぎ/売られすぎシグナル
B. ストラテジーシグナル
A. 買われすぎ/売られすぎシグナル
RCIと買われすぎ・売られすぎの水準であるアッパーバンドとロワーバンドとのクロスでシグナルを表示します。
条件:
RCI(短期)がアッパーバンドを上抜いた時または下抜いた時
RCI(短期)がロワーバンドを下抜いた時または上抜いた時
RCI(中期)がアッパーバンドを上抜いた時または下抜いた時
RCI(中期)がロワーバンドを下抜いた時または上抜いた時
RCI(長期)がアッパーバンドを上抜いた時または下抜いた時
RCI(長期)がロワーバンドを下抜いた時または上抜いた時
アッパーバンドとロワーバンドはパラメータ設定可能です。(初期値は80と-80%)
<使い方>
A.アッパーバンドの上抜け/ロワーバンドの下抜け
トレンドの過熱感・成熟度の判断に使用。一般的にはトレンドが成熟しきった後に天井圏や底値圏を形成し、その後トレンド転換が発生します。
b.アッパーバンドの下抜け/ロワーバンドの上抜け
トレンド転換のタイミングを図るのに使用。
サンプルチャート
RCI中期(青)・長期(マゼンタ)が上下バンドを上抜いた時、下抜いた時
B. ストラテジーシグナル
3本のRCIの交差条件で発生するこのシグナルは相場の反転が期待できるシグナルということで、よりトレード機会の判断に向いています。
またシグナル発生の感度を、StandardとAdvancedの二つから選択することができます。
シグナル条件:
<シグナル感度: Standard>
<上昇示唆>
RCI(短期)がRCI(中期)を上抜いた時
RCI(中期)がRCI(長期)を上抜いた時かつ、RCI(長期)がゼロラインより下にある時※
RCI(短期)がRCI(長期)を上抜いた時かつ、RCI(長期)がゼロラインより下にある時
※ノイズを除去するため
<下落示唆>
RCI(短期)がRCI(中期)を下抜いた時
RCI(中期)がRCI(長期)を下抜いた時かつ、RCI(長期)がゼロラインより上にある時
RCI(短期)がRCI(長期)を下抜いた時かつ、RCI(長期)がゼロラインより上にある時
<シグナル感度: Advanced>
Advancedの場合は、RCIがアッパーバンドより上にある状態で上記の条件が満たされるか、ロワーバンドより下にある状態で上記条件が満たされた場合にのみシグナルが表示されます。
Advancedはよりトレンドの転換や大きな波を狙うのに適したものであるのに対し、Standardはより細かい動きを狙うためのシグナルとなるように設計しています。
この辺りの好みはトレードスタイルや狙いに応じて異なるため、トレーダーが各自選択できるように汎用的な作りとなっているのが特徴です。
ストラテジーシグナルが現れたらトレンド転換の可能性に備え、プライスアクションを見ながらトレードタイミングの判断を行います。
以下の二つのチャートでStandardとAdvancedモードで発せられるシグナルの違いが確認できます。
サンプルチャート(Standard モード)
中期RCI(青)と長期RCI(マゼンタ)の交差
サンプルチャート(Advanced モード)
中期RCI(青)と長期RCI(マゼンタ)の交差
AdvancedモードではRCIが最大限伸びたところからの交差を捉えているため、より大きな波を捉えられる一方で、Standardモードではより細かい波を捉えられることが確認できます。
3.ダイバージェンス自動描画機能
以下のロジックに基づきダイバージェンスを自動描画します。(初期表示:非表示)
下降示唆:2つの連続する高値(*)が切り上げられているが、 それぞれの高値に対応するRCIの値は切り下げている場合
上昇示唆:2つの連続する安値(*)が切り下がっているが、 それぞれの安値に対応するRCIは切り上がっている場合
*高値(安値)は、左右n本(**)ずつのローソク足の高値(安値)より高い(低い)高値(安値)をピボットハイ・ローとして算出しています。
** nはユーザ設定値です。
サンプルチャート
高値PL1はPL1の安値より左側にn個のより低い安値、右側にn個のより低い安値があった場合に安値として認識されます。
上記の例では安値がPL1>PL2と切り下がっていますが、対応するRCIの値はvalue1

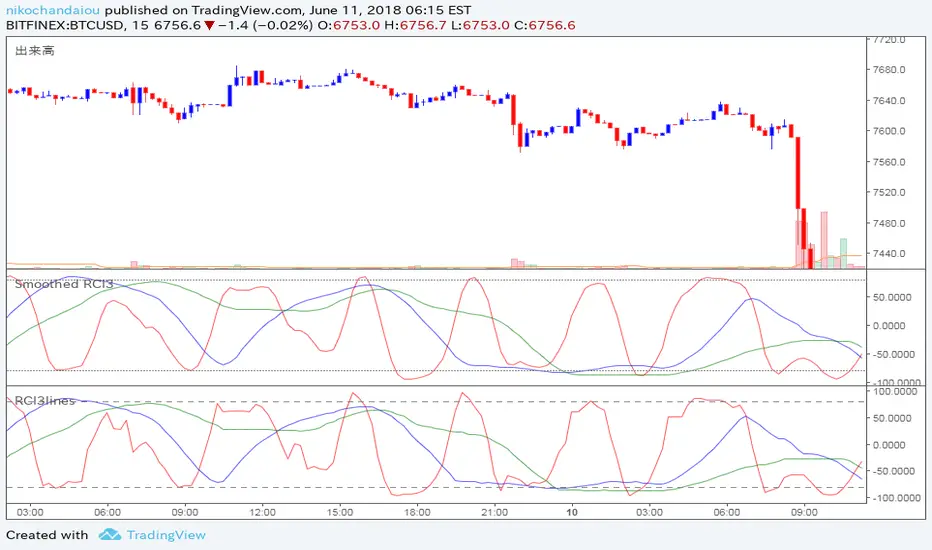
yutas_RCI3Lines_trend_freeVer1.0 (2021/10/07)
-*-*-*-*-*-*-*-*-*-*-*-*-*-*-*-*-*-*-*-*-*-*-*-*-*-*-*-*-*-*-*-*-*-*-*-*-*-*-*-*-*-*-*-*-*-*-*-*-*-*-*-*-*-*-*-*-*-*-*-*-*-*-*-*-*-*-*-*-*-*-*-*-*-*-*-*-*-*-*-*-*-*-
This indicator is a very simple one that combines multiple oscillators called RCI in a multi-time frame and signs the part that meets the conditions.
If you use normal RCI, the operation is too heavy and the display will cause an error, so it is very difficult to use, so I am using the RCI published by for this indicator.
There may be some discrepancies, so please use it at your own risk.
At the same time, it gives a sign of average line deviation.
You can set the time axis and upper and lower thresholds for each of RCI ①, RCI ②, and RCI ③.
The frequency of signs can be adjusted by setting different thresholds for the short-term line, medium-term line, and long-term line.
The initial setting is
Short-term line: up and down + -35
Mid-term line: Up and down +-50
Long-term battle: up and down +-50
It is possible to sign under the conditions of each RCI3lines.
(The display is OFF by default)
Alerts can also be sent to each.
In addition, if each of RCI ①, ②, and ③ meets all the conditions, the composite sign of ①②③ will be displayed.
This will allow you to determine where the sign is likely to move in the direction of the sign. (Be careful as it sticks in a strong trend market)
You can also set alerts for this compound sign.
You can also use the signature of RCI3lines on your favorite time axis for profit.
You can also set alerts for profit.
We have made it possible to set one RCI for profit, but I think that there are cases where you want to wait for the compound sign of ①②③ as a swing, so please use it flexibly.
Each sign color can also be changed from the setting screen.
I don't think you need to touch the parameters so much, so if you're not sure, don't mess with them.
You can give a sign by looking at the difference between the moving average and the price.
Deviation is used for deviation.
You can set the type, period, and deviation (σ) of the average line.
MA type (default setting is SMA)
SLOW → SMA
FAST → EMA
period
Please set the period of the average line you like. (Initial setting is 21)
Average line deviation rate
I think that the deviation from 1.5 to 3 is an easy-to-use value. (Initial setting is 2.5)
It's also annoying to get autographs too often, so adjust that.
-*-*-*-*-*-*-*-*-*-*-*-*-*-*-*-*-*-*-*-*-*-*-*-*-*-*-*-*-*-*-*-*-*-*-*-*-*-*-*-*-*-*-*-*-*-*-*-*-*-*-*-*-*-*-*-*-*-*-*-*-*-*-*-*-*-*-*-*-*-*-*-*-*-*-*-*-*-*-*-*-*-*-
このインジケーターはRCIというオシレーターをマルチタイムフレームで複数組み合わせて条件に達した部分にサインを出すというとても単純なものとなっています。
通常のRCIを使うと動作が重すぎて表示がエラーになるなどとても使いにくいのでこのインジケータには[CcYuza]さんが公開して下さったRCIを使用させて頂いております。
多少のズレが生じる場合がございますので、使用する場合は自己責任で宜しくお願いいたします。
同時に平均線乖離のサインを出します。
RCI①・RCI②・RCI③とそれぞれに時間軸や上下の閾値を設定できます。
短期線・中期線・長期線それぞれに異なった閾値を設定する事によってサインの頻度を調整できます。
初期設定は
短期線:上下+-35
中期線:上下+-50
長期戦:上下+-50
となっており、それぞれのRCI3linesの条件でサインを出すことが可能です。
(初期設定では表示はOFFとなっております)
アラートもそれぞれにかけることが可能です。
また、RCI①・②・③それぞれが全ての条件を満たした場合①②③の複合サインを表示します。
これによってそのサインの向きに動く可能性が高い場所を判断することが出来ます。(強いトレンド相場では張り付くので注意)
この複合サインに対してのアラートも設定可能です。
利確用として好きな時間軸のRCI3linesのサインでのサインを使用する事もできます。
こちらもアラートを利確用として設定可能です。
利確用として1つRCIを設定できるようにしてますが、スイングとして①②③の複合サインを待ちたいなどそれぞれあるかとは思いますので、そこは臨機応変にご使用ください。
それぞれのサインカラーも設定画面から変更可能です。
パラメーターに関してはそんなに触る必要は無いと思いますので、良く分からない場合はいじらない方がよいと思います。
移動平均線と価格の乖離具合を見てサインを出すことが出来ます。
乖離には偏差を使用しています。
平均線の種類・期間・偏差(σ)を設定できます。
MAの種類(初期設定はSMA)
SLOW→SMA
FAST→EMA
期間
お好きな平均線の期間を設定してください。(初期設定は21)
平均線乖離率
偏差で1.5~3位までが使いやすい数値かと思います。(初期設定は2.5)
あまり頻繁にサインが出るのも邪魔なのでそこは調整してください。
-*-*-*-*-*-*-*-*-*-*-*-*-*-*-*-*-*-*-*-*-*-*-*-*-*-*-*-*-*-*-*-*-*-*-*-*-*-*-*-*-*-*-*-*-*-*-*-*-*-*-*-*-*-*-*-*-*-*-*-*-*-*-*-*-*-*-*-*-*-*-*-*-*-*-*-*-*-*-*-*-*-*-


RCI+Rank Correlation Index(RCI)
RCI+
It is based on mainstream setting
Shows previous RCI line(blue) and now RCI line(red)
■Buy sign
will buy when it is rising compared to previous RCI and now RCI < 0%
■Sell sign
will buy when it is descending compared to previous RCI and now RCI < 0%


BitMEX AltcoinRCIDominance based RCI for BITMEX Altcoin trade.
It's show Dominnace based RCI.
You can grasp Altcoin strength.

RCI3lines optimized and fixedRank Correlation Index.
Applied jadbrother's fix
Quite faster calculation(almost 30x than RCI3lines)

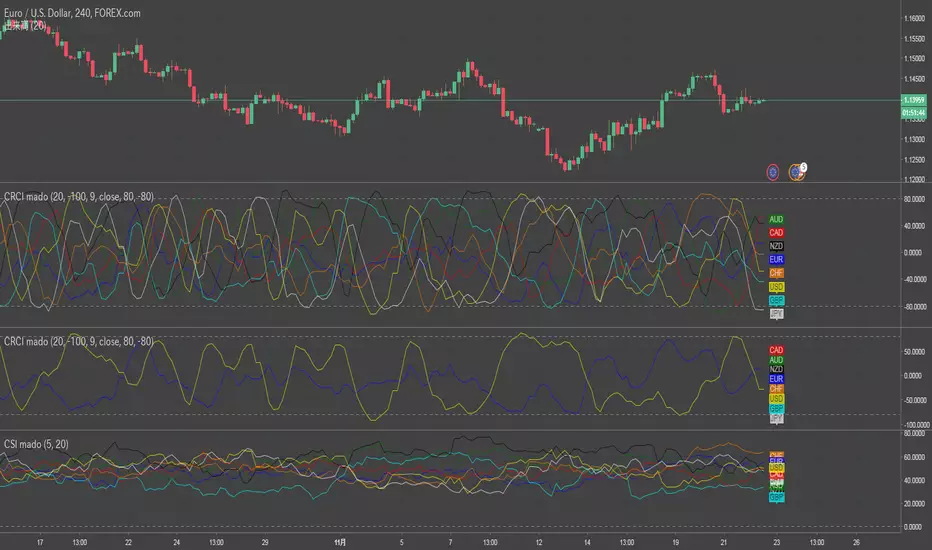
Currency Rank Correlation Index -CRCICurrency Rank Correlation Index based below multi pair RCI average.
compare usd/eur/gbp/aud/jpy/cad/chf/nzd.
Use like Currency Strength Indicator -CSI :)
config label position only.(default 20/-100)
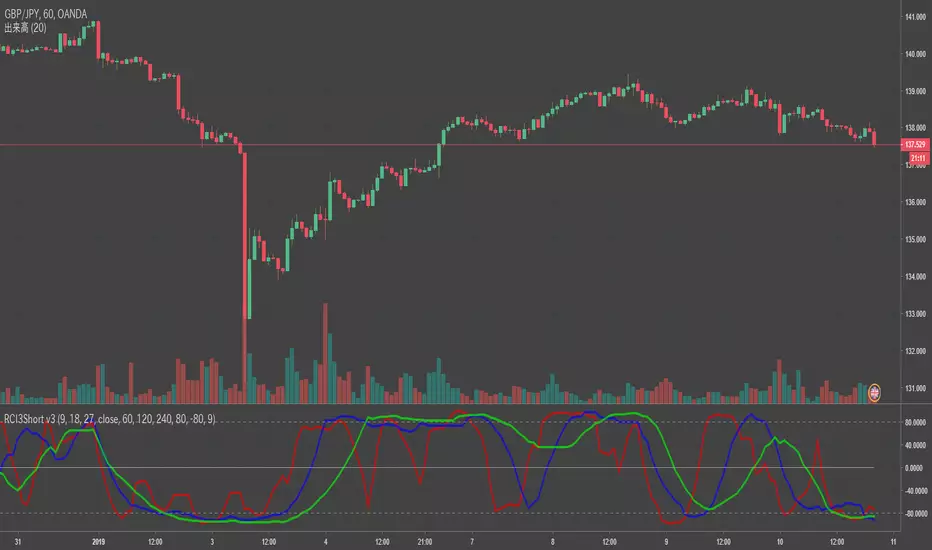
RCI3Short MTFFor RCI lover.
We are facing a timeout problem on smart phone apps of TV.
It looks like a staircase, but It frees us from timeout problems.
default MTF: 60 / 120 / 240
MTF line as middle/long lines
yutas_CCI+RCIS+StochRSI_ver.freever .free
CCI×3
RCI×3
StochRSI cross sign × 1
It can be used as a material to judge the flow by closing CCI , RCI -2.78% and StochRSI.
Three CCIs and three RCIs can be displayed.
With the time axis change function, you can check the flow on one screen.
It is easy to grasp the flow of the whole by watching the eye with one hour's feet etc.
Let's aim at when all directions are complete.
※There will be no upcoming updates as it will be a free public version.
CCIとRCIとStochRSIのクロスで流れを判断する材料に使えます。
CCIとRCIはそれぞれ3本表示可能。
時間軸変更機能により、1画面で流れを確認出来ます。
1時間足等を使って、目を細めて見ると全体の流れを掴みやすいです。
全ての向きが揃った時を狙いましょう。
※無料公開バージョンになりますので今後の更新はない予定です。

yutas_CCI+RCIS+StochRSIver .1.0
CCI×3
RCI×3
StochRSI cross sign × 1
It can be used as a material to judge the flow by closing CCI, RCI and StochRSI.
Three CCIs and three RCIs can be displayed.
With the time axis change function, you can check the flow on one screen.
CCIとRCIとStochRSIのクロスで流れを判断する材料に使えます。
CCIとRCIはそれぞれ3本表示可能。
時間軸変更機能により、1画面で流れを確認出来ます。

RCI for 1-minute chartRCI for 1-minute chart
RCI length 9
3-minute chart based RCI
5-minute chart based RCI
background color => all RCI over 80 / under -80

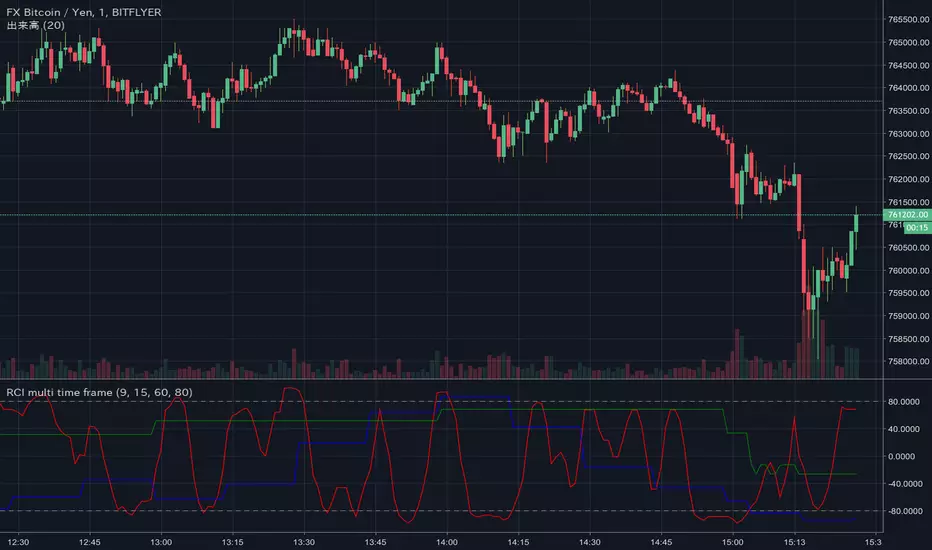
RCI multi time frameRCI multi time frame
RCI default
RCI 2
RCI 3
background color => long sign & short sign
yutas_CCI+StochRSIver.1.5
It can be used as a material to judge the flow with CCI and StochRSI cross.
CCIとStochRSIのクロスで流れを判断する材料に使えます。