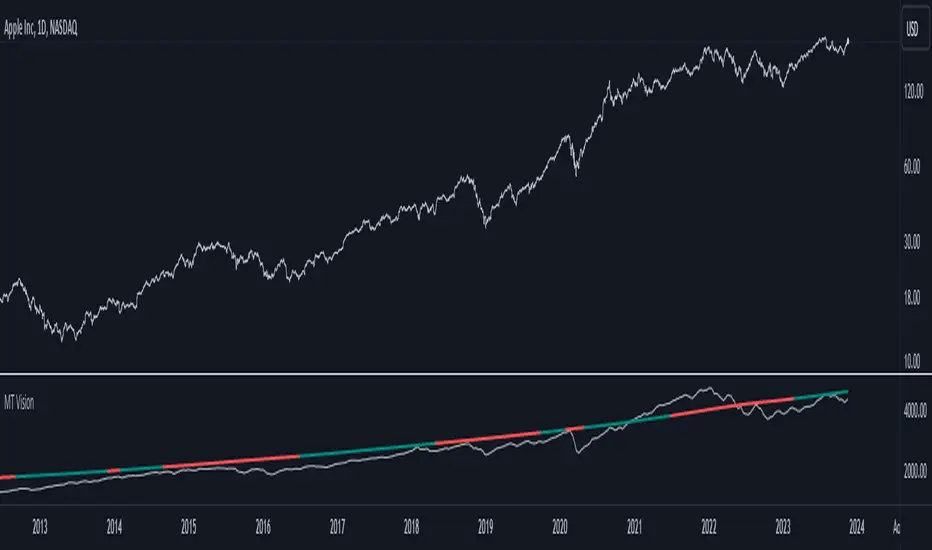
MacroTrend VisionThe "MacroTrend Vision" indicator is crafted with a singular goal – to provide traders with a quick and insightful snapshot of a country's global index. Seamlessly combining macroeconomic and technical perspectives, this tool is designed for those seeking a straightforward yet comprehensive overview. Let's explore the key features that make the "MacroTrend Vision" a valuable asset for traders looking to grasp both the big-picture economic context and technical nuances.
1. Long-Term Vision with Weekly Periods:
Gain a genuine long-term perspective with the ability to process 2500 weekly periods. This feature ensures a holistic understanding of global indices from both macroeconomic and technical viewpoints.
2. Composite Leading Indicator (CLI) Conditions:
Integrate both macroeconomic trends and technical signals through Composite Leading Indicator (CLI) conditions derived from the Relative Strength Index (RSI), offering a comprehensive outlook for informed decision-making.
3. Deviation Bands for Volatility Analysis:
Refine market analysis with strategically integrated deviation bands (0.2 and 0.4) based on smoothed linear regression. Anticipate volatility and potential trend shifts, aligning macro and technical insights.
4. Logarithmic Scale Transformation:
Enhance precision in understanding price movements with a logarithmic scale transformation, especially beneficial for assets with exponential growth patterns.
5. Separated Window for Easy Navigation:
Streamline your analysis with a user-friendly design – a separated window allowing easy navigation through different symbols without altering indicator settings.
6. Alert System for CLI Conditions:
Stay informed about critical shifts with an alert system for both long and close conditions based on the RSI of the CLI. Even during periods of limited chart monitoring, this feature keeps you connected to macroeconomic and technical changes.
In essence, the "MacroTrend Vision" is your go-to tool for a balanced view, simplifying the complexities of global indices with a blend of macroeconomic insights and technical clarity.
Regressions
COSTAR [SS]This idea came to me after I wrote the post about Co-Integration and pair trading. I wondered if you could use pair trading principles as a way to determine overbought and oversold conditions in a more neutral way than RSI or Stochastics.
The results were promising and this indicator resulted :-)!
About:
COSTAR provides another, more neutral way to determine whether an equity is overbought or oversold.
Instead of relying on the traditional oscillator based ways, such as using RSI, Stochastics and MFI, which can be somewhat biased and narrow sided, COSTAR attempts to take a neutral, unbiased approached to determine overbought and oversold conditions. It does this through using a co-integrated partner, or "pair" that is closely linked to the underlying equity and succeeds on both having a high correlation and a high t-statistic on the ADF test. It then references this underlying, co-integrated partner as the "benchmark" for the co-integration relationship.
How this succeeds as being "unbiased" and "neutral" is because it is responsive to underlying drivers. If there is a market catalyst or just general bullish or bearish momentum in the market, the indicator will be referencing the integrated relationship between the two pairs and referencing that as a baseline. If there is a sustained rally on the integrated partner of the underlying ticker that is holding, but the other ticker is lagging, it will indicate that the other ticker is likely to be under-valued and thus "oversold" because it is underperforming its benchmark partner.
This is in contrast to traditional approaches to determining overbought and oversold conditions, which rely completely on a single ticker, with no external reference to other tickers and no control over whether the move could potentially be a fundamental move based on an industry or sector, or whether it is a fluke or a squeeze.
The control for this giving "false" signals comes from its extent of modelling and assessment of the degree of integration of the relationship. The parameters are set by default to assess over a 1 year period, both the correlation and the integration. Anything that passes this degree of integration is likely to have a solid, co-integrated state and not likely to be a "fluke". Thus, the reliability of the assessment is augmented by the degree of statistical significance found within the relationship. The indicator is not going to prompt you to rely on a relationship that is statistically weak, and will warn you of such.
The indicator will show you all the information you require regarding the relationship and whether it is reliable or not, so you do not need to worry!
How to Use
The first step to use COSTAR is identifying which ticker has a strong relationship with the current ticker. In the main chart, you will see that SPY is overlaid with VIX. There is a strong, negative correlation between the VIX and SPY. When VIX is entered as the paired ticker, the indicator returns the data as stationary, indicating a compatible match.
Now you have 3 ways of viewing this relationship, 2 of which are going to be directly applicable to trading.
You can view them as
Price to Price Ratio (Not very useful for trading, but if you are curious)
Z-Score: Helpful for trading
Co-integration: Helpful for trading
Here is an example of all three:
Example of Z-Score Chart:
Example of Price Ratio:
Example of Co-Integration Pair:
Using for Trading
As stated above, the two best ways to use this for trading is to either use the Z-Score Chart or the Co-Integrated Pair chart.
The Z-Score chart is based off of the price ratio data and provides an assessment of both the independent and dependent data.
The co-integration shows the dependent (the ticker you are trading) in yellow and the independent (the ticker you are referencing) in teal. When teal is above yellow, you will see it is green. This means, based on your benchmark pair, there is still more up room and the ticker you are trading is actually lagging behind.
When the yellow crosses up, it will turn red. This means that your ticker is out-performing the benchmark pair and you likely will see pullback and a "regression to the mean" through re-integration.
The indicator is capable of plotting out entries and exits, which are guided by the z-score:
How Effective is it?
I created a basic strategy in Pinescript, and the back-test results vary. Trading ES1! using NQ1! as the co-integrated pair, results were around 78% effective.
With VIX, results were around 50% effective, but with a net profit.
Generally, the efficacy surpassed that of both stochastics and RSI.
I will be releasing the strategy version of this in the coming days, still just cleaning up that code and making it more "public use" friendly.
Other Applications
If you are a pair trader, you can technically use this for pair trading as well. That's essentially all this is doing :-).
Tips
If you are trading a ticker such as MSFT, AMD, KO etc., it's best to try to find an ETF or index that has that particular ticker as a large holding and use that as your benchmark. You will see on the indicator whether there is a high correlation and whether the data is indeed stationary.
If the indicator returns "Non-stationary", you can attempt to extend your regression range from 252 to 500. If this fixes the issue, ensure that the correlation is still >= 0.5 or <= -0.5. If this does not work still, you will need to find another pair, as its likely the result of incompatibility and an insignificant relationship.
To help you identify tickers with strong relationships, consider using a correlation heatmap indicator. I have one available and I think there are a couple of other similar ish ones out there. You want to make sure the relationship is stable over time (a correlation of >= 0.50 or <= -0.5 over the past 252 to 500 days).
IMPORTANT: The long and short exits delete the signal after one is signaled. Therefore, when you look back in the chart you will notice there are no signals to exit long or short. That is because they signal as they happen. This is to keep the chart clean.
'Tis all my friends!
Hope you enjoy and let me know your questions and suggestions below!
Side note:
COSTAR stands for Co-integration Statistical Analysis and Regression. ;)

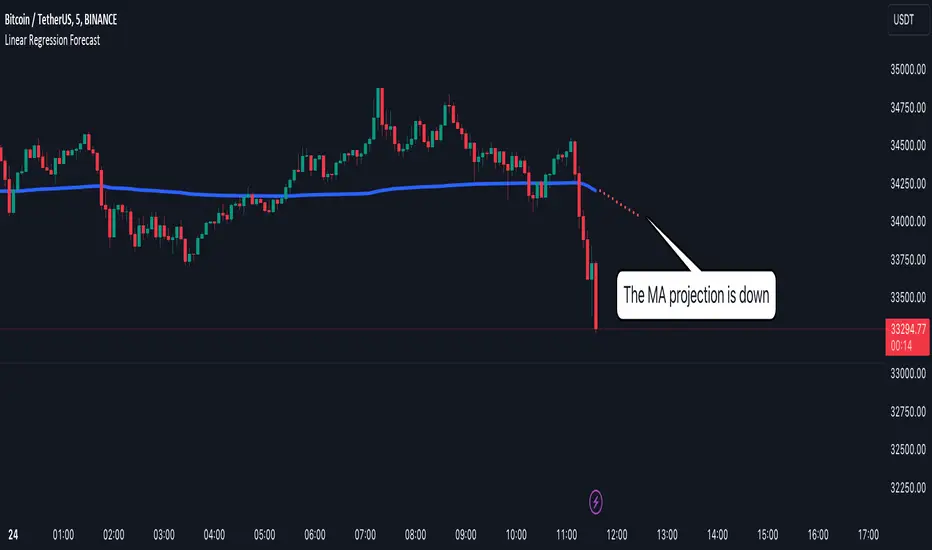
Linear Regression Forecast Tool [Daveatt]Hello traders,
Navigating through the financial markets requires a blend of analysis, insight, and a touch of foresight.
My Linear Regression Forecast Tool is here to add that touch of foresight to your analysis toolkit on TradingView!
Linear Regression is the heart of this tool, a statistical method that explores the relationship between a dependent variable and one (or more) independent variable(s).
In simpler terms, it finds a straight line that best fits a set of data points.
This "line of best fit" then becomes a visual representation of the relationship in the data, providing a basis for making predictions.
Here's what the Linear Regression Forecast Tool brings to your trading table:
Multiple Indicator Choices: Select from various market indicators like Simple Moving Averages, Bollinger Bands, or the Volume Weighted Average Price as the basis for your linear regression analysis.
Customizable Forecast Periods: Define how many periods ahead you want to forecast, adjusting to your analysis needs, whether that's looking 5, 7, or 10 periods into the future.
On-Chart Forecast Points: The tool plots the forecasted points on your chart, providing a straightforward visual representation of potential future values based on past data.
In this script:
1. We first calculate the indicator using the specified period.
2. We then use the ta.linreg function to calculate a linear regression curve fitted to the indicator over the last Period bars.
3. We calculate the slope of the linear regression curve using the last two points on the curve.
We use this slope to extrapolate the linear regression curve to forecast the next X points of the indicator.
4/ Finally, we use the plot function to plot the original indicator and the forecasted points on the chart, using the offset parameter to shift the forecasted points to the right (into the future).
This method assumes that the trend represented by the linear regression curve will continue, which may not always be the case, especially in volatile or changing market conditions.
Examples:
Works with a moving average
Works with a Bollinger band
The code can be adapted to work with any other indicator (imagine RSI, MACD, other Moving Average Type, PSAR, Supertrend, etc...)
Conclusion
The Linear Regression Forecast Tool doesn't promise to tell the future but provides a structured way to visualize possible future price trends based on historical data. I
Remember, no tool can predict market conditions with certainty.
It's always advisable to corroborate findings with other analysis methods and stay updated with market news and events.
Happy trading!
Optimal Moving Average (AI/ML) [wbburgin]Some traders swear by the 200-period moving average. Others, by the 100-period. Others, the 14-period. It depends on your asset, your timeframe, the trend…
The fact of the matter is that no moving average will ever be a consistent indicator for a serious trader - a fixed-length moving average will always need confirmation indicators and tests. When your instrument is trending, you need a faster moving average to better fit the data; when your instrument is ranging, you need a slower moving average that cleans the data. This just is not possible given the way the moving average is traditionally coded, which makes it a lagging indicator.
Thus we need a moving average that:
can project the next prices, and
can change its length depending on what best fits these future prices.
The Optimal Moving Average selects the optimal moving average length for a projected future price. The algorithm classifies moving averages by their effectiveness in predicting future price movement. If a moving average of length n has historically been accurate in predicting the next bar, the moving average will be tested compared to its peers ( n -1, n +5, n -100, etc.) and promoted or demoted depending on its effectiveness. This means that the indicator will not have a length input like other static moving averages or machine-learning moving averages on TradingView- it will select the ideal length for your chart from the average that has the least error and best prediction.
Advantages over other ML Moving Averages on TradingView
The vast majority of AI/ML moving average algorithms classify their moving averages only by if the average is above or below the current price.
This approach is inherently flawed because the model
Is not predictive of future prices (the structural lagging problem still exists),
Is not built on a variable-length MA (cannot select alternating lengths depending on the bar), and
does not classify the scale of difference between the MA and the price.
This indicator solves all those problems. It classifies moving averages by the scale of which their rate predicts the next price. Thus it is quick to catch trend changes but also acts as support or resistance, and models the projected price more accurately than a traditional moving average.
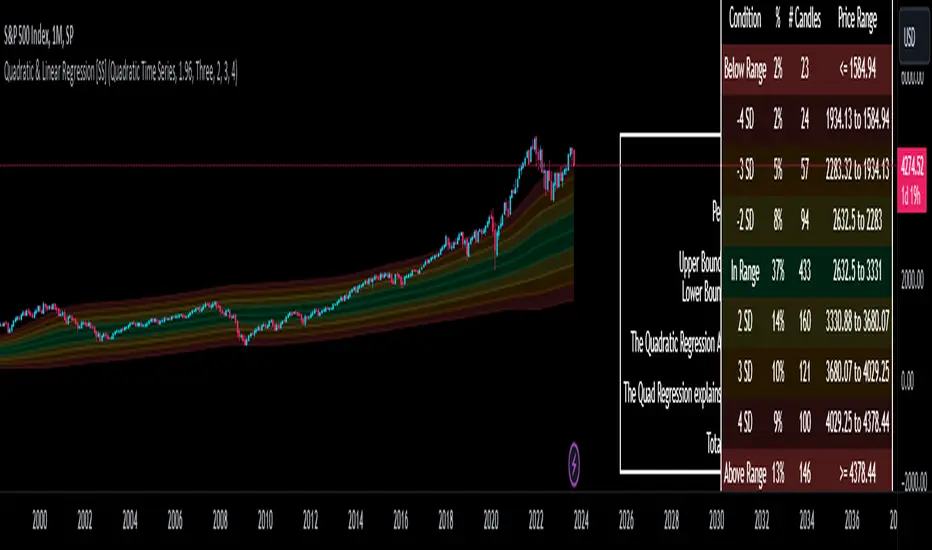
Quadratic & Linear Time Series Regression [SS]Hey everyone,
Releasing the Quadratic/Linear Time Series regression indicator.
About the indicator:
Most of you will be familiar with the conventional linear regression trend boxes (see below):
This is an awesome feature in Tradingview and there are quite a few indicators that follow this same principle.
However, because of the exponential and cyclical nature of stocks, linear regression tends to not be the best fit for stock time series data. From my experience, stocks tend to fit better with quadratic (or curvlinear) regression, which there really isn't a lot of resources for.
To put it into perspective, let's take SPX on the 1 month timeframe and plot a linear regression trend from 1930 till now:
You can see that its not really a great fit because of the exponential growth that SPX has endured since the 1930s. However, if we take a quadratic approach to the time series data, this is what we get:
This is a quadratic time series version, extended by up to 3 standard deviations. You can see that it is a bit more fitting.
Quadratic regression can also be helpful for looking at cycle patterns. For example, if we wanted to plot out how the S&P has performed from its COVID crash till now, this is how it would look using a linear regression approach:
But this is how it would look using the quadratic approach:
So which is better?
Both linear regression and quadratic regression are pivotal and important tools for traders. Sometimes, linear regression is more appropriate and others quadratic regression is more appropriate.
In general, if you are long dating your analysis and you want to see the trajectory of a ticker further back (over the course of say, 10 or 15 years), quadratic regression is likely going to be better for most stocks.
If you are looking for short term trades and short term trend assessments, linear regression is going to be the most appropriate.
The indicator will do both and it will fit the linear regression model to the data, which is different from other linreg indicators. Most will only find the start of the strongest trend and draw from there, this will fit the model to whatever period of time you wish, it just may not be that significant.
But, to keep it easy, the indicator will actually tell you which model will work better for the data you are selecting. You can see it in the example in the main chart, and here:
Here we see that the indicator indicates a better fit on the quadratic model.
And SPY during its recent uptrend:
For that, let's take a look at the Quadratic Vs the Linear, to see how they compare:
Quadratic:
Linear:
Functions:
You will see that you have 2 optional tables. The statistics table which shows you:
The R Squared to assess for Variance.
The Correlation to assess for the strength of the trend.
The Confidence interval which is set at a default of 1.96 but can be toggled to adjust for the confidence reading in the settings menu. (The confidence interval gives us a range of values that is likely to contain the true value of the coefficient with a certain level of confidence).
The strongest relationship (quadratic or linear).
Then there is the range table, which shows you the anticipated price ranges based on the distance in standard deviations from the mean.
The range table will also display to you how often a ticker has spent in each corresponding range, whether that be within the anticipated range, within 1 SD, 2 SD or 3 SD.
You can select up to 3 additional standard deviations to plot on the chart and you can manually select the 3 standard deviations you want to plot. Whether that be 1, 2, 3, or 1.5, 2.5 or 3.5, or any combination, you just enter the standard deviations in the settings menu and the indicator will adjust the price targets and plotted bands according to your preferences. It will also count the amount of time the ticker spent in that range based on your own selected standard deviation inputs.
Tips on Use:
This works best on the larger timeframes (1 hour and up), with RTH enabled.
The max lookback is 5,000 candles.
If you want to ascertain a longer term trend (over years to months), its best to adjust your chart timeframe to the weekly and/or monthly perspective.
And that's the indicator! Hopefully you all find it helpful.
Let me know your questions and suggestions below!
Safe trades to all!
Relational Quadratic Kernel Channel [Vin]The Relational Quadratic Kernel Channel (RQK-Channel-V) is designed to provide more valuable potential price extremes or continuation points in the price trend.
Example:
Usage:
Lookback Window: Adjust the "Lookback Window" parameter to control the number of previous bars considered when calculating the Rational Quadratic Estimate. Longer windows capture longer-term trends, while shorter windows respond more quickly to price changes.
Relative Weight: The "Relative Weight" parameter allows you to control the importance of each data point in the calculation. Higher values emphasize recent data, while lower values give more weight to historical data.
Source: Choose the data source (e.g., close price) that you want to use for the kernel estimate.
ATR Length: Set the length of the Average True Range (ATR) used for channel width calculation. A longer ATR length results in wider channels, while a shorter length leads to narrower channels.
Channel Multipliers: Adjust the "Channel Multiplier" parameters to control the width of the channels. Higher multipliers result in wider channels, while lower multipliers produce narrower channels. The indicator provides three sets of channels, each with its own multiplier for flexibility.
Details:
Rational Quadratic Kernel Function:
The Rational Quadratic Kernel Function is a type of smoothing function used to estimate a continuous curve or line from discrete data points. It is often used in time series analysis to reduce noise and emphasize trends or patterns in the data.
The formula for the Rational Quadratic Kernel Function is generally defined as:
K(x) = (1 + (x^2) / (2 * α * β))^(-α)
Where:
x represents the distance or difference between data points.
α and β are parameters that control the shape of the kernel. These parameters can be adjusted to control the smoothness or flexibility of the kernel function.
In the context of this indicator, the Rational Quadratic Kernel Function is applied to a specified source (e.g., close prices) over a defined lookback window. It calculates a smoothed estimate of the source data, which is then used to determine the central value of the channels. The kernel function allows the indicator to adapt to different market conditions and reduce noise in the data.
The specific parameters (length and relativeWeight) in your indicator allows to fine-tune how the Rational Quadratic Kernel Function is applied, providing flexibility in capturing both short-term and long-term trends in the data.
To know more about unsupervised ML implementations, I highly recommend to follow the users, @jdehorty and @LuxAlgo
Optimizing the parameters:
Lookback Window (length): The lookback window determines how many previous bars are considered when calculating the kernel estimate.
For shorter-term trading strategies, you may want to use a shorter lookback window (e.g., 5-10).
For longer-term trading or investing, consider a longer lookback window (e.g., 20-50).
Relative Weight (relativeWeight): This parameter controls the importance of each data point in the calculation.
A higher relative weight (e.g., 2 or 3) emphasizes recent data, which can be suitable for trend-following strategies.
A lower relative weight (e.g., 1) gives more equal importance to historical and recent data, which may be useful for strategies that aim to capture both short-term and long-term trends.
ATR Length (atrLength): The length of the Average True Range (ATR) affects the width of the channels.
Longer ATR lengths result in wider channels, which may be suitable for capturing broader price movements.
Shorter ATR lengths result in narrower channels, which can be helpful for identifying smaller price swings.
Channel Multipliers (channelMultiplier1, channelMultiplier2, channelMultiplier3): These parameters determine the width of the channels relative to the ATR.
Adjust these multipliers based on your risk tolerance and desired channel width.
Higher multipliers result in wider channels, which may lead to fewer signals but potentially larger price movements.
Lower multipliers create narrower channels, which can result in more frequent signals but potentially smaller price movements.

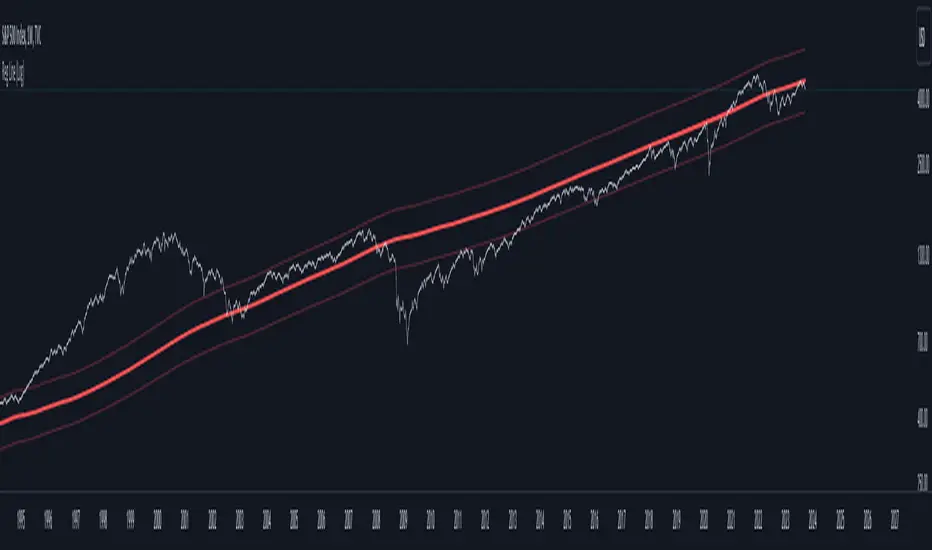
Regression Line (Log)This indicator is based on the "Linear Regression Channel (Log)," which, in turn, is derived from TradingView's "Linear Regression Channel."
The "Regression Line (Log)" indicator is a valuable tool for traders and investors seeking to gain insights into long-term market trends. This indicator is personally favored for its ability to provide a comprehensive view of price movements over extended periods. It offers a unique perspective compared to traditional linear regression lines and moving averages, making it a valuable addition to the toolkit of experienced traders and investors.
Indicator Parameters:
Before delving into the details, it's worth noting that the chosen number of periods (2870) is a personal preference. This specific value is utilized for the S&P 500 index due to its alignment with various theories regarding the beginning of the modern economic era in the stock market. Different analysts propose different starting points, such as the 1950s, 1970s, or 1980s. However, users are encouraged to adjust this parameter to suit their specific needs and trading strategies.
How It Works:
The "Regression Line (Log)" indicator operates by transforming the closing price data into a logarithmic scale. This transformation can make the linear regression more suitable for data with exponential trends or rapid growth. Here's a breakdown of its functioning and why it can be advantageous for long-term trend analysis:
1. Logarithmic Transformation : The indicator begins by applying a logarithmic transformation to the closing price. This transformation helps capture price movements proportionally, making it especially useful for assets that exhibit exponential or rapid growth. This transformation can render linear regression more suitable for data with exponential or fast-paced trends.
2. Linear Regression on Log Scale : After the logarithmic transformation, the indicator calculates a linear regression line (lrc) on this log-transformed data. This step provides a smoother representation of long-term trends compared to a linear regression line on a linear scale.
3. Exponential Reversion : To present the results in a more familiar format, the indicator reverts the log-transformed regression line back to a linear scale using the math.exp function. This final output is the "Linear Regression Curve," which can be easily interpreted on standard price charts.
Advantages:
- Long-Term Trend Clarity : The logarithmic scale better highlights long-term trends and exponential price movements, making it a valuable tool for investors seeking to identify extended trends.
- Smoothing Effect : The logarithmic transformation and linear regression on a log scale smooth out price data, reducing noise and providing a clearer view of underlying trends.
- Adaptability : The indicator allows traders and investors to customize the number of periods (length) to align with their preferred historical perspective or trading strategy.
- Complementary to Other Tools : While not meant to replace other technical indicators, the "Regression Line (Log)" indicator complements traditional linear regression lines and moving averages, offering an alternative perspective for more comprehensive analysis.
Conclusion:
In summary, the "Regression Line (Log)" indicator is a versatile tool that can enhance your ability to analyze long-term market trends. Its logarithmic transformation provides a unique perspective on price data, particularly suited for assets with exponential growth patterns. While the choice of the number of periods is a personal one, it can be adapted to fit various historical viewpoints. This indicator is best utilized as part of a well-rounded trading strategy, in conjunction with other technical tools, to aid in informed decision-making.
Ticker Correlation Matrix Table and Heatmap [SS]Hello everyone,
I am in the process of releasing some of my own utility indicators/things I use to reference and perform analyses.
I do a lot of quantitative/math based analyses, including correlation assessments that I traditionally would need to export data from Tradingview and perform in SPSS, Excel or R. I have been slowly building a repertoire of Excel/R functionality right on pinescript so I do not need to constantly export data and can perform the assessments right on Tradingview.
This is an example of such an indicator.
About the Indicator:
It is a correlation table/matrix indicator. It will allow up to 10 ticker inputs, which can be stocks, economic data, anything available on Tradingview, and it will perform a correlation assessment in a matrix / heatmap style.
The indicator will show the various correlations among all of the selected ticker inputs and will colour them based on correlation strength and type.
Strong negative correlations will appear bright red.
Strong positive correlations will appear bright green.
Complete absence of correlation (i.e. 0) will show bright orange.
The rest will show a darker shade to indicate less strength/correlation.
Calculation Functions
In addition to outputting a correlation matrix, the indicator is also able to express the relationship between tickers in a linear expression using the y = mx + b formula.
If we look at table, we can see that MSFT and AAPL have a significantly strong correlation of 0.82.
If we wanted to express this relationship mathmatically, we can ask the indicator to represent the linear relationship in our y = mx + b format. We simply toggle to our menu and select the Convert From MSFT (Ticker 2) and convert to APPL (Ticker 3):
When we select this, a new table will populate below and give you the expression as well as the amount of error associated with it:
In this case, we can see that the equation is y = 0.553x + 0.626 with a range of around 10 points in either direction.
This means that, to convert MSFT to AAPL, we would multiply the MSFT price by 0.553 and then add 0.626. So if we try it, MSFT closed at 328.41. So we substitute:
AAPL price = 0.553(328.41) + 0.626
AAPL price = 181.61 + 0.626
AAPL Price = 182.24 +/- 10
AAPL actually closed at 184.12. So pretty good. If we try another, let's do SPY to XLF:
So we substitute, SPY closed at 449.16.
XLF Price = 449.16(0.077) + 0.084
XLF price = 34.59 + 0.084
XLF price = 34.67
XLF actually closed at 34.49.
This is handy if you want to see how one stock price may affect another. If you are long on one stock and short on another, you can use this to determine what the likely outcome may be for the alternative stock. However, I recommend only performing this on tickers that have a relationship of 0.7 or higher, or a relationship of -0.7 or lower.
I always had to use SPSS to do this, so being able to do this right in Pinescript for me is a huge convenience!
Some other uses:
As I tend to post educational stuff on Tradingview and I frequently use correlation matrices, I have formatted the indicator to be more aesthetically pleasing for these purposes. Thus, you can unselect extra ticker slots that you do not need. IF I only need to display 3 tickers, I can unselect tickers 4 - 10. The end result is a cleaner table:
Essential Functions:
The assessment length is defaulted to 75 candles on the daily timeframe. Be sure to have the daily timeframe opened when you are viewing the indicator.
You can increase or decrease the assessment length as you desire.
You can also specify the source. The source is defaulted to close, but if you want to see the direct correlation of ticker's highs and/or lows, you can modify the source input in the settings menu to look at this.
Just remember to have the chart opened to whatever timeframe you are looking at.
And that's the indicator! Hopefully you find it helpful. Its more of an academic indicator, but it is performing a function that I personally use frequently in analyses, so I hope you may also benefit from it as well!
Thanks for checking it out! Safe trades everyone!

Advanced Weighted Residual Arbitrage AnalyzerThe Advanced Weighted Residual Arbitrage Analyzer is a sophisticated tool designed for traders aiming to exploit price deviations between various asset pairs. By examining the differences in normalized price relations and their weighted residuals, this indicator provides insights into potential arbitrage opportunities in the market.
Key Features:
Multiple Relation Analysis: Analyze up to five different asset relations simultaneously, offering a comprehensive view of potential arbitrage setups.
Normalization Functions: Choose from a variety of normalization techniques like SMA, EMA, WMA, and HMA to ensure accurate comparisons between different price series.
Dynamic Weighting: Residuals are weighted based on their correlation, ensuring that stronger correlations have a more pronounced impact on the analysis. Weighting can be adjusted using several functions including square, sigmoid, and logistic.
Regression Flexibility: Incorporate linear, polynomial, or robust regression to calculate residuals, tailoring the analysis to different market conditions.
Customizable Display: Decide which plots to display for clarity and focus, including normalized relations, weighted residuals, and the difference between the screen relation and the average weighted residual.
Usage Guidelines:
Configure the asset pairs you wish to analyze using the Symbol Relations group in the settings.
Adjust the normalization, volatility, regression, and weighting functions based on your preference and the specific characteristics of the asset pairs.
Monitor the weighted residuals for deviations from the mean. Larger deviations suggest stronger arbitrage opportunities.
Use the difference plot (between the screen relation and average weighted residual) as a quick visual cue for potential trade setups. When this plot deviates significantly from zero, it indicates a possible arbitrage opportunity.
Regularly update and adjust the parameters to account for changing market conditions and ensure the most accurate analysis.
In the Advanced Weighted Residual Arbitrage Analyzer , the value set in Alert Threshold plays a crucial role in delineating a normalized band. This band serves as a guide to identify significant deviations and potential trading opportunities.
When we observe the plots of the green line and the purple line, the Alert Threshold provides a boundary for these plots. The following points explain the significance:
Breach of the Band: When either the green or purple line crosses above or below the Alert Threshold , it indicates a significant deviation from the mean. This breach can be interpreted as a potential trading signal, suggesting a possible arbitrage opportunity.
Convergence to the Mean: If the green line converges with the purple line , it denotes that the price relation has reverted to its mean. This convergence typically suggests that the arbitrage opportunity has been exhausted, and the market dynamics are returning to equilibrium.
Trade Execution: A trader can consider entering a trade when the lines breach the Alert Threshold . The return of the green line to align closely with the purple line can be seen as a signal to exit the trade, capitalizing on the reversion to the mean.
By monitoring these plots in conjunction with the Alert Threshold , traders can gain insights into market imbalances and exploit potential arbitrage opportunities. The convergence and divergence of these lines, relative to the normalized band, serve as valuable visual cues for trade initiation and termination.
When you're analyzing relations between two symbols (for instance, BINANCE:SANDUSDT/BINANCE:NEARUSDT ), you're essentially looking at the price relationship between the two underlying assets. This relationship provides insights into potential imbalances between the assets, which arbitrage traders can exploit.
Breach of the Lower Band: If the purple line touches or crosses below the lower Alert Threshold , it indicates that the first symbol (in our example, SANDUSDT ) is undervalued relative to the second symbol ( NEARUSDT ). In practical terms:
Action: You would consider buying the first symbol ( SANDUSDT ) and selling the second symbol ( NEARUSDT ).
Rationale: The expectation is that the price of the first symbol will rise, or the price of the second symbol will fall, or both, thereby converging back to their historical mean relationship.
Breach of the Upper Band: Conversely, if the difference plot touches or crosses above the upper Alert Threshold , it suggests that the first symbol is overvalued compared to the second. This implies:
Action: You'd consider selling the first symbol ( SANDUSDT ) and buying the second symbol ( NEARUSDT ).
Rationale: The anticipation here is that the price of the first symbol will decrease, or the price of the second will increase, or both, bringing the relationship back to its historical average.
Convergence to the Mean: As mentioned earlier, when the green line aligns closely with the purple line, it's an indication that the assets have returned to their typical price relationship. This serves as a signal for traders to consider closing out their positions, locking in the gains from the arbitrage opportunity.
It's important to note that when you're trading based on symbol relations, you're essentially betting on the relative performance of the two assets. This strategy, often referred to as "pairs trading," seeks to capitalize on price imbalances between related financial instruments. By taking opposing positions in the two symbols, traders aim to profit from the eventual reversion of the price difference to the mean.

Machine Learning Regression Trend [LuxAlgo]The Machine Learning Regression Trend tool uses random sample consensus (RANSAC) to fit and extrapolate a linear model by discarding potential outliers, resulting in a more robust fit.
🔶 USAGE
The proposed tool can be used like a regular linear regression, providing support/resistance as well as forecasting an estimated underlying trend.
Using RANSAC allows filtering out outliers from the input data of our final fit, by outliers we are referring to values deviating from the underlying trend whose influence on a fitted model is undesired. For financial prices and under the assumptions of segmented linear trends, these outliers can be caused by volatile moves and/or periodic variations within an underlying trend.
Adjusting the "Allowed Error" numerical setting will determine how sensitive the model is to outliers, with higher values returning a more sensitive model. The blue margin displayed shows the allowed error area.
The number of outliers in the calculation window (represented by red dots) can also be indicative of the amount of noise added to an underlying linear trend in the price, with more outliers suggesting more noise.
Compared to a regular linear regression which does not discriminate against any point in the calculation window, we see that the model using RANSAC is more conservative, giving more importance to detecting a higher number of inliners.
🔶 DETAILS
RANSAC is a general approach to fitting more robust models in the presence of outliers in a dataset and as such does not limit itself to a linear regression model.
This iterative approach can be summarized as follow for the case of our script:
Step 1: Obtain a subset of our dataset by randomly selecting 2 unique samples
Step 2: Fit a linear regression to our subset
Step 3: Get the error between the value within our dataset and the fitted model at time t , if the absolute error is lower than our tolerance threshold then that value is an inlier
Step 4: If the amount of detected inliers is greater than a user-set amount save the model
Repeat steps 1 to 4 until the set number of iterations is reached and use the model that maximizes the number of inliers
🔶 SETTINGS
Length: Calculation window of the linear regression.
Width: Linear regression channel width.
Source: Input data for the linear regression calculation.
🔹 RANSAC
Minimum Inliers: Minimum number of inliers required to return an appropriate model.
Allowed Error: Determine the tolerance threshold used to detect potential inliers. "Auto" will automatically determine the tolerance threshold and will allow the user to multiply it through the numerical input setting at the side. "Fixed" will use the user-set value as the tolerance threshold.
Maximum Iterations Steps: Maximum number of allowed iterations.

AI Moving Average (Expo)█ Overview
The AI Moving Average indicator is a trading tool that uses an AI-based K-nearest neighbors (KNN) algorithm to analyze and interpret patterns in price data. It combines the logic of a traditional moving average with artificial intelligence, creating an adaptive and robust indicator that can identify strong trends and key market levels.
█ How It Works
The algorithm collects data points and applies a KNN-weighted approach to classify price movement as either bullish or bearish. For each data point, the algorithm checks if the price is above or below the calculated moving average. If the price is above the moving average, it's labeled as bullish (1), and if it's below, it's labeled as bearish (0). The K-Nearest Neighbors (KNN) is an instance-based learning algorithm used in classification and regression tasks. It works on a principle of voting, where a new data point is classified based on the majority label of its 'k' nearest neighbors.
The algorithm's use of a KNN-weighted approach adds a layer of intelligence to the traditional moving average analysis. By considering not just the price relative to a moving average but also taking into account the relationships and similarities between different data points, it offers a nuanced and robust classification of price movements.
This combination of data collection, labeling, and KNN-weighted classification turns the AI Moving Average (Expo) Indicator into a dynamic tool that can adapt to changing market conditions, making it suitable for various trading strategies and market environments.
█ How to Use
Dynamic Trend Recognition
The color-coded moving average line helps traders quickly identify market trends. Green represents bullish, red for bearish, and blue for neutrality.
Trend Strength
By adjusting certain settings within the AI Moving Average (Expo) Indicator, such as using a higher 'k' value and increasing the number of data points, traders can gain real-time insights into strong trends. A higher 'k' value makes the prediction model more resilient to noise, emphasizing pronounced trends, while more data points provide a comprehensive view of the market direction. Together, these adjustments enable the indicator to display only robust trends on the chart, allowing traders to focus exclusively on significant market movements and strong trends.
Key SR Levels
Traders can utilize the indicator to identify key support and resistance levels that are derived from the prevailing trend movement. The derived support and resistance levels are not just based on historical data but are dynamically adjusted with the current trend, making them highly responsive to market changes.
█ Settings
k (Neighbors): Number of neighbors in the KNN algorithm. Increasing 'k' makes predictions more resilient to noise but may decrease sensitivity to local variations.
n (DataPoints): Number of data points considered in AI analysis. This affects how the AI interprets patterns in the price data.
maType (Select MA): Type of moving average applied. Options allow for different smoothing techniques to emphasize or dampen aspects of price movement.
length: Length of the moving average. A greater length creates a smoother curve but might lag recent price changes.
dataToClassify: Source data for classifying price as bullish or bearish. It can be adjusted to consider different aspects of price information
dataForMovingAverage: Source data for calculating the moving average. Different selections may emphasize different aspects of price movement.
-----------------
Disclaimer
The information contained in my Scripts/Indicators/Ideas/Algos/Systems does not constitute financial advice or a solicitation to buy or sell any securities of any type. I will not accept liability for any loss or damage, including without limitation any loss of profit, which may arise directly or indirectly from the use of or reliance on such information.
All investments involve risk, and the past performance of a security, industry, sector, market, financial product, trading strategy, backtest, or individual's trading does not guarantee future results or returns. Investors are fully responsible for any investment decisions they make. Such decisions should be based solely on an evaluation of their financial circumstances, investment objectives, risk tolerance, and liquidity needs.
My Scripts/Indicators/Ideas/Algos/Systems are only for educational purposes!

Linear On MACDUnlocking the Magic of Linear Regression in TradingView
In the ever-evolving world of financial markets, traders and investors seek effective tools to gauge price movements, make informed decisions, and achieve their financial goals. One such tool that has proven its worth over time is linear regression, a mathematical concept that has found its way into technical analysis and trading strategies. In this blog post, we will explore the magic behind linear regression, delve into its history, and understand how it's widely used as a technical indicator.
The Birth of Linear Regression: From Mathematics to Trading
Linear regression is a statistical method that aims to model the relationship between two variables by fitting a linear equation to observed data. The formula for a linear regression line is typically expressed as y = a + bx, where y is the dependent variable, x is the independent variable, a is the intercept, and b is the slope.
While the roots of linear regression trace back to the field of statistics, it didn't take long for traders and investors to recognize its potential in the financial world. By applying linear regression to historical price data, traders can identify trends, assess the relationship between variables, and even predict potential future price levels.
The Linear On MACD Strategy
Let's take a closer look at a powerful example of how linear regression is employed in a trading strategy right within TradingView. The "Linear On MACD" strategy harnesses the potential of linear regression in conjunction with the Moving Average Convergence Divergence (MACD) indicator. The goal of this strategy is to generate buy and sell signals based on the interactions between the predicted stock price and the MACD indicator.
Here's a breakdown of the strategy's components:
Calculation of Linear Regression: The strategy begins by calculating linear regression coefficients for the historical stock price based on volume. This helps predict potential future price levels.
Predicted Stock Price: The linear regression results are then used to plot the predicted stock price on the chart. This provides a visual representation of where the price could trend based on historical data.
Buy and Sell Signals: The strategy generates buy signals when certain conditions are met. These conditions include the predicted stock price being between the open and close prices, a rising MACD, and other factors that suggest a potential bullish trend. On the other hand, sell signals are generated based on MACD trends and predicted price levels.
Risk Management: The strategy also incorporates risk tolerance levels to determine entry and exit points. This ensures that traders take into account their risk appetite when making trading decisions.
Embracing the Magic of Linear Regression
As we explore the "Linear On MACD" strategy, we uncover the power of linear regression in aiding traders and investors. Linear regression, a mathematical marvel, seamlessly merges with technical analysis to provide insights into potential price movements. Its historical significance in statistics blends perfectly with the demands of modern financial markets.
Whether you're a seasoned trader or a curious investor, the Linear On MACD strategy exemplifies how a robust mathematical concept can be harnessed to make informed trading decisions. By embracing the magic of linear regression, you're tapping into a tool that continues to evolve alongside the financial world it empowers.
Disclaimer: The information provided in this blog post is for educational purposes only and does not constitute financial advice. Trading and investing carry risks, and it's important to conduct thorough research and consider seeking professional advice before making any trading decisions.
AI Trend Navigator [K-Neighbor]█ Overview
In the evolving landscape of trading and investment, the demand for sophisticated and reliable tools is ever-growing. The AI Trend Navigator is an indicator designed to meet this demand, providing valuable insights into market trends and potential future price movements. The AI Trend Navigator indicator is designed to predict market trends using the k-Nearest Neighbors (KNN) classifier.
By intelligently analyzing recent price actions and emphasizing similar values, it helps traders to navigate complex market conditions with confidence. It provides an advanced way to analyze trends, offering potentially more accurate predictions compared to simpler trend-following methods.
█ Calculations
KNN Moving Average Calculation: The core of the algorithm is a KNN Moving Average that computes the mean of the 'k' closest values to a target within a specified window size. It does this by iterating through the window, calculating the absolute differences between the target and each value, and then finding the mean of the closest values. The target and value are selected based on user preferences (e.g., using the VWAP or Volatility as a target).
KNN Classifier Function: This function applies the k-nearest neighbor algorithm to classify the price action into positive, negative, or neutral trends. It looks at the nearest 'k' bars, calculates the Euclidean distance between them, and categorizes them based on the relative movement. It then returns the prediction based on the highest count of positive, negative, or neutral categories.
█ How to use
Traders can use this indicator to identify potential trend directions in different markets.
Spotting Trends: Traders can use the KNN Moving Average to identify the underlying trend of an asset. By focusing on the k closest values, this component of the indicator offers a clearer view of the trend direction, filtering out market noise.
Trend Confirmation: The KNN Classifier component can confirm existing trends by predicting the future price direction. By aligning predictions with current trends, traders can gain more confidence in their trading decisions.
█ Settings
PriceValue: This determines the type of price input used for distance calculation in the KNN algorithm.
hl2: Uses the average of the high and low prices.
VWAP: Uses the Volume Weighted Average Price.
VWAP: Uses the Volume Weighted Average Price.
Effect: Changing this input will modify the reference values used in the KNN classification, potentially altering the predictions.
TargetValue: This sets the target variable that the KNN classification will attempt to predict.
Price Action: Uses the moving average of the closing price.
VWAP: Uses the Volume Weighted Average Price.
Volatility: Uses the Average True Range (ATR).
Effect: Selecting different targets will affect what the KNN is trying to predict, altering the nature and intent of the predictions.
Number of Closest Values: Defines how many closest values will be considered when calculating the mean for the KNN Moving Average.
Effect: Increasing this value makes the algorithm consider more nearest neighbors, smoothing the indicator and potentially making it less reactive. Decreasing this value may make the indicator more sensitive but possibly more prone to noise.
Neighbors: This sets the number of neighbors that will be considered for the KNN Classifier part of the algorithm.
Effect: Adjusting the number of neighbors affects the sensitivity and smoothness of the KNN classifier.
Smoothing Period: Defines the smoothing period for the moving average used in the KNN classifier.
Effect: Increasing this value would make the KNN Moving Average smoother, potentially reducing noise. Decreasing it would make the indicator more reactive but possibly more prone to false signals.
█ What is K-Nearest Neighbors (K-NN) algorithm?
At its core, the K-NN algorithm recognizes patterns within market data and analyzes the relationships and similarities between data points. By considering the 'K' most similar instances (or neighbors) within a dataset, it predicts future price movements based on historical trends. The K-Nearest Neighbors (K-NN) algorithm is a type of instance-based or non-generalizing learning. While K-NN is considered a relatively simple machine-learning technique, it falls under the AI umbrella.
We can classify the K-Nearest Neighbors (K-NN) algorithm as a form of artificial intelligence (AI), and here's why:
Machine Learning Component: K-NN is a type of machine learning algorithm, and machine learning is a subset of AI. Machine learning is about building algorithms that allow computers to learn from and make predictions or decisions based on data. Since K-NN falls under this category, it is aligned with the principles of AI.
Instance-Based Learning: K-NN is an instance-based learning algorithm. This means that it makes decisions based on the entire training dataset rather than deriving a discriminative function from the dataset. It looks at the 'K' most similar instances (neighbors) when making a prediction, hence adapting to new information if the dataset changes. This adaptability is a hallmark of intelligent systems.
Pattern Recognition: The core of K-NN's functionality is recognizing patterns within data. It identifies relationships and similarities between data points, something akin to human pattern recognition, a key aspect of intelligence.
Classification and Regression: K-NN can be used for both classification and regression tasks, two fundamental problems in machine learning and AI. The indicator code is used for trend classification, a predictive task that aligns with the goals of AI.
Simplicity Doesn't Exclude AI: While K-NN is often considered a simpler algorithm compared to deep learning models, simplicity does not exclude something from being AI. Many AI systems are built on simple rules and can be combined or scaled to create complex behavior.
No Explicit Model Building: Unlike traditional statistical methods, K-NN does not build an explicit model during training. Instead, it waits until a prediction is required and then looks at the 'K' nearest neighbors from the training data to make that prediction. This lazy learning approach is another aspect of machine learning, part of the broader AI field.
-----------------
Disclaimer
The information contained in my Scripts/Indicators/Ideas/Algos/Systems does not constitute financial advice or a solicitation to buy or sell any securities of any type. I will not accept liability for any loss or damage, including without limitation any loss of profit, which may arise directly or indirectly from the use of or reliance on such information.
All investments involve risk, and the past performance of a security, industry, sector, market, financial product, trading strategy, backtest, or individual's trading does not guarantee future results or returns. Investors are fully responsible for any investment decisions they make. Such decisions should be based solely on an evaluation of their financial circumstances, investment objectives, risk tolerance, and liquidity needs.
My Scripts/Indicators/Ideas/Algos/Systems are only for educational purposes!

YujiYokooFXYujiYokooFX Oscillator
Class : oscillator
Purpose : reversal trading
Period : any
Idea of the Indicator
Technical analysis often uses indicators to predict price behaviour, with trend indicators being based on price trends and oscillators on price reversals. Two of the most popular oscillators are known as “Momentum” and “Relative Strength Index” (“RSI”) respectively. Have you ever seen their formulas? Take your time and you will see none of them can provide any useful information about future prices. Both of them are simply random algorithms which can only generate random results.
Still academicians have developed a lot of really working methods: different types of time series models (AR – autoregressive models, ARMA - autoregressive–moving-average, ARIMA - autoregressive integrated moving average, VAR - vector autoregression, etc.) can be estimated to predict future prices
“YujiYokooFX Oscillator” is an academic style indicator based on ARIMA model.
It uses autoregressive integrated moving average technics to calculate the theoretical price of the asset and compare it with the actual price. This price difference is used to define whether current prices are overbought or oversold.
Structure of the Indicator
Indicator consists of two oscillatory lines: main (blue colored) and signal (red colored). Overbought and oversold zones are indicated with black dotted horizontal lines.
Rules of trading
Rules of trading are typical for oscillators.
• When the oscillatory line enters the overbought zone – long positions should be closed and after line leaves the overbought zone short position should be opened.
• When the oscillatory line enters the oversold zone – short positions should be closed and after line leaves the oversold zone long position should be opened.
Signal line is used to reduce the level of noise in the oscillatory line dynamics.
In order to ease the trading purposes “YujiYokooFX Oscillator” displays BUY/SELL signals right on the indicator chart.
Access to the indicator
Please address all questions about this indicator (including access to it) in private messages.

Extrapolated Previous Trend [LuxAlgo]The Extrapolated Previous Trend indicator extrapolates the estimated linear trend of the prices within a previous interval to the current interval. Intervals can be user-defined.
🔶 USAGE
Returned lines can be used to provide a forecast of trends, assuming trends are persistent in sign and slope.
Using them as support/resistance can also be an effecting usage in case the trend in a new interval does not follow the characteristic of the trend in the previous interval.
The indicator includes a dashboard showing the degree of persistence between segmented trends for uptrends and downtrends. A higher value is indicative of more persistent trend signs.
A lower value could hint at an anti-persistent behavior, with uptrends over an interval often being followed by a down-trend and vice versa. We can invert candle colors to determine future trend direction in this case.
🔶 DETAILS
This indicator can be thought of as a segmented linear model ( a(n)t + b(n) ), where n is the specific interval index. Unlike a regular segmented linear regression model, this indicator is not subject to lookahead bias, coefficients of the model are obtained on previous intervals.
The quality of the fit of the model is dependent on the variability of its coefficients a(n) and b(n) . Coefficients being less subject to change over time are more indicative of trend persistence.
🔶 SETTINGS
Timeframe: Determine the frequency at which new trends are estimated.

Stocashi + CaffeineCrush Momentum Indicator by CoffeeShopCryptoThis is just a fun script to give a different representation to the ever popular Stochastic RSI
Even for me over the years the stochastic has been a difficult one to use in trading merely because of its choppy look.
Since Heikin-Ashi Candles do such a powerful job in smoothing out the look of choppy markets,
I decided to test it out on the look of the Stochastic RSI.
From an initial visual standpoint it worked out WAY better than I thought but it seemed to need something more.
I decided to use the PineScript "Color.From_Gradient" feature to give the Stochastic a more 3 dimensional look, which really brought the "old-school" indicator to life.
Description:
The CaffeineCrush Momentum Indicator is your ultimate trading companion, blending the invigorating world of coffee with the excitement of market momentum. Just like a finely brewed cup of joe,
This indicator provides you with a powerful insight into market dynamics, helping you stay in the trading groove.
As you sip on this caffeinated delight, CaffeineCrush monitors the velocity and strength of price movements,
measuring the momentum of the market. But here's where it gets even more enticing – it goes a step further by incorporating a pressure indication, adding a stimulating twist to your trading experience.
Imagine yourself in a bustling coffee shop, surrounded by the aroma of freshly roasted beans and the energetic buzz of conversations.
CaffeineCrush mimics that atmosphere, keeping you on your toes, always aware of market forces at play.
With CaffeineCrush, you'll never miss a beat. It identifies and highlights moments of heightened momentum and increased pressure,
giving you an edge in capturing profitable opportunities. Just like a perfectly extracted espresso shot, this indicator helps you maintain your trading momentum and navigate the market with confidence.
So, grab your favorite cup of joe, fire up your trading charts, and let CaffeineCrush awaken your trading prowess.
Stay in the groove, embrace the buzz, and master the momentum with this flavorful indicator by your side.
Divergence -
Regular Divergence shows when there is a conflict between the strength of the trend and the swing of the price movement.
Hidden Divergence -
Are to be traded using the same methods as hidden divergences of the MACD or the RSI. A hidden divergence is commonly a trend CONTINUATION move.
Pink Pause -
This shows a ranging area where price is taking a pause. It can be a single candle or a string of candles. But histogram with continue with its RED / GREEN colors once the pause is over.
Stocashi + CaffeineCrush is not an entry / exit indicator. It's designed to help you understand:
1. Weather your trend is continuing
2. When it pauses
3. Has your pullback started / ended
Its best used near area of conflict. For example:
1. If you have a breakout to the low side of support zone, and you get a BULLISH divergence, this can be viewed as a false breakout.
2. If you trading towards the opposite area of a range or key level and you get conflicting movement in the Stocashi + CaffeineCrush, then you should take ur profits and wait for the next move.
3. If you are following through with example 2 above, but get NO conflicts, you can immediately look for a secondary take profit area and split / hedge your take profits.

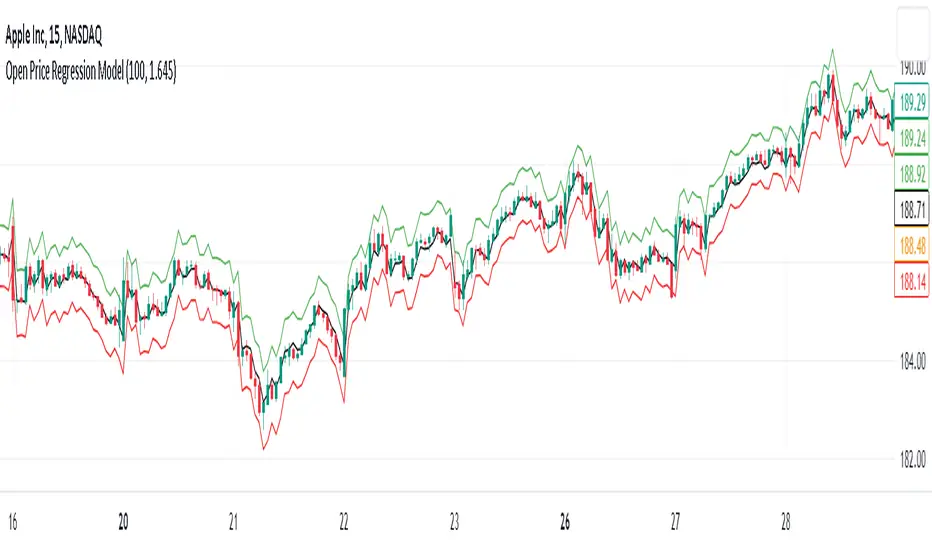
Open Price Regression Modelnput Variables: The user can adjust the lookbackPeriod and m (multiplier) inputs. The lookbackPeriod specifies the number of previous bars used for regression calculations, and m is used to calculate the confidence interval width.
Calculate Regression Model: The code extracts open, high, low, and close prices for the current candle. It then performs regression calculations for high, low, and close prices based on the open prices.
Calculate Predicted Prices: Using the regression coefficients and intercepts, the code calculates predicted high, low, and close prices based on the current open price.
Calculate Confidence Interval: The code computes the standard errors of the regression for high, low, and close prices and multiplies them by the specified confidence level multiplier (m) to determine the width of the confidence intervals.
Plotting: The predicted high, low, and close prices are plotted with different colors. Additionally, confidence intervals are plotted around the predicted prices using lines.
Implications and Trading Advantage:
The Open Price Regression Model aims to predict future high, low, and close prices based on the current open price. Traders can use the predicted values and confidence intervals as potential price targets and volatility measures. Traders can consider taking long or short positions based on whether the current open price is below or above the predicted prices. Can be used on a daily time frame to forecast the day's high and low and use this levels are horizontal price levels on lower timeframes.
Top - Bottom Using MAThis script is used decide weather stock is overbought or oversold in given length/days from the settings.
using close difference from ohlc4 moving average ratio.
Settings Available
1) moving average length
2) Highest / Lowest ratio length
3) Difference Between Highest and Lowest Line
this script plot/display 4 lines
1) highest difference from moving averages in provided length.
2) lowest difference from moving averages in provided length.
3) ratio of moving average and ohlc4
4) linear regression moving averages of ratio of moving average and ohlc4
How to use this script
1) when ratio line is touch 2 days to highest ratio line means we are consider stock is in overbought levels or linear regression moving average above highest ratio line means overbought.
2) when ratio lines cross below its linear regression moving average then we consider final exit or book profit.
3) when linear regression moving average below lowest ratio line means stock is in oversold.
4) when linear regression moving average below lowest ratio line and linear regression line start rising after fall it means there is change in trend.
5) when linear regression moving average cross above lowest ratio line it means trend is changed and linear regression line turns green.

Multi Kernel Regression [ChartPrime]The "Multi Kernel Regression" is a versatile trading indicator that provides graphical interpretations of market trends by using different kernel regression methods. It's beneficial because it smoothes out price data, creating a clearer picture of price movements, and can be tailored according to the user's preference with various options.
What makes this indicator uniquely versatile is the 'Kernel Select' feature, which allows you to choose from a variety of regression kernel types, such as Gaussian, Logistic, Cosine, and many more. In fact, you have 17 options in total, making this an adaptable tool for diverse market contexts.
The bandwidth input parameter directly affects the smoothness of the regression line. While a lower value will make the line more sensitive to price changes by sticking closely to the actual prices, a higher value will smooth out the line even further by placing more emphasis on distant prices.
It's worth noting that the indicator's 'Repaint' function, which re-estimates work according to the most recent data, is not a deficiency or a flaw. Instead, it’s a crucial part of its functionality, updating the regression line with the most recent data, ensuring the indicator measurements remain as accurate as possible. We have however included a non-repaint feature that provides fixed calculations, creating a steady line that does not change once it has been plotted, for a different perspective on market trends.
This indicator also allows you to customize the line color, style, and width, allowing you to seamlessly integrate it into your existing chart setup. With labels indicating potential market turn points, you can stay on top of significant price movements.
Repaint : Enabling this allows the estimator to repaint to maintain accuracy as new data comes in.
Kernel Select : This option allows you to select from an array of kernel types such as Triangular, Gaussian, Logistic, etc. Each kernel has a unique weight function which influences how the regression line is calculated.
Bandwidth : This input, a scalar value, controls the regression line's sensitivity towards the price changes. A lower value makes the regression line more sensitive (closer to price) and higher value makes it smoother.
Source : Here you denote which price the indicator should consider for calculation. Traditionally, this is set as the close price.
Deviation : Adjust this to change the distance of the channel from the regression line. Higher values widen the channel, lower values make it smaller.
Line Style : This provides options to adjust the visual style of the regression lines. Options include Solid, Dotted, and Dashed.
Labels : Enabling this introduces markers at points where the market direction switches. Adjust the label size to suit your preference.
Colors : Customize color schemes for bullish and bearish trends along with the text color to match your chart setup.
Kernel regression, the technique behind the Multi Kernel Regression Indicator, has a rich history rooted in the world of statistical analysis and machine learning.
The origins of kernel regression are linked to the work of Emanuel Parzen in the 1960s. He was a pioneer in the development of nonparametric statistics, a domain where kernel regression plays a critical role. Although originally developed for the field of probability, these methods quickly found application in various other scientific disciplines, notably in econometrics and finance.
Kernel regression became really popular in the 1980s and 1990s along with the rise of other nonparametric techniques, like local regression and spline smoothing. It was during this time that kernel regression methods were extensively studied and widely applied in the fields of machine learning and data science.
What makes the kernel regression ideal for various statistical tasks, including financial market analysis, is its flexibility. Unlike linear regression, which assumes a specific functional form for the relationship between the independent and dependent variables, kernel regression makes no such assumptions. It creates a smooth curve fit to the data, which makes it extremely useful in capturing complex relationships in data.
In the context of stock market analysis, kernel regression techniques came into use in the late 20th century as computational power improved and these techniques could be more easily applied. Since then, they have played a fundamental role in financial market modeling, market prediction, and the development of trading indicators, like the Multi Kernel Regression Indicator.
Today, the use of kernel regression has solidified its place in the world of trading and market analysis, being widely recognized as one of the most effective methods for capturing and visualizing market trends.
The Multi Kernel Regression Indicator is built upon kernel regression, a versatile statistical method pioneered by Emanuel Parzen in the 1960s and subsequently refined for financial market analysis. It provides a robust and flexible approach to capturing complex market data relationships.
This indicator is more than just a charting tool; it reflects the power of computational trading methods, combining statistical robustness with visual versatility. It's an invaluable asset for traders, capturing and interpreting complex market trends while integrating seamlessly into diverse trading scenarios.
In summary, the Multi Kernel Regression Indicator stands as a testament to kernel regression's historic legacy, modern computational power, and contemporary trading insight.
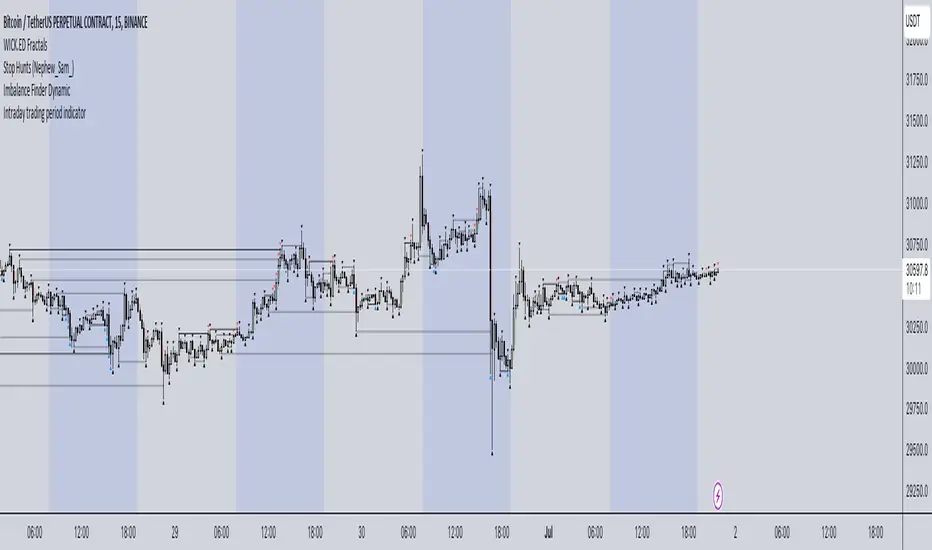
Intraday trading period indicatorI have created this indicator because I was in a need of simple indication of personal session time for my backtesting while practicing intraday Futures trading.
How it works:
1. Define your timezone.
2. Set Trading session start/end time.
3. Choose the colour you want to see your intraday session in.
Actual result: Your selected session is displayed with selected colour and within selected time period. Your are good to go.
It is not perfect for sure but it does what it needs to do and I think it is awesome.
Hope it will be useful for you and let the Profit be with you!
Algorganic Buy / Sell / X-Exit Signal [UOI]The " Algorganic Buy / Sell / X-Exit Signal " indicator is an Algorithmic Machine Learning-based superpack indicator that generates buy and sell signals for trading in financial markets. It is packed with conditional statemnets and filters to avoid false signals and utilizes Nearest Neighbors Model (NNM) algorithm with a distance metric to determine the direction of the price movement and make predictions according to the next past 12 bars for the next 4 to 8 bars in whatever chart frame the trader is using. Ideal time frames are 2, 3, 5 and 15 minutes for option traders and scalpers can use it on the 1 minute chart.
The indicator takes into account various technical indicators such as Relative Strength Index (RSI), Average Directional Index (ADX), CCI, Stochastic, ATR and major EMAs and has two optimizer for confirmation. These indicators are used as features to train the Machine Learning model and at the same time to provide better buy and sell signals with multiple "if" conditions.
The NNM algorithm calculates the distance between the current data point and historical data points. It works like a mixture of ATR and ADX. By considering the nearest neighbors, the model predicts the direction of future price movement. The predictions are filtered using additional criteria, including volatility, trend detection, and, ATR and ADX values.
The indicator provides visual signals on the chart, indicating when to enter a long (buy) or short (sell) position but traders should also be mindful of support and resistance levels and oversold and overbought conditions and the higher timeframe signal. It also offers options for dynamic exits based on specific conditions or fixed exits after a predefined number of bars.
Additionally, the indicator includes filters based on EMA (Exponential Moving Average), SMA (Simple Moving Average), and a kernel regression technique. These filters help to refine the signals and reduce noise in the predictions.
The indicator also includes alert functionalities to notify traders of entry and exit points.
The Algorganic is a versatile trading indicator that provides buy and sell signals based on the analysis of various popular technical indicators in combination with Machine Learning techniques with technical analysis and support and resistance levels to generate trading signals, helping traders make informed decisions. This powerful tool overlays on your price chart and can be used across different markets and timeframes.
Key Features:
1. Dynamic EMA Support and Resistance Levels: You can define the top and bottom lines as either 'Support' or 'Resistance'. These levels are calculated using an Exponential Moving Average (EMA) and Average True Range (ATR) inputs.
2. Exponential Moving Average (EMA): The EMA is calculated based on the EMA length input provided by the user, with a default setting of 21 periods.
3. Average True Range (ATR): The ATR is calculated with a default length of 14 periods and is used in determining the support and resistance levels.
4. Buy/Sell Signals: The indicator provides buy and sell signals when the price hits the defined support or resistance levels. These signals are represented by X-shapes plotted on the chart, with green indicating a hit on support (buy signal), and red indicating a hit on resistance (sell signal).
5. Trend Strength Analysis: It uses a unique combination of technical indicators like MACD, RSI, Velocity, CCI, Stochastic, and a custom trend strength indicator. The settings for each of these indicators can be customized according to user preference.
6. Bull/Bear Tug of War: This feature paints the little triangles green if the majority of the indicators are bullish, and red if the majority are bearish. This is a powerful feature to visualize the overall market sentiment.
7. Buy/Sell Alert: The script generates alerts for potential buy and sell signals. Alerts contain information about the signal type, ticker symbol, and current price.
8. Plot EMA Line: This indicator includes an option to display an additional EMA line on the chart, which can be toggled on or off as per the user's choice.
How to use it:
You basically need to master riding this machine. There are a lot of conditions that have been added to make sure novice traders do not make a mistake. The image below shows how to use the indicator. Pay attention to colors:
Longer time frame you should pay attention to the EMA lines and over bought and oversold levels in the optimizers. here is an example:
And another example on 15 min timeframe:
On top of all the above, this indicator has a built-in advanced support and resistance tool that dynamically identifies pivot points and their corresponding support and resistance zones based on the historical data of a given asset. So what this means is that you should ignore a buy signal very close to a resistance and only enter when the resistance is broken.
Here are the configurable support and resistance parameters:
1. Pivot Period : The period considered for pivot detection. The range is between 4 to 30 days with a default value of 25.
2. Source: The price point to be used as the source for pivot detection. You can choose between 'High/Low' and 'Close/Open'.
3. Maximum Number of Pivot: This defines the maximum number of pivot points that the algorithm will store. This can be anywhere from 5 to 100, with 45 as the default value.
4. Maximum Channel Width % : This sets the maximum width of the support/resistance channel as a percentage. Minimum value is 1, with a default value of 10. Higher numbers capture longer timeframe and lower number shorter timeframes. For scalping use 5 or 8 for swing use 12 or 14.
5. Maximum Number of Lines: This sets the maximum number of support/resistance lines displayed on the chart. It ranges from 1 to 15 with a default of 10.
6. Minimum Strength: This is the minimum strength of the support or resistance line, defined by the number of times price touches it. It ranges from 1 to 10 with a default of 2.
7. Line Style: This option allows the user to choose the line style between 'Solid', 'Dotted', and 'Dashed'.
8. Line Width: This allows users to choose the width of the line ranging from 1 to 4.
9. Resistance Color and Support Color: These define the colors for the resistance and support lines.
The script also includes functions to calculate if the price has crossed over or under a support or resistance line.
The S/R assist uses these inputs to calculate pivot highs and lows, create support and resistance zones, and plot these on the chart. When the price crosses a support or resistance line, the script can identify this as a possible trading signal. The lines' strengths are also calculated, and only those with strengths above the user-defined minimum are drawn on the chart.

Regression Candle Conversion IndicatorHey everyone!
I got a pseudo-request a while ago for something like this, essentially the ability to track where another ticker would fall based on an alternative ticker.
I did create my ticker correlation reference indicator which directly looks at the correlation between 2 tickers. However, this is an indicator that operates on the same principle but is more pragmatic for trading.
What does it do?
Well, in keeping with the theme of what I call my indicators, this has a title that explains exactly what it does, "Regression Candle Conversion Indicator" or "RCCI" for short. It uses simple regression to convert one ticker to another. So while you are tracking one indicator, you can see where the expected value should fall on the other.
Applications?
The big application of this for me is being able to track where SPY/QQQ or IWM is falling during overnight trading sessions. Extended trading hours close at 8 pm NYSE time. After that, you have to guess where futures prices will put the ETF version of it. This indicator will allow you to track where, theoretically, the underlying ETF ticker will fall based on the current trading behaviour.
Some other applications are just the ability to track how similar or dissimilar one stock is to the other. For example, if we wanted to trade, say, Boeing using shares of DFEN or ITA (a defence specific ETF), here is what we get:
In the chart above we can see BA as the primary chart and ITA as the RCCI converted chart. We will see 2 major things that should cause us concern.
First, there is a really poor correlation between the two tickers. This indicates that ITA may not produce the best exposure if I am directly looking for Boeing exposure.
Second, there is a wide standard error. this means that the results that the RCCI is providing may be skewed up to +/- 2 points (as indicated by the standard error chart).
Let's take a look at BA and DFEN:
In the above, we can see that the correlation is not great, but the standard error is quite low.
This means that, while this may not be the best ticker for Boeing exposure, the RCCI is able to confidently calculate the ticker within +/- 0.50 cents based on BA's underlying data.
However, its important to note that it is not advisable to really rely on these results if the correlation is less than + 0.5 or greater than -0.5.
Let's take a look at a few more examples:
Above we have BA (NYSE) vs BA (NEO TSX CAD Hedged). We can see the strong relationship and high confidence calculations.
And some others:
SPX (primary) and ES1! (secondary):
RTY and IWM:
ES1! and SPY:
Customizations:
As you can see above, it is pretty straight forward. There are 3 options:
Lookback Length: Determines the length of assessment for correlation and the regression assessment.
Manual Ticker Input: The indicator will pull the data from your current chart and compare it against a manually selected indicator. You must tell the indicator which ticker you are comparing against.
Data Table: This will show you the data table which contains the standard error assessment and the correlation assessment. These are determined by your lookback length. The lookback length is defaulted to 500.
And that's the indicator! It's pretty straight forward. Hopefully you find it helpful, especially if you track futures during overnight sessions.
Leave your comments/questions and feedback below.
Thanks for checking it out!

Machine Learning : Dominant Cycle Elastic Volume KNNAbout the Script
Dominant Cycle Elastic Volume KNN ,
is a non-parametric algorithm, which means that, initially it makes no assumptions about the underlying distribution of the time-series price as well as volume.
This approach gives it flexibility so that it can be used on a wide variety of securities at variety of timeframes.(even on lower timeframes such as seconds)
The main purpose of this indicator is to predict the trend of the underlying, by converging price, volume and dominant cycle as dimensions and generate signals of action.
Key terms :
Dominant cycle is a time cycle that has a greater influence on the overall behaviour of a system than other cycles.
The system uses Ehlers method to calculate Dominant Cycle/ Period.
Dominant cycle is used to determine the influencing period for the underlying.
Once the dominant cycle/ period is identified, it is treated as a dynamic length for considering further calculations
Elastic Volume MA is a volume based moving average which is generally used to converge the volume with price, the dominant period is used here as the length parameter
KNN K-Nearest Neighbour is one of the simplest Machine Learning algorithms based on Supervised Learning technique.
K-NN algorithm assumes the similarity between the new case/data and available cases and put the new case into the category that is most similar to the available categories.
K-NN algorithm stores all the available data and classifies a new data point based on the similarity. This means when new data appears then it can be easily classified into a well suite category by using K- NN algorithm. K-NN algorithm can be used for Regression as well as for Classification but mostly it is used for the Classification problems.
So, K-NN is used here to classify the trend of the Dominant Cycle Elastic Volume, and Generate Signals on top of it
How to Use the Indicator ?
The Buy Signal Candle
The Sell Signal Candle
The Buy Setup
The Sell Setup
Stop and Reverse Structure
What Timeframes and Symbols can this indicator be used on ?
The above indicator can be used on any liquid security which has volume information intact with ticker
and it can be used on any timeframe, but the best timeframes are
The indicator can also be used as a trend confirmatory indicators on lower time frames, like 30second
The Script has provision for alerts
Two alerts are there :
Alert 1= "LONG CONDITION : DCEV-ML"
Alert 2= "SHORT CONDITION : DCEV-ML"
How to request for access ?
Simply private message me !
