Multi-Timeframe RSI GridThe relative strength index (RSI) is a momentum indicator that measures the magnitude of recent price changes to evaluate overbought or oversold conditions. The RSI is normally displayed as an oscillator separately from price and can have a reading from 0 to 100. This indicator displays the current RSI levels at up to 6 timeframes (of your choosing) in a grid. If the RSI levels reach overbought (above 70) or oversold (below 30) conditions, it changes the color to help you see that RSI has reached extreme levels. Note that in TradingView, when the chart is on a higher timeframe, the lower timeframe RSI levels don't calculate properly. If those conditions are met, this indicator will hide those values in the grid. If none of your selected values are available, it hides the table completely. There are configuration options, like:
Position the grid in any corner of the screen
Style customization (color, size)
Customize RSI length
Relative-strength-index

RSI Levels, Multi-TimeframeThe relative strength index (RSI) is a momentum indicator that measures the magnitude of recent price changes to evaluate overbought or oversold conditions. RSI is normally displayed as an oscillator separately from price and can have a reading from 0 to 100. This indicator takes the RSI and plots the 30 & 70 levels onto the price chart so you can see when price is going to meet the 30 or 70 levels. The reason the 30 & 70 levels are important is because many traders (and bots) use those as signals to buy (at 30 RSI) or sell (at 70 RSI). Additionally, this indicator allows you to display not just the RSI levels of your currently viewed timeframe on the chart, but also shows the RSI levels of up to 6 different timeframes on the same chart. This allows you to quickly see if multiple RSI levels are aligning across different timelines, which is an even stronger indication that price is going to change direction when it meets those levels on the chart. There are a lot of nice configuration options, like:
Style customization (color, thickness, size)
Labels on the chart so you can tell which plots are the RSI levels
Optionally display the plot as a horizontal line if all you care about is the RSI level right now
Toggle overbought (RSI 70) or oversold (RSI 30) on/off completely

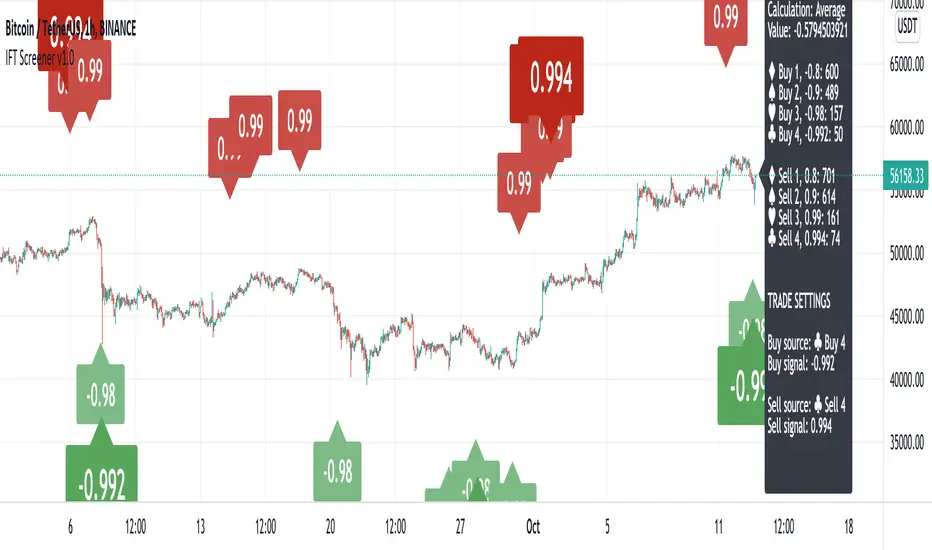
Inverse Fisher Transform ScreenerThis is a Screener for Inverse Fisher Transform on multiple oscillators
This tool is intended to aid you to visually analyse reasonable buy and sell IFT-signal thresholds across multiple tokens and different sources. It will help you speed up the tedious and manual work of trying out different IFT-settings when you're able to review the chart visually to find which values are present the most often and the location of that signal on the chart.
What does it bring to the table, why is it useful?
- Invese Fisher Transform on multiple oscillators such as RSI, MFI, CCI, Stochastic
- Combine multiple sources into one signal, select how it's calculated
- Visually review the chart for good IFT-settings
- 4 dynamic buy labels with different thresholds
- 4 dynamic sell labels with different thresholds
- Buy and sell on signal reversal
- Create your own trade alerts for automation
- Backtester compatible (plots 1 and 2 for buy and sell signals)
- A dynamic table counting amount of signals for each setting
- The labels are automatically updated when you change the values in the settings
How to use?
1. Change signal source and method
2. Change buy and sell thresholds
3. Show/hide additional labels
4. Review chart
5. Change trade settings
6. Backtest
7. Create alerts
Description
With this indicator you're able to visually review the signal strength of one or multiple oscillators processed with Inverse Fisher Transform ( IFT ), combine them and choose the method of calculation when they are combined. This produces a signal which strongly fluctuates between -1 and +1 instead of the more common 0-100 most oscillators uses. The intention is to make the decision making clearer and easier when you decide when to enter or exit a trade. This aims to help you remove the feelings from your trading.
Inverse Fisher Transform was first presented by John Ehlers in Stocks & Commodities V. 22:5 where he proposes to process RSI with the formula for hyperbolic tangent, tanh (x). This transforms the oscillator into a smoother and more compressed version with quicker oscillations.
GoldenCO Aie2 Use of GoldenCO Aie2
This market price movement trend analysis uses exponential moving average which is ema5/20/50. The purpose of using this EMA is to find out the effect of price changes that occur and the current trend of the market whether bullish or bearish.
It is suitable for short-term or long-term trading.
for short term trading, the trader uses ema5-ema20 and for long term trading the trader can use ema5-ema50 as analysis.
This indicator serves as a guide to traders in trading activities.
we hope that, by recognizing and knowing the trend of this price movement it can help traders in trading activities well and can reduce risk. May it benefit the trader.
DISCLAIMER : This is not Buy/Sell call, just sharing idea analysis for education. Trade at your own risk.
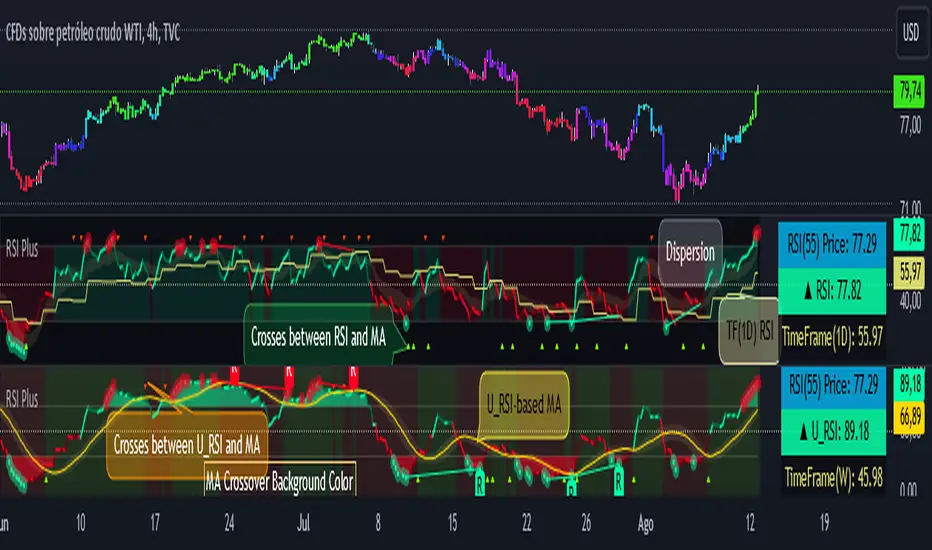
RSI PlusRSI Plus:
☑️ Show the divergences.
☑️ Shows the approximate price of an RSI level (by default it is level 55 but it can be changed for any other level).
☑️ Shows the bulls and bears zones, in green when crossing level 50 up and red when crossing down.
☑️ Circle the highest and lowest levels as possible purchases and sales.
☑️ Includes a smoothed RSI.
RSI Plus:
☑️ Muestra las divergencias.
☑️ Muestra el precio aproximado de un nivel del RSI (por defecto viene el nivel 55 pero se lo puede cambiar por cualquier otro nivel).
☑️ Muestra la zonas de toros y osos, en verde cuando cruza hacia arriba el nivel 50 y rojo cuando cruza hacia abajo.
☑️ Marca con un circulo los niveles mas alto y mas bajos como posibles compras y ventas.
☑️ Incluye un RSI suavizado.
Relative Volume Strength IndexRVSI is an alternative volume-based indicator that measures the rate of change of average OBV.
How to read a chart using it?
First signal to buy is when you see RVSI is close to green oversold levels.
Once RVSI passes above it's orange EMA, that would be the second alert of accumulation.
Be always cautious when it reaches 50 level as a random statistical correction can be expected because of "market noises".
You know it's a serious uptrend when it reaches above 75 and fluctuates there, grading behind EMA.
The best signal to sell would be a situation where you see RVSI passing below it's EMA when the whole thing is close to Red overbought level
It looks simple, but it's powerful!
I'd use RVSI in combination with price-based indicators.

XPloRR S&P500 Stock Market Crash Detection Strategy v2XPloRR S&P500 Stock Market Crash Detection Strategy v2
Long-Term Trailing-Stop strategy detecting S&P500 Stock Market Crashes/Corrections and showing Volatility as warning signal for upcoming crashes
Detecting or avoiding stock market crashes seems to be the 'Holy Grail' of strategies.
Since none of the strategies that I tested can beat the long term Buy&Hold strategy, the purpose was to detect a stock market crash on the S&P500 and step out in time to minimize losses and beat the Buy&Hold strategy. So beat the Buy&Hold strategy with around 10 trades. 100% capitalize sold trade into new trade.
With the default parameters the strategy generates 10262% profit (starting at 01/01/1962 until release date), with 10 closed trades, 100% profitable, while the Buy&Hold strategy only generates 3633% profit, so this strategy beats the Buy&Hold strategy by 2.82 times !
Also the strategy detects all major S&P500 stock market crashes and corrections since 1962 depending on the Trailing Stop Smoothness parameter, and steps out in time to cut losses and steps in again after the bottom has been reached. The 5 major crashes/corrections of 1987, 1990, 2001, 2008 and 2010 were successfully detected with the default parameters.
The script was first released on November 03 2019 and detected the Corona Crash on March 04 2020 with a Volatility crash-alert and a Sell crash-alert.
I have also created an Alerter Study Script based on the engine of this script, which generates Buy, Sell and Volatility signals.
If you are interested in this Alerter version script, please drop me a mail.
The script shows a lot of graphical information:
the Close value is shown in light-green. When the Close value is temporarily lower than the Buy value, the Close value is shown in light-red. This way it is possible to evaluate the virtual losses during the current trade.
the Trailing Stop value is shown in dark-green. When the Sell value is lower than the Buy value, the last color of the trade will be red (best viewed when zoomed)
the EMA and SMA values for both Buy and Sell signals are shown as colored graphs
the Buy signals are labeled in blue and the Sell signals are labeled in purple
the Volatility is shown below in green and red. The Alert Threshold (red) is default set to 2 (see Volatility Threshold parameter below)
How to use this Strategy?
Select the SPX (S&P500) graph and add this script to the graph.
Look in the strategy tester overview to optimize the values Percent Profitable and Net Profit (using the strategy settings icon, you can increase/decrease the parameters), then keep using these parameters for future Buy/Sell signals on the S&P500.
More trades don't necessarily generate more overall profit. It is important to detect only the major crashes and avoid closing trades on the smaller corrections. Bearing the smaller corrections generates a higher profit.
Watch out for the Volatility Alerts generated at the bottom (red). The Threshold can by changed by the Volatility Threshold parameter (default=2% ATR). In almost all crashes/corrections there is an alert ahead of the crash.
Although the signal doesn't predict the exact timing of the crash/correction, it is a clear warning signal that bearish times are ahead!
The correction in December 2018 was not a major crash but there was already a red Volatility warning alert. If the Volatility Alert repeats the next weeks/months, chances are higher that a bigger crash or correction is near. As can be seen in the graphic, the deeper the crash is, the higher and wider the red Volatility signal goes. So keep an eye on the red flag!
Here are the parameters:
Fast MA Buy: buy trigger when Fast MA Buy crosses over the Slow MA Buy value (use values between 10-20)
Slow MA Buy: buy trigger when Fast MA Buy crosses over the Slow MA Buy value (use values between 21-50)
Minimum Buy Strength: minimum upward trend value of the Fast MA Buy value (directional coefficient)(use values between 10-100)
Fast MA Sell: sell trigger when Fast MA Sell crosses under the Slow MA Sell value (use values between 10-20)
Slow MA Sell: sell trigger when Fast MA Sell crosses under the Slow MA Sell value (use values between 21-50)
Minimum Sell Strength: minimum downward trend value of the Fast MA Sell value (directional coefficient)(use values between 10-100)
Trailing Stop ATR: trailing stop % distance from the smoothed Close value (use values between 2-20)
Trailing Stop Smoothness: MA value for smoothing out the Trailing Stop close value
Buy On Start Date: force Buy on start date even without Buy signal (default: true)
Sell On End Date: force Sell on end date even without Sell signal (default: true)
Volatility EMA Period: MA value of the Volatility value (default 15)
Volatility Threshold: Threshold value to change volatility graph to red (default 2)
Volatility Graph Scaler: Scaling of the volatility graph (default 5)
Important : optimizing and using these parameters is no guarantee for future winning trades!

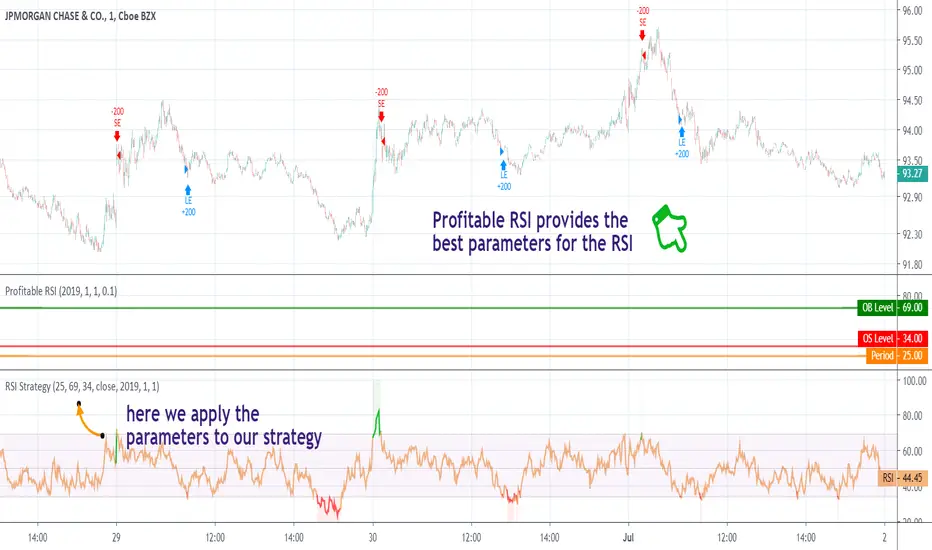
[STRATEGY] Jurik RSXA private strategy from the Profitable Jurik RSX preview for backtesting purposes.


RSI Divergence Smoothed with Signal Line and Power ZonesThis Indicator plots Regular and Hidden Divergences lines for an RSI smoothed by an EMA and for its Signal Line
The RSI can be set to change colour with direction or can be set as single colour
Colour Changing RSI helps when trading Multiple Timeframes as you can look for confluence in the direction of RSI
The divergence script is thanks to @RicardoSantos, I've just adjusted it to suite my indicator
Remember that divergences work best when traded with the trend or very late in a trend when going against the trend
I have also added a Colour Changing Signal Line & Hima Reddy's Power Zones so now you can also
Take full advantage of trading; signal line crosses, 50 crosses and Power Zone RSI support and resistance

Relative Strength Index Multi Time frame RSII am always checking RSI on 1hr, 4Hr and Day RSI.
Having to switch is annoying so wrote this little script to show RSI on upto 5 time frames.
The green bold line is the current time frame, and you can change the other 4 to what you prefer.
If one time frame is over sold or overbought you can change the back to indicated a buy or sell etc.
Anyway thought I would share it.
If you like it, please click the like button.

Volume/Rsi Overbought/oversoldI present you my last indicator. A volume indicator that indicates overbought and oversold based on the rsi, I chose the rsi because the most used surment, this indicator allows you to identify the overbought and oversold areas of the rsi with the colors blue (oversold) and orange (overbought ) on the volume indicator! Hoping that you are useful
Viperz RSI v1.2The color of the RSI inner bands will change from Purple to Green if RSI >70 and they will change to yellow if RSI >75. Nothing else has been changed from the standard RSI. Please understand I'm testing how publishing indicators works in Trading View. I have only done a minor adjustment to the RSI indicator, but I plan to do much more once I fully understand the publishing process. Thank you. Hope you enjoy. :)
AJCrows RSIRelative Strength Index with indicator lines at 20, 30, 50, 70 and 80 marks. Use settings to show/hide these lines, and to choose appropriate colors.

Relative Strength Index on TranquilizersSome weeks ago, I had a patient in my practice who suffered from internal stability disorders.
Certainly not a case of disordered thinking or schizophrenic behaviour, because his general sense of direction wasn’t the problem.
He just couldn’t find the right overall balance, an ailment he struggled with for years.
Straight away I could diagnose that surgery wasn’t an option, so I gave him a medicine he would clearly benefit from.
I never heard from him again…. He must be doing just fine.
Cheers, Indicat...
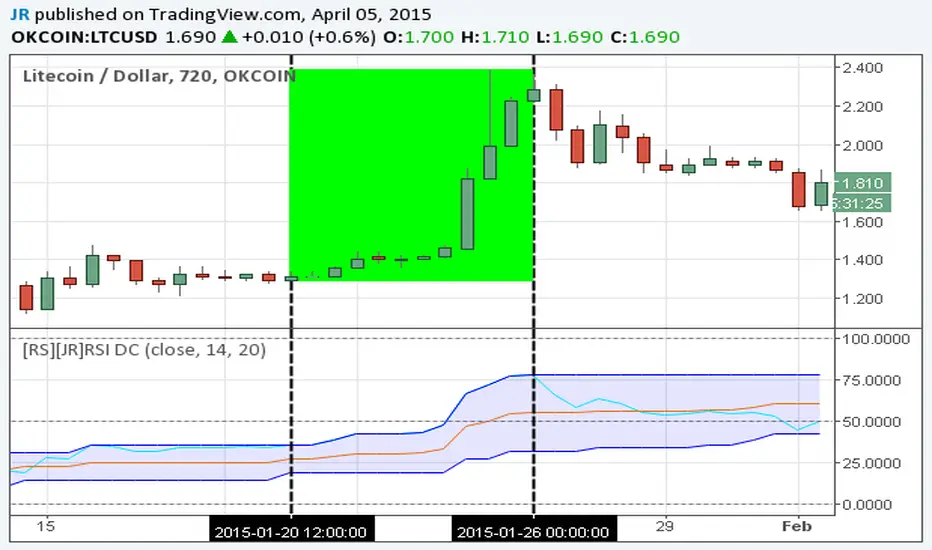
[RS][JR]RSI Donchian ChannelsRSI Donchian Channels
Built by Ricardo and JR
Here is a great indicator to use for strong trends. Donchian Channels react immediately to changes in the highest high and lowest low. For strong trends you want to trade when RSI is set along the upper or lower DC-RSI envelope. When the RSI releases from the DC-RSI envelope, you can take the trade off.
Multi Timeframe RSIThis will show you the RSI of the higher timeframes (up to 1D). Current Timeframe is colored red, higher timeframes are colored from light gray to darker gray (you can change that).
There are several ways to enter a trade:
1. look for rising RSI on higher timeframe (line is stepping up in indicator window), wait for current RSI to decline to oversold (with length 14 its below 30), look for a buy entry (vice versa for a sell setup)
2. look for all RSI timeframes to decline to oversold, this is a good zone to enter a buy (vice versa for a sell setup)
Keep in Mind that a Stochastic Indicator can have it's High/Low befor Price will have it.
Good Luck :)
