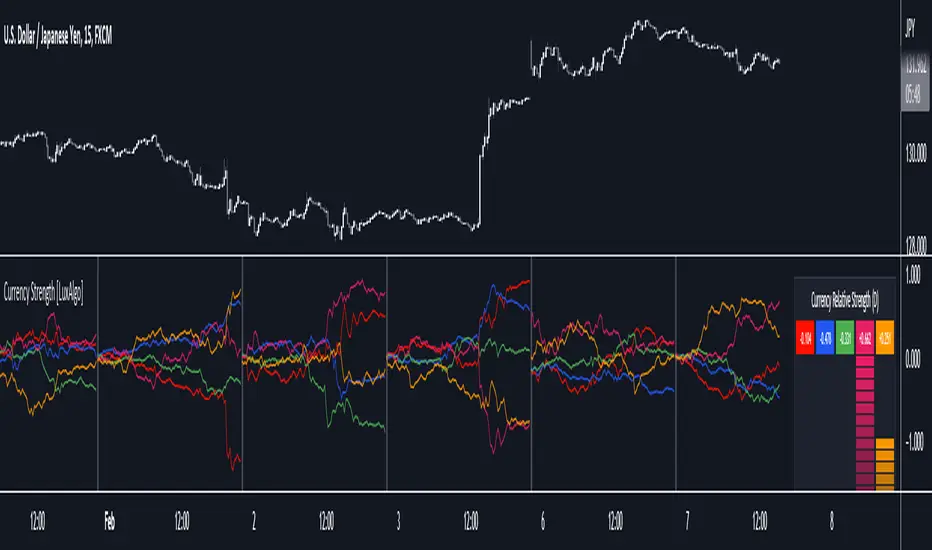
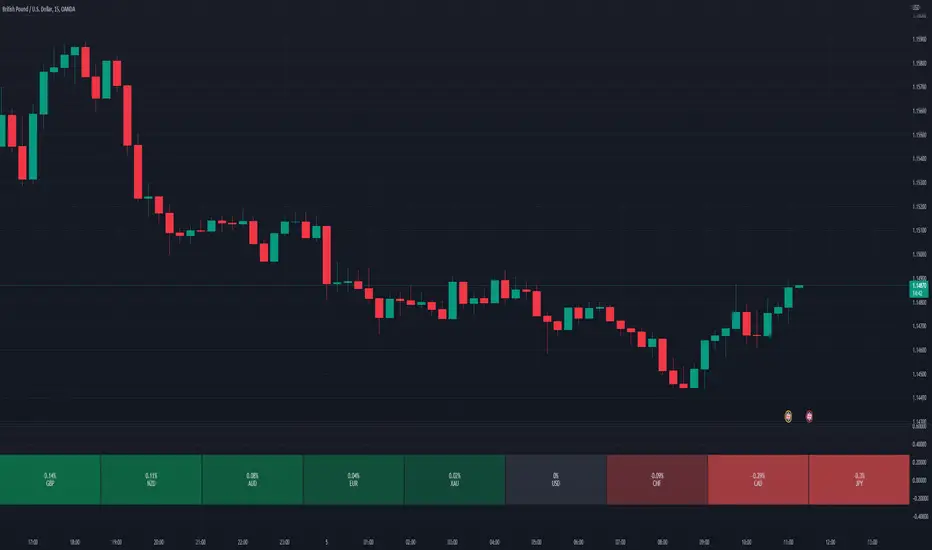
Currency Strength [LuxAlgo]The Currency Strength indicator displays the historical relative strength of 5 user selected currencies over a user selected period of time. Users can also display relative strength of currencies as a scatter plot, further informing on the evolution of currency strength.
🔶 SETTINGS
Display: Determines the type of data displayed by the indicator. By default, the trailing relative strength of currencies is displayed, with the other option displaying the scatter plot.
Timeframe: Timeframe period used to calculate currency relative strength.
🔹 Meter
Show Strength Meter: Displays the currency strength meter on the indicator panel.
Strength Meter Resolution: Resolution of the currency strength meter, higher resolutions allow to observe smaller difference in strength.
Location: Location of the currency strength meter on the indicator pane.
Size: Size of the currency strength meter.
🔹 Relative Strength Scatter Graph
Scatter Graph Resolution: Horizontal and vertical width of the scatter plot (in bars). Higher values allow a more precise position on the X axis.
🔶 USAGE
Measuring the relative strength of a currency allows users to assess the relative performance of a currency against a basket of other currencies.
The term "strength" can convey various interpretations depending on the indicator. Here "strength" is interpreted as an indicator of performance, with stronger currencies having greater performances over the selected period (positive changes of higher magnitude).
The Currency Strength indicator allows users to analyze the relative strength of currencies over a user selected period - the returned results will reset periodically and will accumulate afterward.
The above chart shows the hourly relative strength of various currencies on the 1min TF.
🔹 Scatter Graph
The scatter graph displays the relative strength of a currency over its value during the previous period. This not only allows users to see if a currency is strong... but also if it's getting stronger compared to the previous period.
In order to quickly interpret results, the graph is divided into four areas. A currency (displayed as a point) being in a specific area returns the following information:
Strong(Green): Currency has a positive relative strength (bullish) and is greater than its value over the previous period.
Improving (Yellow): Currency has a negative relative strength (bearish) and is greater than its value over the previous period.
Weakening (Aqua): Currency has a positive relative strength (bullish) and is lower than its value over the previous period.
Weak (Red): Currency has a negative relative strength (bearish) and is lower than its value over the previous period.
🔶 DETAILS
There is a wide variety of methods for the calculation of a currency's relative strength. The primary focus of the indicator is on the meter as well as the relative strength scatter graph. The currency strength calculation can be considered more basic.
Given two currencies, B (base) and Q (quote), the proposed indicator calculation process is as follows:
Exchange rate BQ(t) over time t is obtained, a rising value of BQ(t) means that a unit of B is now worth a higher amount of Q , highlighting strength of B over Q on that precise variation.
The individual relative strength over time IRS(t) is obtained as the percentage relatively close to the open difference of BQ(t) , that is:
IRS(t) = / open(t) * 100
Normalizing the close to open difference allows for the various currencies' relative strengths to approximately share the same scale.
The above operation is performed n times over a space of n currencies O( n ) . The obtained individual relative strengths for one specific currency are then added together, forming the final composite relative strength ( CRS ) of that currency:
CRS (t) = IRS (t) + IRS (t) + ... + IRS (t)
The cumulative sum of CRS(t) over the user selected period is then obtained.
Relativestrength
Stock Relative Strength Power IndexAs always, this is not financial advice and use at your own risk. Trading is risky and can cost you significant sums of money if you are not careful. Make sure you always have a proper entry and exit plan that includes defining your risk before you enter a trade.
This idea recently came out of some discussions I stumbled across in a trading group I am a part of regarding Relative Strength and Relative Weakness (shortened to RS and RW from here on out). The whole mechanism behind this trading system is to filter out underperforming securities relative to the current market direction to be in only the strongest or weakest stocks when the market is currently experiencing a bullish or bearish cycle. The idea behind this is there is no point in parking your money into a stock that is treading water or even going down if the market is making strong moves upwards. At that point, you are at worst losing money, and at best trading equal to the index/ETF, in which case the argument is why are you not just trading the index/ETF instead? RS or RW will filter out these sector laggards and allow you to position yourself into strong (or the strongest) stocks at any given time to help improve portfolio performance. Further, not only does it protect your position should the market shift against you briefly, it also often sees exceptional performance in the same cycle. For example, if $SPY makes a 5% move over the course of a month, a stock with RS/RW may make a 10% move, or more, allowing you to see increased profit potential.
RS/RW is based on the idea of performance, that is the raw percent change of a security over a given time period relative to a benchmark. This benchmark is often the S&P500 (ES/SPX/SPY and their derivatives). I have to stress that this is not beta, which measures the volatility of a stock over a given period (i.e. if $SPY moves $1, $NVDA will often move $1.74). This is a measurement of the market (i.e. $SPY) has moved 1% over the course of a day, $NVDA has moved 8% over the course of the day. This is very often used as a signal of institutional interest as apart from some very unique moments, retail traders cannot and will not provide enough market pressure to move a market outside of a stock's normal trading range, nor will they outperform the sector or market as a whole consistently over time without some big money to make them move. The problem with running strict performance analysis (i.e. % change from period T ago to period T + n at present) is that while it gives us a baseline of how much the stock has moved, it doesn't overall mean much. For instance, if a $100 stock has moved 5% today, but has been experiencing a period of increased volatility and it's Average True Range (ATR) (the amount a stock will move over X number of periods, on average) is $7, performance seems impressive but is actually generally fairly weak to what the stock has been doing recently. Conversely, if we take a second stock, this time worth $20, and it too has moved 5% in one day but has an ATR of only $0.25, that stock has made an exceptional move and we want to be part of that.
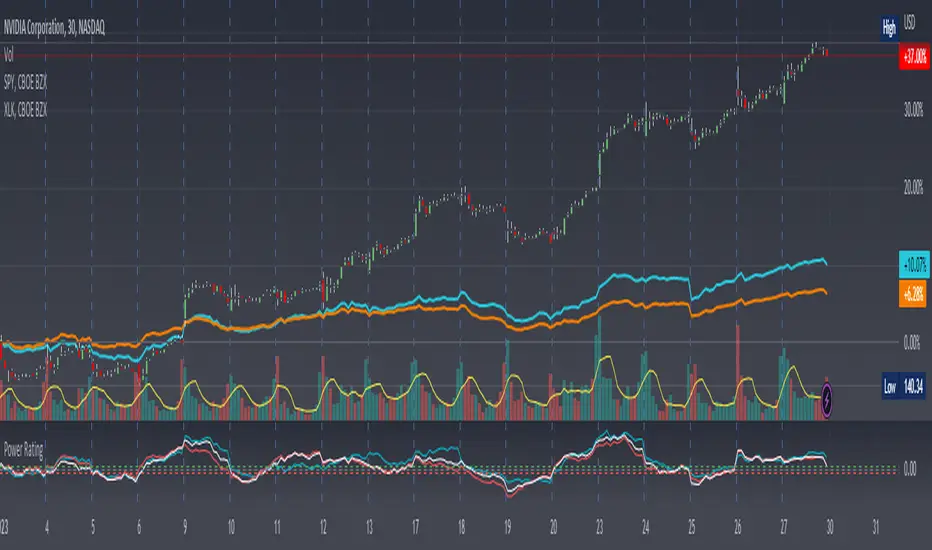
Here, I have created an indicator called the Stock Relative Strength Power Index. This takes the stock's rate of change (ROC) (the % move it has made over X number of periods), the stock's normalized ATR (the ATR represented as a percentage instead of a raw value), and compares these to one another to get the "Power Rating": a representation of the true strength of a stock over X number of periods. The indicator does two things. First, the raw ROC is divided by the stock's normalized ATR to assess whether the stock is moving outside of its normal range of variation or not. Second, since we are interested in trading only stocks with exceptional RS/RW to the market, I have also applied this same calculation to the S&P500 ($SPY) and the various SPDR sector indexes. These comparisons allow for a rapid and accurate assessment of the true strength of a stock at any given time on any given time frame. To cycle back above to our examples, the $100 stock has a Power Rating of only 0.71 (i.e. it is trading less than its current average), while our $20 stock has a Power Rating of 5. If we then compare these to both the market as a whole and the sector that the stock is a part of, we get a much clearer indication of the true buying or selling pressure imposed on the stock at any given time.
Use:
The indicator has 3 lines. The blue line is the security of interest, the red line is the market baseline (i.e. the sector ETF $SPY), and the white line is the sector index. I have given an example above on the semiconductor/tech stock $NVDA on a 30min timeframe. You can see that since the start of 2023, $NVDA has generally been strong to the market and its own sector since the blue line is greater than both the red and white lines over many days. This would have provided some nice day trading opportunities, or even some nice short term swing trades. The values themselves are generally meaningless outside of either the 1 or -1 value lines. All that matters is that the current ticker is surpassing both the market and the sector while being > 1.0 for a long trade or less than -1.0 for a short trade. However, I must stress this indicator gives no trade signals on its own, it is purely a confirmation indicator. An example of a trade would be if you had a trade signal given by either an indicator or by price action suggesting to buy some $NVDA for a trade to the upside, the Power Rating indicator would confirm this by showing if $NVDA was actually showing true strength by being both greater than 1 (the cutoff for it surpassing its ATR) and being above both the red and white lines. Further, you can see $NVDA has been stronger than the market when using the comparison function as well, but the has fluxed in and out of strength intraday when using the actual indicator vs. the static performance ratio chart (plotted as line graphs on the chart).
I have made it possible to change the colour of the plots and the line levels. The adjustment of the line levels gives the trader the flexibility to change their target breakout level (i.e. only trading stocks that have a Power Rating > 2, for example, meaning they are trading at least 2X their normal trading range). The third security comparison is flexible and can be used to compare to the sector ETF (initial intention) or it can be used to compare to other tickers within the same sector, for example. The trader should select the appropriate ETF for the given security of interest to avoid false confirmation if they want to use an ETF as their third input. The proper sector should be readily available on most online websites and accessible in a matter of seconds meaning that the delay is minimal, at worst. If a trader wishes to add additional functionality, such as a crypto trader using BTCUSD as the benchmark instead of $SPY, I encourage them to copy and paste this script and modify as needed since I have made this open source.
This indicator works on all timeframes. The lookback period can be changed, so a day trader who may use a 5min chart (and use a period of 12 to get the hourly Power Rating) will find this equally useful as someone who may be a core trader who wants to look at the performance over the course of years and may use a 60 period on a monthly chart.
Happy trading and I hope this helps!
RSI Pull-BackA pull-back occurs whenever the price or the value of an indicator breaks a line and comes back to test it before continuing in the prevailing trend.
The RSI has oversold and overbought levels such as 20 and 80 and whenever the market breaks them returns to normality, we can await a pull-back to them before the reversal continues.
This indicator shows the following signals:
* A bullish signal is generated whenever the RSI surpasses the chosen oversold level then directly shapes a pull-back to it without breaking it again.
* A bearish signal is generated whenever the RSI breaks the chosen overbought level then directly shapes a pull-back to it without surpassing it again.

Relative Strength/Weakness ArrowsHello everyone,
This Script is designed to show relative strength or relative weakness. It takes the stock your looking at and compares it to the sector it is in and to SPY. It evaluates strength or weakness on every candle. In this specific script it is only designed for the communications sector(XLC), so all the names I have inputted into the script fall within XLC. It works for all timeframes. It really helps me stay in trades longer as even though stock might be consolidating it can still be weak, making me more confident in holding. Each green arrow shows that the stock is relatively strong compared to SPY and its SECTOR, in this case, XLC. Each red arrow means that the stock is relatively weak to the market and its sector. When there are no arrows on the candles, then the stock is following the market and its sector. Tell me what yall think.
Just add it to your chart, go to any of the stocks within XLC and it will populate arrows based on relative strength and relative weakness. The weakness and strength is based on movement of price using ATR. So if the price of the stock is moving up and so is the sector it will only populate based on how large the move is. So if SPY had ATR of 1 and it moved up .50c that means the stock you're looking at would need to move more than .50c in the same candle if it also had an ATR or 1.
You can add or delete tickers in the code by going to the list of symbols and adding or removing them. Just remember that if you add a stock that doesn't fall within XLC then the arrows wont represent strength/weakness properly.

RSI DivergenceWhat is "RSI Divergence"?
"RSI Divergence" is a indicator that find RSI divergence automatically.
What it does?
When it finds an RSI divergence, it draws a line on the indicator.
How it does it?
The lines are found using the least squares method. If the signs of the linear regression on the graph and the linear regression plotted on the RSI are different, this is considered divergence.
How to use it?
RSI lenght = RSI lenght
source = source of RSI
RSI Divergence Lenght = lenght of lines that draws on indicator
zoom = zoom
examples:

RSI Objective LinesThe RSI is a contrarian indicator bounded between 0 and 100 where values close to the area of 30 represent an oversold condition and values close to the area of 70 represent an overbought condition.
Generally, we use the area of 70/75 and the area of 30/25 as extremes that signal a market reversal or a correction. But what if we calculate a simple way to make these levels more dynamic?
The main idea from these objective support and resistance levels is that market regime and dynamics move and as such fixed levels are unlikely to always provide value which means that we can try creating variable levels. The objective support and resistance levels are created following these steps:
* Calculate a 14-period RSI on the close price, let's call this RSI_Close.
* Calculate a 14-period RSI on the high price, let's call this RSI_High.
* Calculate a 14-period RSI on the low price, let's call this RSI_Low.
* Calculate the maximum range which is the highest value of RSI_High in the last 200 periods minus the lowest value of RSI_Low in the last 200 periods. Let's call this Max_Range
* Define the range width. By default, it is set to 5%. Let's call this Threshold.
* The objective support is calculated as the sum of the RSI_Low + (Max_Range * Threshold).
* The objective resistance is calculated as the sum of the RSI_High - (Max_Range * Threshold).
The levels are used in the same way as the oversold and overbought levels. They are more dynamic as they take into account the fluctuations of the RSI so you might see at some point in time a support at 20 and at another at 35.

RSI & BB QQE Mod (highlight)This script is a combination of the RSI, QQE and BB
Here is an explanation on how I combined them, and how they are used:
- RSI (Relative Strength Index)
- Display a smoothed version of the RSI to identify "oversold" and "overbought" market phases
- Used to calculate a QQE
- QQE (Quantitative Qualitative Estimation)
- Used to identify trend direction and trend strength
- Used to set a basis for the BB
- BB (Bollinger Bands)
- Used with QQE as a basis to determine a relative definition of "high RSI" and "low RSI"
- Used with QQE as a basis to determine the volatility of the RSI at a given moment
- Used to predict pivot points
Here are the main signals:
- When "RSI Smoothed" line above the Upper BB then "RSI Smoothed" line turns green
- Also , display green background color highlight
- Also , and if "RSI Smoothed" is above the overbought line then display a second green background color highlight
- When "RSI Smoothed" line bellow the Lower BB then "RSI Smoothed" line turns red
- Also , display red background color highlight
- Also , and if "RSI Smoothed" is bellow the oversold line then display a second red background color highlight
A tool codded to be aesthetically pleasing and VERY customisable:
- Designed for both light theme and dark theme users
- Value can be easily modified in the settings
- Colors can be easily swapped in the settings
- Opacity of "fill" & "bgcolor" regrouped as a single input
A tool codded to be easy to read and to learn from:
- Sources and inspirations all listed within the script
- Structure easily identifiable (to understand with little to no effort how the script works)
Notes :
- This script is lagging, because of that I do recommend using it on relatively large timeframe
- This script is OpenSource, feel free to reuse it, but if so please remember to include a link to my script in your sources
- This script is not a magical tool, use at your own risk

Outback RSI & Hull [TTF]This indicator was originally made to help users following along with one of our strategies that we call The Outback (hence the name).
One of the component indicators of that strategy is an RSI with a Hull Moving Average added on top of the RSI as an additional reference for the momentum of the RSI. Many people either had difficulty setting this up correctly, or were having issues with the Indicator on Indicator component, so we built this indicator to assist in that regard.
As we continued to use it, we found it to be a pretty sound momentum indicator that had much to offer by enhancing the more normal RSI, and wanted to make this indicator generally available to the public.
The basic premise of this indicator is as follows:
The core is a traditional RSI with a "normal" (usually Simple) moving average
The "secret sauce" is adding a 2nd moving average (a Hull Moving Average, inspired by Insilico's awesome Hull Suite) based off the RSI
By leveraging the RSI's position relative to both the Simple and Hull moving averages, you can better gauge the relative strength of the current momentum, as well as better visualize longer-term momentum direction and strength based on the moving average slopes and direction.

Double RSI TrendThis is my Double RSI Trend Indicator. It issues Buy and Sell signals based on the Supertrend and a double RSI . The RSIs cross near or at the same time as the Supertrend fires. It has the ability to change if you want signals based on the RSI cross on the same candle, one candle before, and two candles before. I find this one extremely good at catching reversals as long as you filter out some of the signals based on trend.

two_leg_spread_diffThis script helps you discern the relative change of each leg in a two-legged spread over a given period. The main plot is a difference in log return over the number of bars identified by the "lag" parameter. E.g. if "lag" is 10 and leg one has increased 3% over the past ten bars, while leg two has only increased 1%, the plot value is 2%. The main plot is also colored blue when leg one increases while leg two decreases on a given bar, and red if the opposite is true. This feature identifies periods where the correlation between the two legs diminishes. The one and two standard deviation of the main plot is also plotted in faint background lines. Additionally, a table indicates the percentage in which the main plot is within one standard deviation (acc 1) and two standard deviations (acc 2). Note that the standard deviation updates on each bar, so the current standard deviation is not the one used to calculate the accuracy. Rather, if there are N bars, N different standard deviation readings have been used to compute the accuracy statistics.
The inputs are:
- timeframe: the timeframe of the chart
- leg1_sym: the symbol of the first leg
- leg2_sym: the symbol of the second leg
- lag: the number of bars back to reference for computing the log return of each leg
- anchor_to_session_start: for intraday charts only, this overwrites the "lag" input so that the "lag" always sets the point of comparison to the session start. This setting is used to compute the relative change over a single session.

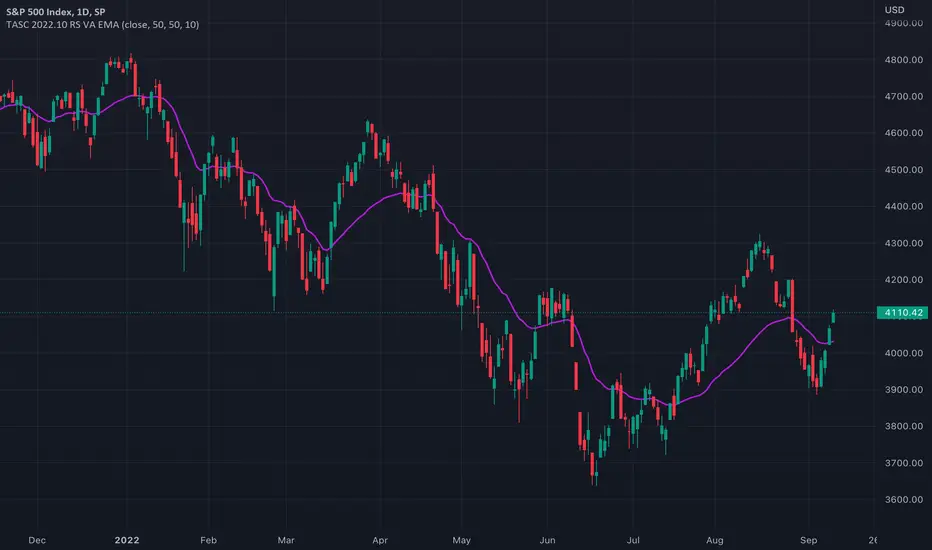
TASC 2022.10 RS VA EMA█ OVERVIEW
TASC's October 2022 edition Traders' Tips includes the second part of the "Relative Strength Moving Averages" article series authored by Vitali Apirine. This is the code that implements the Relative Strength Volume-Adjusted Exponential Moving Average (RS VA EMA) presented in this publication.
█ CONCEPTS
In his article series, the author argues that the relative strength of price, volume, and volatility can potentially be used to filter price movements and define turning points. In particular, the RS VA EMA indicator is designed to account for the relative strength of volume. Like the traditional exponential moving average (EMA) , it is a lagging trend-following indicator. The difference is that it responds more quickly.
In a trading strategy, RS VA EMA is suggested to be used in combination with EMA of the same length to determine the overall trend or in combination with RS VA EMA of a different length to identify turning points and filter price movements.
█ CALCULATIONS
The calculation of RS VA EMA is based on the concept of volume strength (VS). By definition, VS measures the difference between "positive" and "negative" volume flow. Volume is indicated as "positive" when the close is higher than the previous close and "negative" when the close is below the previous close.
The following steps are used in the calculation process:
• Calculate the volume strength (VS) of a given length.
• Multiply VS by a predefined multiplier and calculate the EMA of the resulting time series.
The values of 10,10,10 are the typical input settings for RS VA EMA, where the first parameter is the length of the moving average, the second is the length of VS, and the third is the volume strength multiplier.
two_leg_spread_returns_zscoreThis script helps assess the relative returns of each leg in a two-legged spread. It shows the z-score of each period's returns, along with a moving average of the difference between the two returns. A negative moving average implies that the second leg is strengthening, on a relative return basis, against the first leg, and vice versa. The inputs are:
- timeframe: the timeframe for the calculations. the default is five minutes.
- leg1_sym: the symbol for the first leg
- leg2_sym: the symbol for the second leg
- ma_length: the length of the moving average. by default it is 48, or the previous four hours, given the default timeframe.
The default symbols are RB and HO, simply as an example of an intercommodity spread.

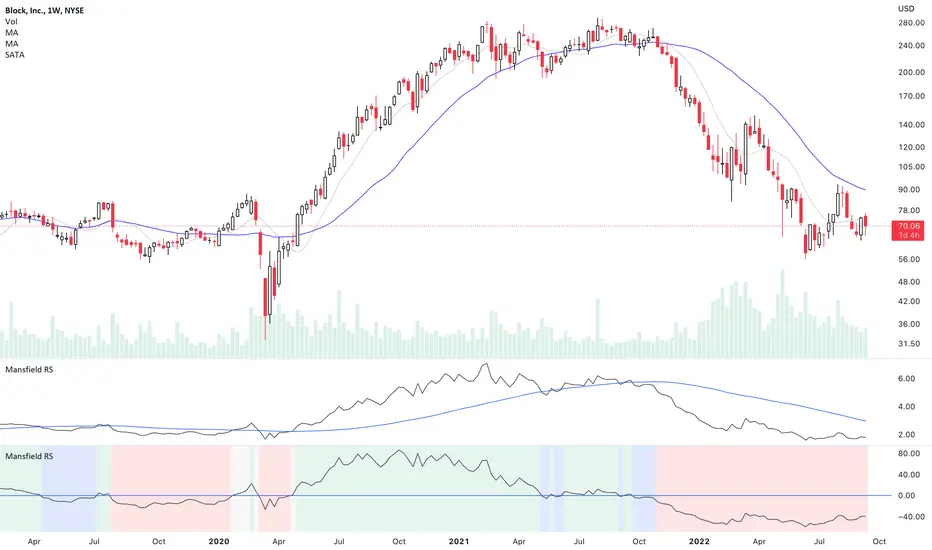
Mansfield Relative Strength (Original Version) by stageanalysisThe Mansfield Relative Strength ( Mansfield RS ) is one of the core components of the Stan Weinstein's Stage Analysis method as discussed in his classic book Stan Weinstein's Secrets for Profiting in Bull and Bear Markets .
The Mansfield RS measures the relative performance of the stock compared to an index such as the S&P 500, or to another stock etc.
However, this should not to be confused with the popular RSI (Relative Strength Index developed J. Welles Wilder), which is a momentum oscillator that measures the speed and change of price movements on a single stock.
The Mansfield RS indicator consists of the Relative Strength comparison line versus the S&P 500 (default universal setting, but can be edited), and the "Zero Line" – which is the 52 week MA of the Relative Strength line, that's been flattened to create the oscillator style.
How to use the Indicator:
Outperforming – Above the Zero Line
When the Relative Strength line crosses above the Zero Line (it's flattened 52 week RS MA), it is outperforming the index or stock that it's comparing against, and so it is showing stronger relative strength.
Underperforming – Below the Zero Line
When the Relative Strength line crosses below the Zero Line (it's flattened 52 week RS MA), it is underperforming the index or stock that it's comparing against, and so it is showing weaker relative strength.
Settings:
When you first add the indicator is has a coloured background, with a green tint for a postive RS score, and a red tint for a negative RS score. However, this can be turned off, or edited in the indicator settings, in the Style tab. So you can change the colors or remove it and just have the RS line and zero line showing. Both of which can also be edited in the settings.
Change the symbol that it compares against. The default is the S&P 500. But for crypto you might want to use Bitcoin for example. Or you might want to compare against competing stocks in the same peer group, or against the industry group or sector. The choice is yours. But the S&P 500 is a universal measure for the Mansfield RS. So I would recommend leaving it on that unless you have a particular reason to change it as mentioned.
MA Length is also an editable setting. This creates the Zero Line. So it will affect the values of the Mansfield RS if you change it. 52 is the default setting, and is set as such for the weekly chart. So I'd recommend not editing it on the weekly chart, but for other timeframes, different settings can be used.
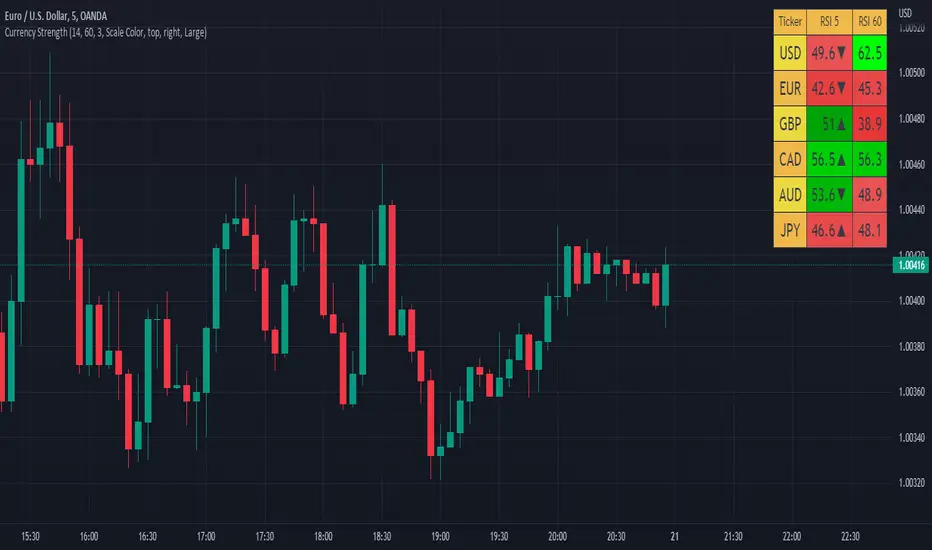
Relative Perfomance IndexHello Traders.
Lets keep it simple..
1. Take the major pairs that have USD in them and watch their change over a specific timeframe.
2. Now lets sort these changes of each pair from the most positive to the most negative.
Good, I see you have some ideas already.
This is exactly what this indicator does. You will visualize the biggest change in pairs of the timeframe of your choice and from this you can decide on pairs that you want to trade.
RSI mid partition color changeWhen RSI is above 50 our default bias is on buy side and when below 50 our bias is on sell side.
Therefore created 2 zones for easy identification.
Currency Strength V2An update to my original Currency Strength script to include a 2nd timeframe for more market context.
Changed the formatting slightly for better aesthetics, as the extra column and colors became unsightly.
Also added a new setting for "Flat Color", which changes the value background to a simple green/red for above or below 50, rather than using the Color Scale that increases color intensity the further it gets from 50.
________________________________________________________________________________
This script measures the strength of the 6 major currencies USD, EUR, GBP, CAD, AUD and JPY.
Simply, it averages the RSI values of a currency vs the 5 other currencies in the basket, and displays each average RSI value in a table with color coding to quickly identify the strongest and weakest currencies over the past 14 bars (or user defined length).
The arrow in the current RSI column shows the difference in average RSI value between current and X bars back (user defined), telling you whether the combined RSI value has gone up or down in the last X bars.
Using the average RSI allows us to get a sense of the currency strength vs an equally weighted basket of the other majors, as opposed to using Indexes which are heavily weighted to 1 or 2 currencies.
The additional security calls for the extra timeframe make this slower to load than the original, but this was a user request so hopefully it will prove worthwhile for some people.
Those who find the loading too slow when switching between charts may be better off still using the original, which is why this is posted as a separate script and not an update to the original.
This is the table with Flat Color option enabled.
Dynamic Relative StrengthMainly this indicator is a Relative strength indicator which tells us about the strength of a scrip as compared to an index . That is it outperforming the index or underperforming . Outperformance signifies Strength and Under performance signifies Weakness .Inspired from Bharat trader's Relative Strength of a stock , but changing the period for all time frames is a hassle so i have set 10 period for Monthly and 52 period for Weekly. As for monthly we need around 10 months data or we can use 12 as 1 year has 12 months but 10 works best . used 52 period for Weekly time frame because there are 52 weeks in a year. These values are by default dynamically applied to the indicator when weekly or monthly timeframes are chosen . Daily Period can be chosen as per anyone's need . As can be seen in provided screenshot , that the stock has recently started gaining strength on weekly a compared to Small cap100 index . So we can conclude that it has more strength than the overall index it is representing so more chances of outperformance will be there.

PharshK RSI and Zigzag with H/LIt is with RSI level
and Zigzag Pattern that Market goes on Maximum level and Lower Level
And it is also Showing High and Law Level of last Moving Candle so it is easy to entry and Hold

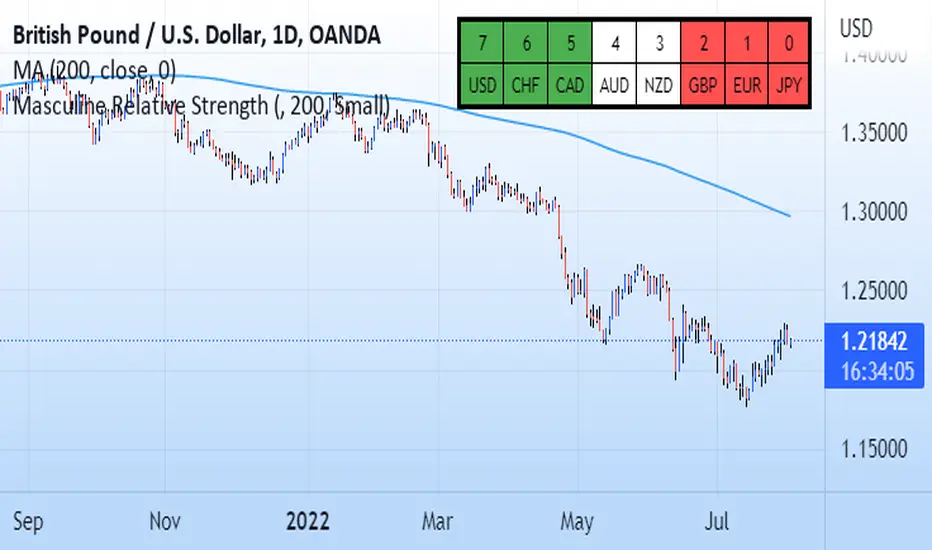
Masculine Relative StrengthThis relative strength indicator compares the G8 currencies against each other in all 28 combinations. It uses the 200 period moving average as a scoring system. For example on eurusd if current price action is above the MA that is +1 for the eur and -1 for the dollar and the inverse is applied if current price is under the 200 ma. The higher the number the stronger the currency. The weaker the number the weaker the currency. Pair the strongest currency with the weakest. This indicator does not guarentee profits and past performance does not guarentee the same future results.
Banknifty Volume - IN
This simple indicator computes the average Relative Strength Index of each Banknifty stock and displays the volume on the chart with color schemes while the average line indicates the average RSI of all Bank Stocks. This indicator works on Banknifty and its stocks.
It works on all time frames
How You can use this?
You can use this indicator for Volume analysis if the average RSI line is above the 0 line, the stock is moving upside and vice versa for Downside .

Candle Strength IndicatorThe candle strength indicator depicts the average strength of the price action by evaluating bullish vs bearish candles.
The scale is relative to price fluctuation and the size of the candles for the particular ticker / market, so there are no significant levels.
A cross on the zero line would generally indicate a change in trend / sentiment.
This indicator may be useful as a filter for entries and use in confluence with other indicators.

RS Compare IndicatorRelative Strength Breakout is always a great indicator of change in trends. This indicator is a visual attempt to show the region of outperformance of a stock with respect to a sector or primary indicator.
The color indicated should read as below
1) Color Red: Indicates that the selected script is underperforming the indexing with which it is compared
2) Color Yellow: Indicates that the selected script is as per the indexing with which it is compared.
3) Color Green: Indicates that the script is outperforming the indexing with which it is compared.

Overlay Mini Plot(s) of Correlated Asset(s)Overlay a small plot of a correlated asset of your choosing. Shrink/expand, Set vertical and horizontal position, plot multiple mini-plots via duplicate indicators with varied settings.
Plots the last X bars of any asset; including the live candle currently painting
Useful for low time frame trading when you want to see correlated asset price movement right alongside the price movement you're watching.
Useful for quick and simple comparisons; when you don't want the clutter of split screen or multi-pane view.
Useful for backtesting.
Price scale agnostic; just plots the shape of the recent price action, with several optional labels: Asset+timeframe | Live Price | Highest price over X bars | Lowest price over X bars.
Works fine with all the assets i've tested it on.
~~User inputs~~
-number of bars to paint.
-horizontal offset: plot to right X bars or to left X bars
-vertical offset: shift up or down, shrink or expand; by using 2 'spacer' inputs
-color/transparancy of candles and price labels.
-width (pixels) of candle bodies.
-choose to display price labels or not
-choose to display asset label or not
~~Tips~~
--Add several of these indicators; changing the vertical 'Shift/Shrink' settings on each to visually separate them.
--In the above chart or EurUsd, there are three indicators =>> three mini-plots overlaid: DXY, EurGbp and GbpUsd. Using the following settings for Space Above:Space Below: DXY- 0.1:4.5 | EurGbp- 1.8:1.8 | GbpUsd- 4.5:0.1
--the more you add, the more you'll have to vertically shrink the plots
© twingall
