Renko RSIThe goal of this indicator is to plot the RSI values "as if" the chart is a true price action based Renko chart. It can be used on a time series chart or Renko series chart. The RSI is derived from the raw price action of a time-based chart, where the historic and live price is clustered into Renko bricks. The Renko brick production algorithm is entirely backed by Renko Price Bars Overlay and thoroughly tested.
The algorithm takes into account rapid brick production within a single time candle and adjusts accordingly. The output may vary slightly between different chart time frames for the same indicator settings, but this is due to the lack of price fluctuation visibility that can occur in higher chart time frames. If the brick tick size is low, an appropriate chart interval should be selected that maximizes the amount of price volatility visible to the indicator. A bad setting would be something like a 1 tick EURUSD Renko setting on an H4 chart, there simply is no way to derive the exact and ordered price fluctuations in a single H4 candle, 1 pip at a time. A more appropriate chart time frame would be 1-3 minutes for this selected Renko brick size.
Plots user specified RSI based on Renko bricks. This would be the same (or very close to) the RSI viewed on a normal Renko chart based on price action alone.
Works well with Renko Price Bars Overlay script.
See also: Renko Trend Momentum
Renkochart

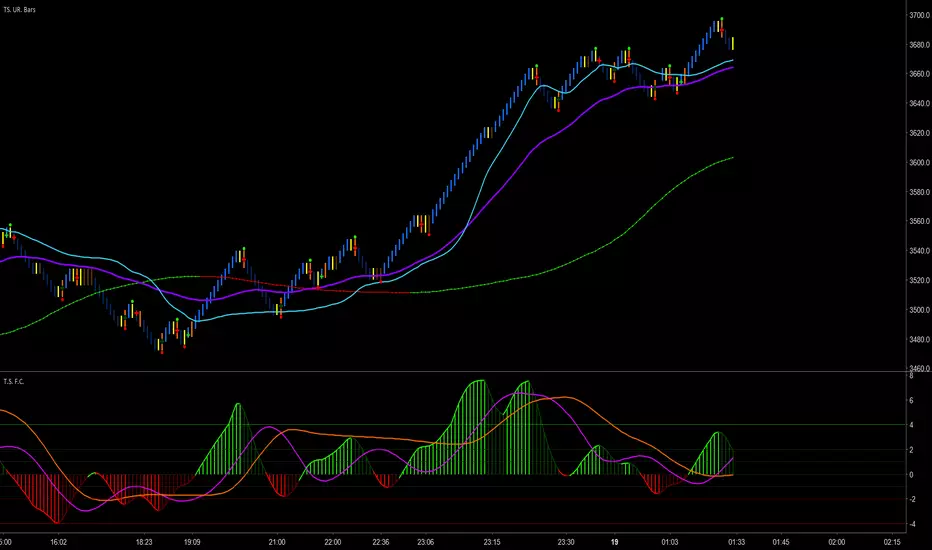
Renko Trend MomentumA momentum indicator that shows bulls vs bears strength of renko brick production. The algorithm takes into account rapid brick production within a single time candle and adjust accordingly. The output may vary slightly between different chart time frames for the same indicator settings, but this is due to the lack of price fluctuation visibility that can occur in higher chart time frames. If the brick tick size is low, an appropriate chart interval should be selected that maximizes the amount of price volatility visible to the indicator.
Plots the normalized rate of new Renko Up Brick production vs new Renko Down Brick production.
Custom crossover threshold to help prevent whipsaws and keep you in the trend.
Shows pending areas when a crossover is imminent.
Custom time-based buffer combined with a crossover to keep you in the trend.
Shows crossover background color changes when the direction of the Renko Trend changes.
Works well with Renko Price Bars Overlay script.

Morpheus Renko Chart Overlay by ZekisRenko is very useful in many strategies, but Tradingview does not support original Renko charts, where time is 0 and the single variable is the price action
This script can overlay the normal Candles Chart with Renko bricks and behaves like an original Renko brick formula
This is a simple way of looking at a Renko Chart inside a normal Candles Chart
You need to adjust the value manualy, like in Traditional Renko
If a price goes up by that value, new brick is formed with green color, vice versa for the down side
I filled bricks with red and green for a better view
Added Long and Short signs
Added alerts
(Original script wrote by Richard Santos and modified by Ni6HTH4wK)
Enjoy!
@Zekis

Stochastic RSI Momentum TranformThis is my version of Stochastic RSI, but not the stochastic RSI alone, hell no, it's a lagging indicator, I don't like lagging indicators.
This is a leading indicator that has momentum calculations in it and not only that, it has a momentum shifting calculation based on modified ehler's transformation !
Simple for user, a hell to program !
Price and how to get access to ? contact me in PM !

Trader Set - Modified MTF BOTTOMThis is a modified formula for MFT. It's prefabricated with numbers that would work best with my methodology and system.
Please don't ask for getting access. Only my students can get access to these indicators.
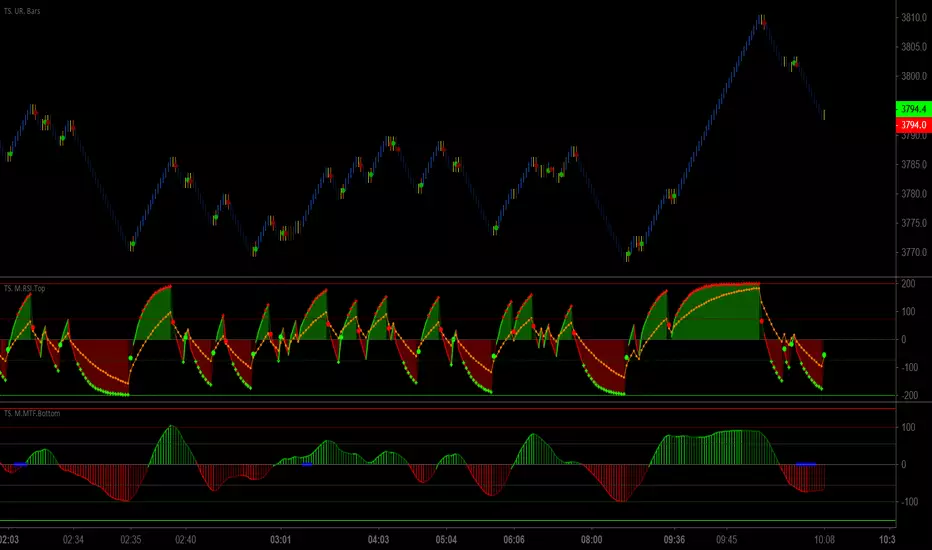
Trader Set - Modified RSI TOPThis is a modified RSI formula that draws two different RSI time frames on top of eachother with additional signal points on it.
Please don't ask for getting access. Only my students can have access to these tools because they are part of my methodology and prefabricated with fixed numbers that would work ONLY on my system.
Trader Set - Modified RSI MTFThis is a modified version of RSI MTF, a similar indicator can be found in public library if anyone is interested, mine, is fabricated to work with my methology with all the addition i will add to this (just like others when i added the ability to change the moving types in critical places of formula) so that students can experiment with them (it will come in next version). also, I normalize both sections for better visualization.
Please don't ask me for getting access. "CM Modified RSI MFI" search it for the base and almost similar indicator without my additions. This script will be available only for my students at the time being. like other scripts, if the learning material will be ready i will be announce in comment section, and like others, again, if i decide to sell this separated from courses i will announce in the comment section too.
Trader Set - Fisher CycleUnfortunately, the fihser transform's formula has specifications that are not compatible with newer versions of pine script (calling mutable variables on security function).
So, I had to separate this section of "Cycle" script to it's own little world and remove the versioning from the script.
That, means that i can't even write the name of the oscillator on the right hand side (show_last is not there in older versions).
Welcome to the world of pine script and haphazard updates of trading view without thinking about consequences of their new move !
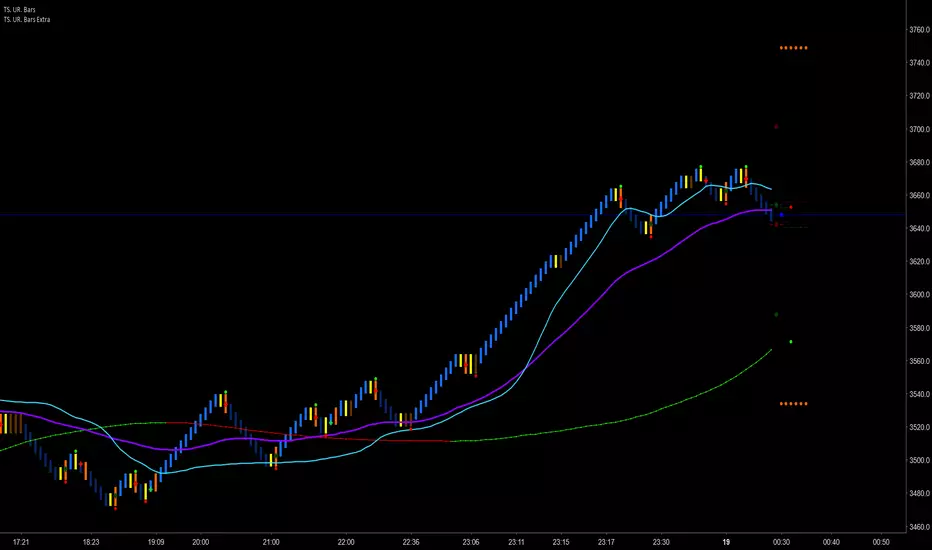
Trader Set - Uni Renko Bars ExtraThis is the separated script from original Uni Renko script. The main reason for this separation is that Trading View limits the user on plotting stuff to 64 plots, the Uni Renko script was so full that even a single more plot was impossible, so, separation came and now if i want to add any feature to this, it's possible.
Aphrodite Renko Up and Down by ZekisA simple renko script with bar and background colored
In this way ups and downs can be seen more easily
Alerts are added for buy/sell, long/short
Possibility to show bricks colours and background colours, according to the market situation

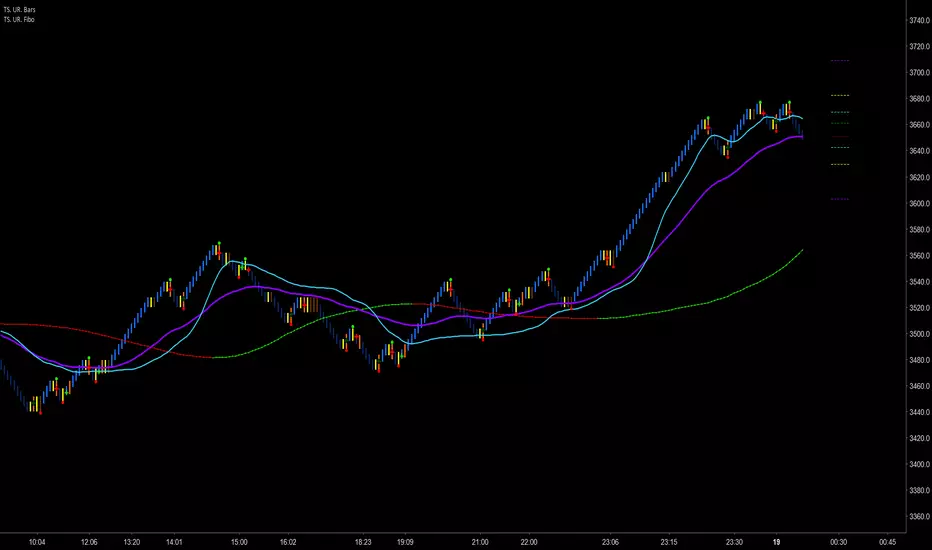
Trader Set - Uni Renko FiboThis is an addition for Uni Renko Chart. You can see it on the right hand side of the chart. It adds few extra levels calculated by fibo values. These levels have different usages.
To use this, you should set your chart on Renko, Traditional with box size of 3.
Please, don't ask for access, only my students from my classes will have access to this indicator, at least for time being. If at any time in future I wish to sell, you will find the price and how to buy in the comments bellow.
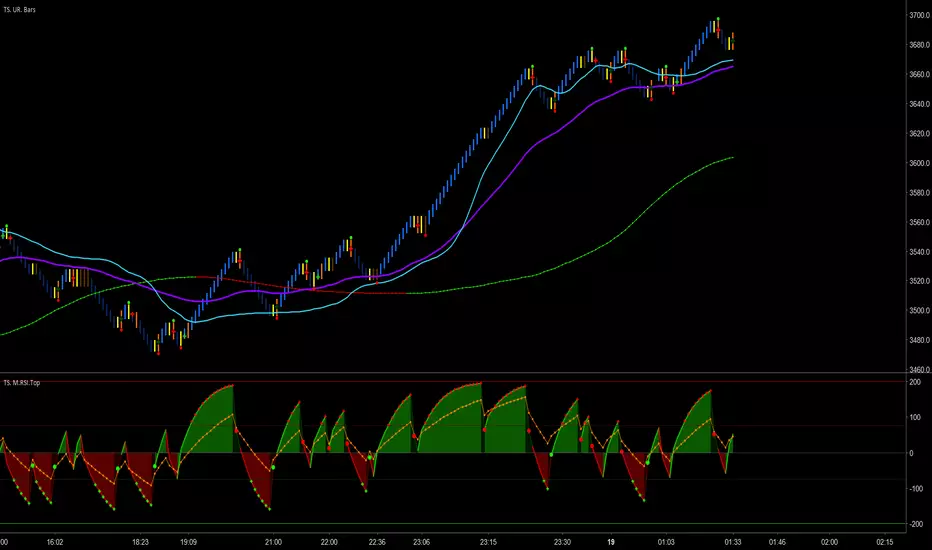
Trader Set - Uni Renko MCCIThis is what Woodie calls MCCI, a band of moving averages.
The name MCCI means Moving Commodity Channel Index, although it's one of the rare woodies original indicators (shame on you woodie lol) he suggests that the relation between the bars or price with the bands are something like the movement of the CCI indicator. I can't accept that. For me, these bands have other usages that I teach to my students.
To use this, you should set your chart on Renko, Traditional with box size of 3.
Please, don't ask for access, only my students from my classes will have access to this indicator, at least for time being. If at any time in future I wish to sell, you will find the price and how to buy in the comments bellow.

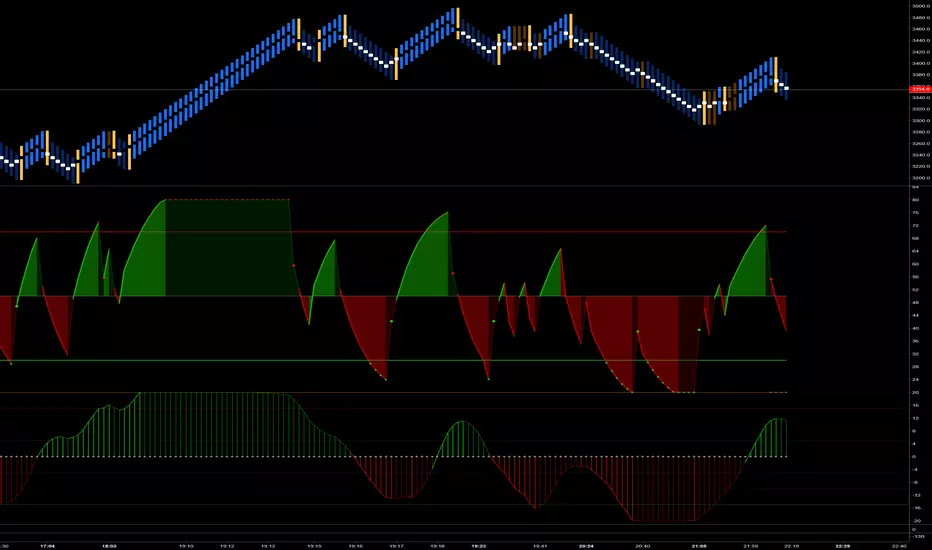
Trader Set - Uni Renko BarsBefore we start, to Trading View Developers :
1- Give us a command to get projection bar's current value, close gives the last bar's closed value not the real time market price
2- Why indicators and Oscillators can't update themselves on the projection values? It doesn't make sense, YOU are drawing the projection but won't let indicators / Oscillators update during that time?
3- Give us a damn section in category list for things like this, there was not category for a custom chart type !
Ufff, now that I took those words out of my system,
Here is the story,
few months ago (read it 10 months) I found about Woodie's indicators in Ninja Trader. At the time I didn't know the exact name for the type of charting he was using, all I knew was one sentence he said, it's based on a median renko chart (well, he told different things in different places, but this one was accurate). So? I started a huge R&D, lots of nights with head aches and not sleeping. Finding the exact formula HE was using was a nightmare. When I was close to the end of road in developing this chart type, I found in futures.io forum that Woodie got the IDEA from another member of futures.io, at least now I new that these charts are called Uni Renko Charts. But the image in the forum was not what you would see in ninja trader, also, they ask for 100$ for elite membership, I was so close in solving the equation myself that it was not worth paying it.
At the end I was successful thanks to another script I found in trading view! The formula for drawing the bar was not what the guy was using, but the heart of this system, the smoother price per bar... It was there.
At the end of the road, that few lines of code was the only thing I could find, the dynamic trend ( Purple Crosses in picture ) for example, was a nightmare to make. What woodie had made no sense to be used as trailing stop, the stop would be hit by market so late that you would loose most of the profit, at the same time, during the retraces is the trend, it would be easily hunted !!! That was the clue for me to look for something by myself.
At the end of the road, after 10 months of R&D, without a solid source of information, I got it working.
To use this, you should set your chart on Renko, Traditional with box size of 3.
Please, don't ask for access, only my students from my classes will have access to this indicator, at least for time being. If at any time in future I wish to sell, you will find the price and how to buy in the comments bellow.

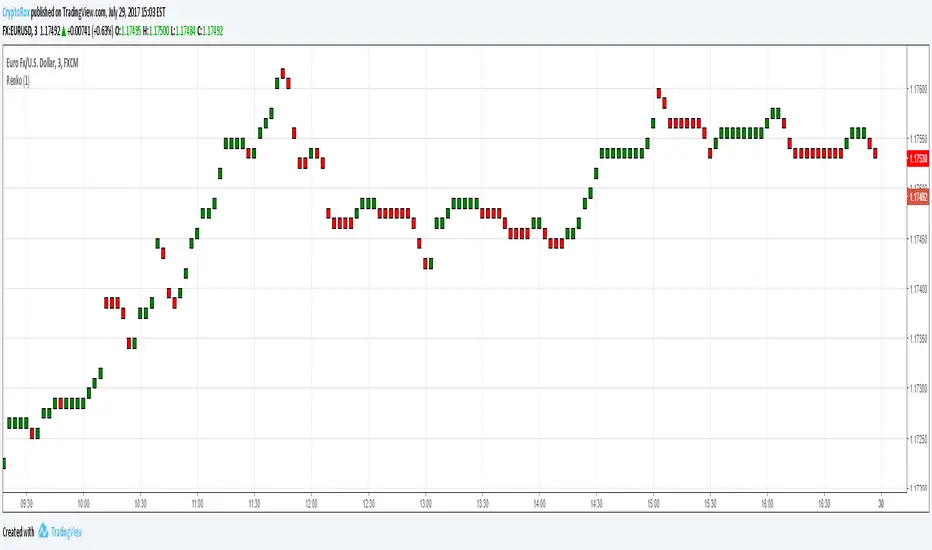
Renko CandlesticksRenko charts are awesome . They reduce noise by only painting a brick on the chart when price moves by a specified amount up/down. When the price reverses, it must go twice the specified amount before a brick is painted. Time is not a factor, just price movement. Sometimes however, you want the pros of a renko chart, but on a regular candlestick chart. This indicator attempts to do just that.
A band is placed around price action showing the upper and lower bounds of what would be the current renko brick. The band only goes up/down when the price action itself moves up/down by the amount you specify. There are several ways of specifying the amount:
Fixed Price Amount: As the name says, you enter the brick size amount, i.e. the amount the price has to move before being in a new brick.
% of Price: This method will calculate the amount the price has to move as a percentage of the price itself. This way as price goes up/down, your brick size will adjust accordingly. Recommended values would be around 1% or less.
% of ATR: This option will make the brick size a percentage of the Average True Range. You can specify the ATR time frame to be different from your current time frame as well as the ATR length. For instance you could be on a 10 minute chart but specify the ATR to be daily with a length of 3 and a percentage amount of 15. This would make your brick size 15% of the Average True Range for the last 3 days. Recommended values are 10 to 20%.
Use this indicator on any time frame, even the 1 minute as the renko bands span the price action the same way on any time frame easily letting you know whether or not the price has moved appreciably, regardless of how much time has passed.
You can also set alerts easily, simply set the alert to crossing and choose “Renko Candlesticks” instead of “Value”. You will then see the options for the renko upper and lower bounds.
Tested on Bitcoin with the following values:
Fixed Price Amount: 30 ($30)
% of Price: 0.45 (if Bitcoin is $7000 then the brick size would be $31.50)
% of ATR: 15%, ATR Time Frame: 1D, ATR Length: 3 (3 days)

Renko Price Bars Overlay// Shows the price renko bars (or range bars) instead of the PERIOD renko
// bars that are integrated into Trading View. The normal renko bars that
// Trading View offers only consider the drawing of a new brick when the
// price closes above or below the required brick size. This can produce
// misleading charts since depending on the time interval of a chart, new
// bricks may or may not be drawn. True price renko bars will draw a new
// brick immediately upon the price exceeding the next target brick size.
// When running this script in "Traditional" mode, the painting of the
// brick overlay band is INDEPENDENT of the chart interval. If price
// exceeds the required target price for the next brick, the band is
// updated immediately, instead of waiting for the price bar on the chart
// interval to close first. The brick starting anchor point will attempt
// to be a "nice number" at a round interval for the chart ticker. For
// example, if viewing EURUSD with the box size equal to 50 ticks/pips,
// the open and close prices will take the form of 1.2100, 1.2150, 1.2200,
// 1.2250, and so on. This is the same behavior as the normal traditional
// Renko bars in Trading View and other major trading platforms such as
// Meta Trader.
// Use the tick size in traditional mode to specify the block size, in
// ticks. This may give interesting results in FOREX pairs... as the tick
// size in Trading View may be 0.00001 instead of the normal pip size of
// 0.0001, so a 10 pip block size may be '100', and not the expected '10'.
// FOREX futures should work in the manner expected, a 10 pip block size
// will indeed equal 0.0010.
// The "ATR" mode functions differently than the Trading View built in
// version. The block size is updated each time the range is exceeded.
// In Trading View, when using the ATR mode, the ATR is the last ATR
// value calculated on the ENTIRE data interval, and is applied to all
// past data. You can see this when you press the '+' sign of the ticker
// in the top left of the chart window and you will see the brick size
// as a constant, the brick size is not a function of the ever changing
// ATR value of the price action. The block size of this script is not
// updated for each price candle (i.e. each 1HR on a 1HR chart), instead
// it is updated only when the price thresholds are exceeded requiring a
// the band to be updated. At that point the current ATR is considered
// and the brick size is updated.
// Options exist to show the current high and low of the brick, and to
// show the required levels that the price must exceed to draw a new
// brick and update the band.
Please leave comments if you notice any bugs or would like any new features added. I don't find much use for plotting the H/L of the current renko candle, but I have seen some request it in the past.
Cheers.

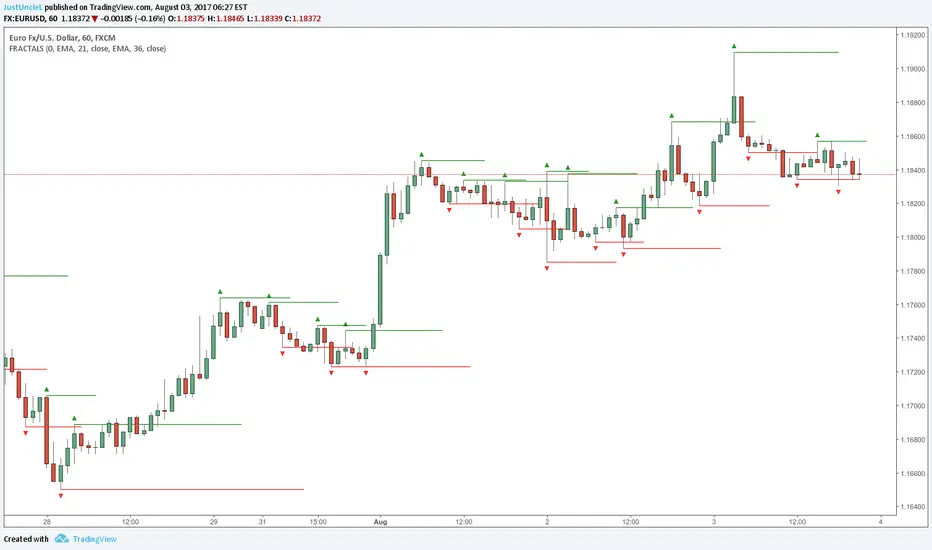
Fractals and Levels by JustUncleLEven though there are a many other Fractal and Level indicators, this indicator has some unique features. The indicator will display Fractals, fractal levels and HH/LL points, they will only be drawn after they have completed. Also the indicator has options to :
Show Ideal Fractals Only.
Use Renko Style Fractals, where open/close values are used instead of high/low to find Fractals. This is used to show the correct Fractals when Renko Wicks are enabled.
Has an optional Filter to only display Fractals that are above/below a MA Ribbon.
References:
This code is based on Fractal Levels V8 by RicardoSantos
This is a Renko Chart with "Renko Style Fractals" enabled, notice that the wicks are ignored and only the true Bricks are used for Fractals:
Renko CandlesThis is a script to place Renko candles on your chart alongside another candle type or more importantly, using the variables from this script, you can build a strategy using Renko candles that will depict true/proper entries and exits in a strategy when using the backtest feature.
We hope this helps!