[AN] Traders Magic OscilatorsOscillator that determines the current trend and signals possible trend reversals.
Best used alongside Gaussian Trendlines ()
Reversalpoint

Kawabunga Swing Failure Points Candles (SFP) by RRBKawabunga Swing Failure Points Candles (SFP) by RagingRocketBull 2019
Version 1.0
This indicator shows Swing Failure Points (SFP) and Swing Confirmation Points (SCP) as candles on a chart.
SFP/SCP candles are used by traders as signals for trend confirmation/possible reversal.
The signal is stronger on a higher volume/larger candle size.
A Swing Failure Point (SFP) candle is used to spot a reversal:
- up trend SFP is a failure to close above prev high after making a new higher high => implies reversal down
- down trend SFP is a failure to close below prev low after making a new lower low => implies reversal up
A Swing Confirmation Point (SCP) candle is just the opposite and is used to confirm the current trend:
- up trend SCP is a successful close above prev high after making a new higher high => confirms the trend and implies continuation up
- down trend SCP is a successful close below prev low after making a new lower low => confirms the trend and implies continuation down
Features:
- uses fractal pivots with optional filter
- show/hide SFP/SCP candles, pivots, zigzag, last min/max pivot bands
- dim lag zones/hide false signals introduced by lagging fractals or
- use unconfirmed pivots to eliminate fractal lag/false signals. 2 modes: fractals 1,1 and highest/lowest
- filter only SFP/SCP candles confirmed with volume/candle size
- SFP/SCP candles color highlighting, dim non-important bars
Usage:
- adjust fractal settings to get pivots that best match your data (lower values => more frequent pivots. 0,0 - each candle is a pivot)
- use one of the unconfirmed pivot modes to eliminate false signals or just ignore all signals in the gray lag zones
- optionally filter only SFP/SCP candles with large volume/candle size (volume % change relative to prev bar, abs candle body size value)
- up/down trend SCP (lime/fuchsia) => continuation up/down; up/down trend SFP (orange/aqua) => possible reversal down/up. lime/aqua => up; fuchsia/orange => down.
- when in doubt use show/hide pivots/unconfirmed pivots, min/max pivot bands to see which prev pivot and min/max value were used in comparisons to generate a signal on the following candle.
- disable offset to check on which bar the signal was generated
Notes:
Fractal Pivots:
- SFP/SCP candles depend on fractal pivots, you will get different signals with different pivot settings. Usually 4,4 or 2,2 settings are used to produce fractal pivots, but you can try custom values that fit your data best.
- fractal pivots are a mixed series of highs and lows in no particular order. Pivots must be filtered to produce a proper zigzag where ideally a high is followed by a low and another high in orderly fashion.
Fractal Lag/False Signals:
- only past fractal pivots can be processed on the current bar introducing a lag, therefore, pivots and min/max pivot bands are shown with offset=-rightBars to match their target bars. For unconfirmed pivots an offset=-1 is used with a lag of just 1 bar.
- new pivot is not a confirmed fractal and "does not exist yet" while the distance between it and the current bar is < rightBars => prev old fractal pivot in the same dir is used for comparisons => gives a false signal for that dir
- to show false signals enable lag zones. SFP/SCP candles in lag zones are false. New pivots will be eventually confirmed, but meanwhile you get a false signal because prev pivot in the same dir was used instead.
- to solve this problem you can either temporary hide false signals or completely eliminate them by using unconfirmed pivots of a smaller degree/lag.
- hiding false signals only works for history and should be used only temporary (left disabled). In realtime/replay mode it disables all signals altogether due to TradingView's bug (barcolor doesn't support negative offsets)
Unconfirmed Pivots:
- you have 2 methods to check for unconfirmed pivots: highest/lowest(rightBars) or fractals(1,1) with a min possible step. The first is essentially fractals(0,0) where each candle is a pivot. Both produce more frequent pivots (weaker signals).
- an unconfirmed pivot is used in comparisons to generate a valid signal only when it is a higher high (> max high) or a lower low (< min low) in the dir of a trend. Confirmed pivots of a higher degree are not affected. Zigzag is not affected.
- you can also manually disable the offset to check on which bar the pivot was confirmed. If the pivot just before an SCP/SFP suddenly jumps ahead of it - prev pivot was used, generating a false signal.
- last max high/min low bands can be used to check which value was used in candle comparison to generate a signal: min(pivot min_low, upivot min_low) and max(pivot max_high, upivot max_high) are used
- in the unconfirmed pivots mode the max high/min low pivot bands partially break because you can't have a variable offset to match the random pos of an unconfirmed pivot (anywhere in 0..rightBars from the current bar) to its target bar.
- in the unconfirmed pivots mode h (green) and l (red) pivots become H and L, and h (lime) and l (fuchsia) are used to show unconfirmed pivots of a smaller degree. Some of them will be confirmed later as H and L pivots of a higher degree.
Pivot Filter:
- pivot filter is used to produce a better looking zigzag. Essentially it keeps only higher highs/lower lows in the trend direction until it changes, skipping:
- after a new high: all subsequent lower highs until a new low
- after a new low: all subsequent higher lows until a new high
- you can't filter out all prev highs/lows to keep just the last min/max pivots of the current swing because they were already confirmed as pivots and you can't delete/change history
- alternatively you could just pick the first high following a low and the first low following a high in a sequence and ignore the rest of the pivots in the same dir, producing a crude looking zigzag where obvious max high/min lows are ignored.
- pivot filter affects SCP/SFP signals because it skips some pivots
- pivot filter is not applied to/not affected by the unconfirmed pivots
- zigzag is affected by pivot filter, but not by the unconfirmed pivots. You can't have both high/low on the same bar in a zigzag. High has priority over Low.
- keep same bar pivots option lets you choose which pivots to keep when there are both high/low pivots on the same bar (both kept by default)
SCP/SFP Filters:
- you can confirm/filter only SCP/SFP signals with volume % change/candle size larger than delta. Higher volume/larger candle means stronger signal.
- technically SCP/SFP is always the first matching candle, but it can be invalidated by the following signal in the opposite dir which in turn can be negated by the next signal.
- show first matching SCP/SFP = true - shows only the first signal candle (and any invalidations that follow) and hides further duplicate signals in the same dir, does not highlight the trend.
- show first matching SCP/SFP = false - produces a sequence of candles with duplicate signals, highlights the whole trend until its dir changes (new pivot).
Good Luck! Feel free to learn from/reuse the code to build your own indicators!

PRPI - Potential Reversal Points IndicatorThis indicator signals potential exhaustion of current trend.
Green background means we are in up-trend.
Spike in the opposite direction on histogram signals a waning of trend exhaustion.
Comment on this to get an access.

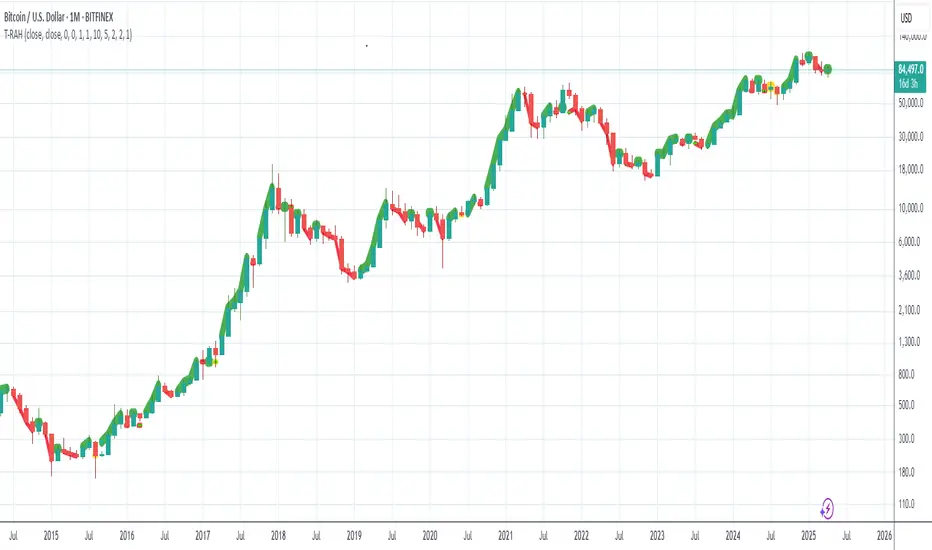
Trend Reversal Alert Hybrid [T.R.A.H]This is extention of a hybrid of AlPos-Trend-Highlighter with Peaks and Bottoms Detector from All Time Fibo Channel .
It is a visualizer of Reversal Points and Trend Lines for the series of a T-R.A.S strategies that are available in my scripts.
* Note : I ended up frustrated, I must say, because when I run my strategy it works perfect, but when I add this visualizer and turn it into strategy for some reason that is beyond of my understanding of pinescript, results are different. I tried everything I could, but in the end decided to make two separately working scripts that one is an indicator and the other one is a strategy. And it's working that way WTH!?!?!? for some reason in SPX lime and aqua lines showed displaced from candles, but when you use it on crypto seems working perfect. Might be a difference in data.. Anyway, please test and comment.
Trend Reversal Alerts Strategy [4H/3M]This is advanced version of T-R.A.S with better logic adapted for 4hour / 3month timeframes
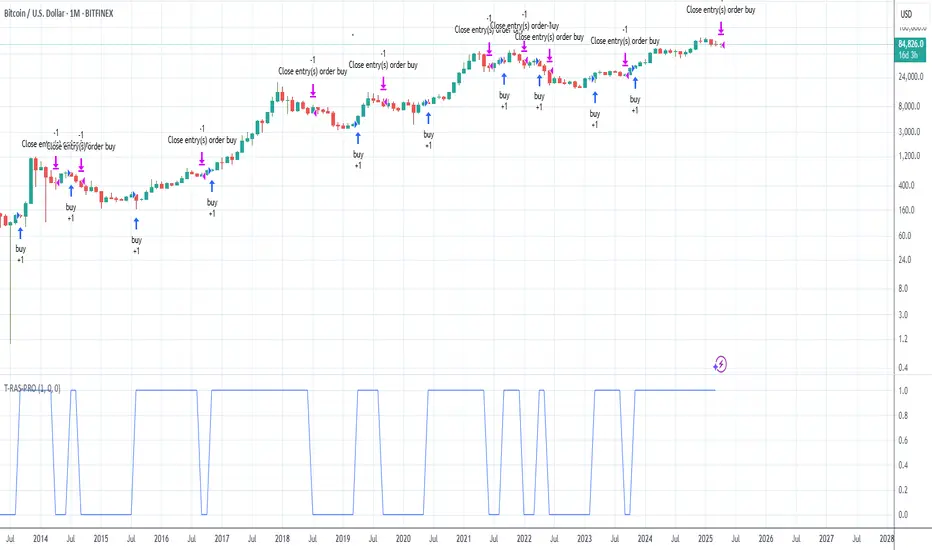
Trend Reversal Alerts Strategy [Advanced]This is a hourly version of T-R.A.S
It's better for houry timeframes : 2h, 3h, 4h, 6h, 12h, 1d, 4d ; otherwise use version for weekly

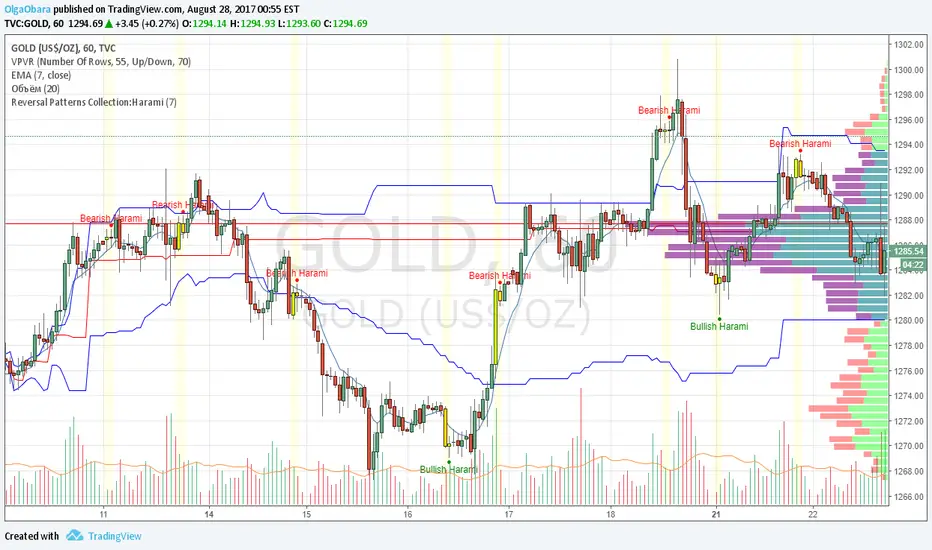
Reversal Patterns Collection:HaramiScript contains pattern Harami. User can select period for candle size calculation (for distinguish short and long candles), on/off highlighting of pattern candles.
Reversal Patterns Collection:3 Outside Up and 3 Outside DownScript contains reversal candle patterns 3 Outside Up and 3 Outside Down. User can select period for candle size calculation (for distinguish short and long candles), on/off highlighting of pattern candles.

Reversal Patterns Collection:3 Inside Up and 3 Inside DownSript contains sometimes appearing reversal candle patterns 3 Inside Up and 3 Inside Down. User can select period for candle size calculation (for distinguish short and long candles), on/off highlighting of pattern candles.

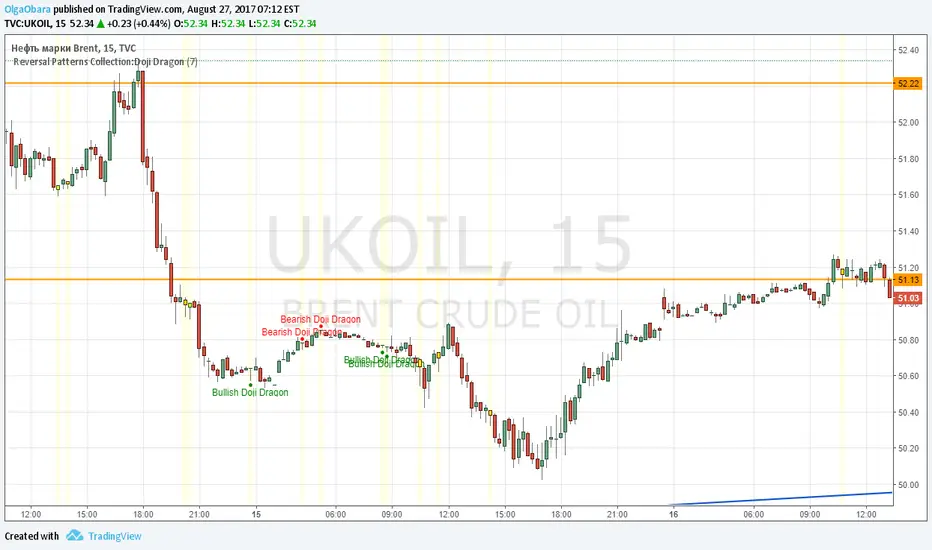
Reversal Patterns Collection:Doji Dragon Second script form my Reversal Patterns Collection contains special cases of Hammer and Handing Man named Doji Dragon. Script distinguishes bullish and bearish Doji Dragons. User can select period for candle size calculation (for distinguish short and long candles), on/off highlighting of pattern candles.
MM-Microtrend-Reversal-IndicatorThis indicator detects microtrend reversals based on crossing of the DMI+ and DMI- + signals
It indicates the trigger event on the chart as well as the reversal candle
In addition to that it shows a countdown above the bars
This is helping when multiple reversals occur
Important: when the Bollinger Bands are crossed in the previous bars it's possible that the prognosted reversal will NOT show up
Recommended timeframes are M1 and M2
Avoid trading sideway trends, the reverals are low and reversal triggers and assumed reversal candles could get chaotic

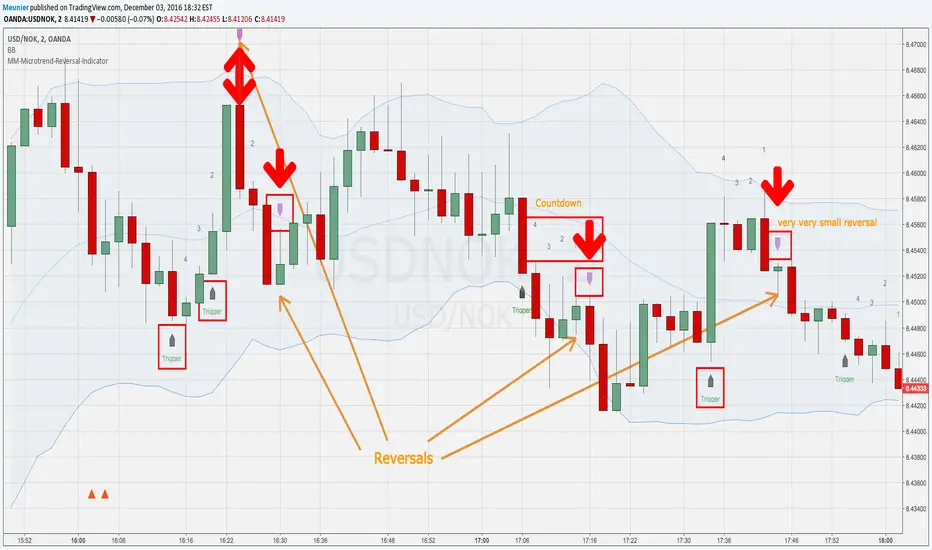
MM-Microtrend-Reversal-IndicatorThis indicator detects microtrend reversals based on crossings of the DMI+ and DMI- signals
It indicates the trigger event on the chart as well as the reversal candle
In addition to that it shows a countdown above the bars
This is helping when multiple reversals occur.
Important: when the Bollinger Bands are crossed in the previous bars it's possible that the prognosted reversal will NOT show up
Recommended timeframes are M1 and M2
Avoid trading sideway trends, the reversals are low and reversal triggers and assumed reversal candles could get chaotic sometimes
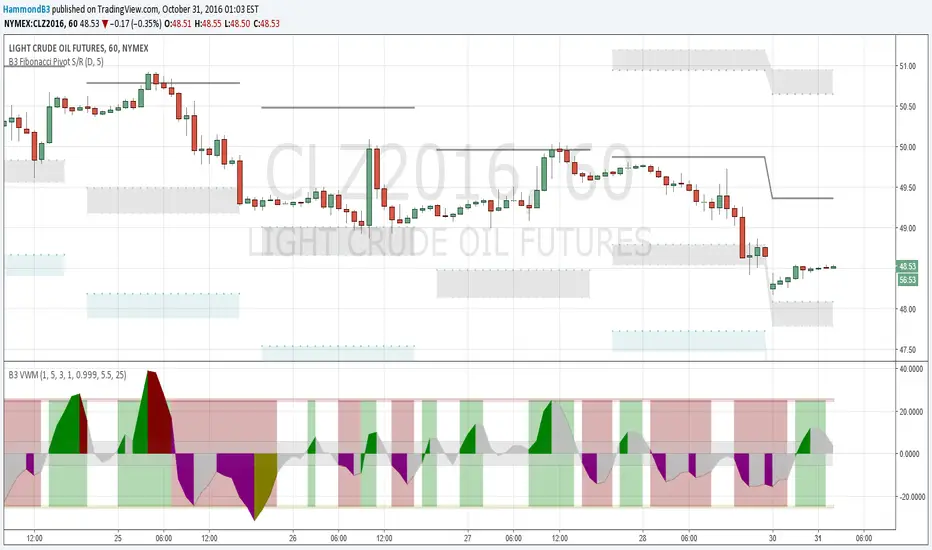
B3 Volume Weighted MomentumB3 VWM is a momentum indicator that responds to the change of price in relationship to volume. In the end the final formula is the classic physics test question of p=mv where p is momentum, m is mass and v is velocity. In this indicator mass is the amount of volume it took to move the price where it did, and velocity is the change in price expressed as a percentage of the bar range. Then, the indicator goes through some filtering to help display the line. Should appear with very little lag work it to find the perfect bar for reversals.
This can be thought of as directional volume times directional momentum index, but truly it is not these literally, as the script doesn't discern how many contracts flew to the bid or to the ask for separation. So with this momentum indicator you can hopefully get a feel of the volume flow, yet still use this like a traditional momentum oscillator. Look to hit the reversals at peaks, and use caution when trading longs when this indicator is negative, and vise versa. There can be divergence in this oscillator, and you can help remedy poor divergences by adjusting the smoothness or the flatness of the indicator to suit your chart. Also the dead zone and mid zone are likely in need of adjustments depending on volume flow and price changes for that symbol and resolution. Defaults are a great starting point for most charts 5m to day. Swing traders might enjoy a length of 8-10 to rid some quick changes of direction in the indicator. Love to have things like this up with pivot studies for level reversal entries, like the few on the shared oil chart.
Enjoy, and I hope you like some of my other proprieties too. Feel free to comment! ~B3
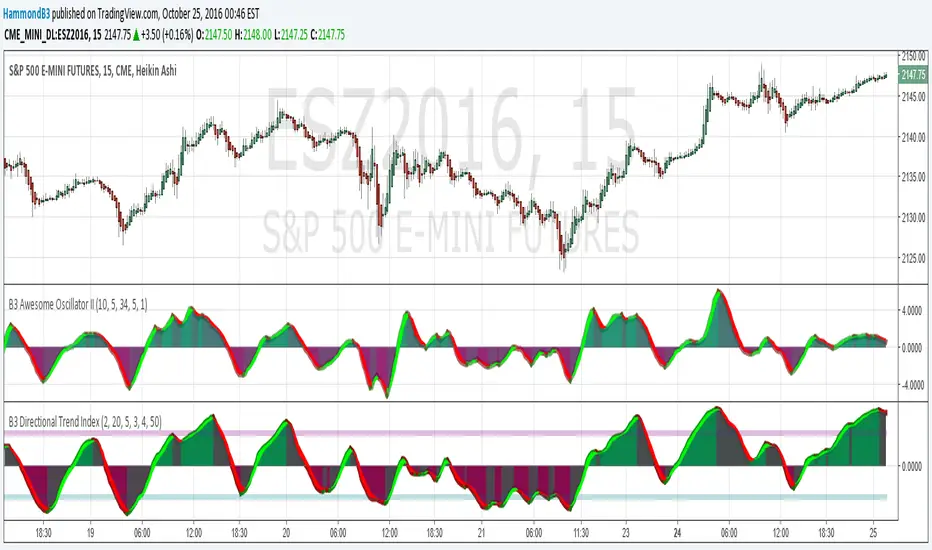
B3 Awesome Oscillator IIThe Awesome Oscillator is a simple average of the HL2 mean done at length 5 and 34 and taking the difference of the two. The Elliot Wave Oscillator is similar to this as well. What I have done is make my own version AO-II for my tastes. I use DTI a bunch and when range contracts and trends aren't solid, a more responsive indicator is needed, and that is where AO-II comes in. Then in some chop or even in a slow rolling trend, they both suffer as you can see in the middle of the chart above. But in general, AO-II is the jitterier little cousin.
In this modification of a standard, I have added a (code-protected) derivative to the mix that will help bring the oscillator back to zero more often than its momentum measuring counterparts. The offset is set to 1 by default meaning it will not change in the current bar as it moves along. This also makes all the crosses appear late in history, but you will notice that the signal crossings are all still fairly lag free.
Much like in DTI, in AO-II you should note the slope and relation to zero. Divergences can be seen in AO-II, and depending on the action it can be wrong, so careful there. I think the idea behind most momentum indicators is to look for entry on overages in direction that might be looking to correct or reverse. Then once in the trade going the correct way with your indicator you stay the course till indicator tells you to exit.