CT Reverse Chande Momentum OscillatorIntroducing the Caretakers Reverse Chande Momentum Oscillator.
The Chande momentum oscillator is a technical momentum indicator which calculates the difference between the sum of recent gains and the sum of recent losses and then divides the result by the sum of all price movement over the same period.
It is used to gauge “pure momentum”.
It bears similarities to other momentum indicators such as the Stochastic, Rate of Change and the Relative Strength Index, but other unique features render it a handy tool in the traders handset.
The CMO was developed by Tushar Chande.
The author introduced the indicator in his 1994 book “The New Technical Trader “.
The CMO has a normal range of values between +100 and -100.
I have reverse engineered the CMO formula to derive a dual purpose function.
The function can calculate the chart price at which the CMO will reach a particular CMO scale value.
The function can also calculate the chart price at which the CMO will equal its previous value.
I have employed this function here to give the price level where the CMO will equal :
Upper alert level ( default 50 )
Zero-Line
Lower alert level ( default -50 )
Previous CMO value
These crossover levels are displayed via an optional infobox with choice of user selected info.
The advantage of knowing the exact prices that this will happen should give the user an additional edge and precision in risk management.
Traditionally traders and analysts will consider:
Positives values above 50 indicate an “overbought” condition
Negative values below -50 indicate an “oversold” condition
Common traditional ways to derive signals from the CMO :
When the CMO crosses above the zeroline, a buy signal is generated.
When the CMO crosses below the zeroline, a sell signal is generated.
When the SMI crosses below -50 and then moves back above it, a buy signal is generated.
When the SMI crosses above +50 and then moves back below it, a sell signal is generated.
Traditionally, traders also look for divergences between the CMO and price action.
Chande Momentum oscillating in a narrower band around the zero line, with no penetration of the Overbought and Oversold levels indicates a ranging market.
This should not be confused with Chande Momentum oscillating between either the Overbought and the zero line, or the Oversold level and the zero line, which indicates a strong up, or down-trend.
It is traditionally considered that the strongest trend signals are from failed swing patterns.
It measures momentum on both up and down days and does not smooth results, triggering more frequent oversold and overbought penetrations.
The CMO is often used to determine overall market trendiness in conjunction with the SMI where the SMI is used to determine the direction of the trend, and also with volume indicators to show if the momentum carries significant selling or buying pressure.
Reverse

CT Reverse Stochastic Momentum IndexIntroducing the Caretakers Reverse Stochastic Momentum Index .
According to Investopedia :
“The Stochastic Momentum Index (SMI) is a more refined version of the stochastic oscillator, employing a wider range of values and having a higher sensitivity to closing prices.”
The SMI was developed by William Blau and introduced in 1993 in an attempt to provide a more reliable indicator, less subject to false swings.
It calculates the distance of the current closing price as it relates to the median of the high/low range of price.
The SMI has a normal range of values between +100 and -100.
When the present closing price is higher than the median, or midpoint value of the high/low range, the resulting value is positive.
When the current closing price is lower than that of the midpoint of the high/low range, the SMI has a negative value.
I have reverse engineered the SMI formula to derive 2 functions.
One function calculates the chart price at which the SMI will reach a particular SMI scale value.
The second function calculates the chart price at which the SMI will crossover its signal line.
I have employed those functions here to give the price level where the SMI will equal :
Upper alert level ( default 40 )
Zero-Line
Lower alert level ( default -40 )
Signal line
The user can infer from these values that when closing prices cross the levels shown, the SMI will cross the indicated level or signal line.
If the price value is less than zero the value will show "impossible".
The advantage of knowing the exact prices that this will happen should give the user an additional edge and precision in risk management.
These crossover levels are displayed via an optional infobox with choice of user selected info.
There is an option to change the decimal places shown.
For easy and intuitive reading of the indicator when ….
SMI is above the signal line both the SMI and Signal line and the space between them is Green.
SMI is below the signal line both the SMI and Signal line and the space between them is Red.
SMI is above the Zeroline the space between them is Green.
SMI is below the Zeroline the space between them is Red.
Traditionally traders and analysts will consider:
Positives values above 40 indicate a bullish trend
Negative values below -40 indicate a bearish trend .
Common traditional ways to derive signals from the SMI :
When the SMI crosses above the zeroline, a buy signal is generated.
When the SMI crosses below the zeroline, a sell signal is generated.
When the SMI crosses below -40 and then moves back above it, a buy signal is generated.
When the SMI crosses above +40 and then moves back below it, a sell signal is generated.
When the SMI line crosses above the signal line. A signal to buy / take profit is generated
When the SMI line crosses below the signal line. A signal to sell / take profit is generated.
Traders also look for divergences between the SMI itself or the SMI histogram and price action.
The SMI is often used in conjunction with the Chande Momentum Oscillator or R squared indicator to determine overall market trendiness where the SMI is used to determine the direction of the trend, and also with volume indicators to show if the momentum carries significant selling or buying pressure.

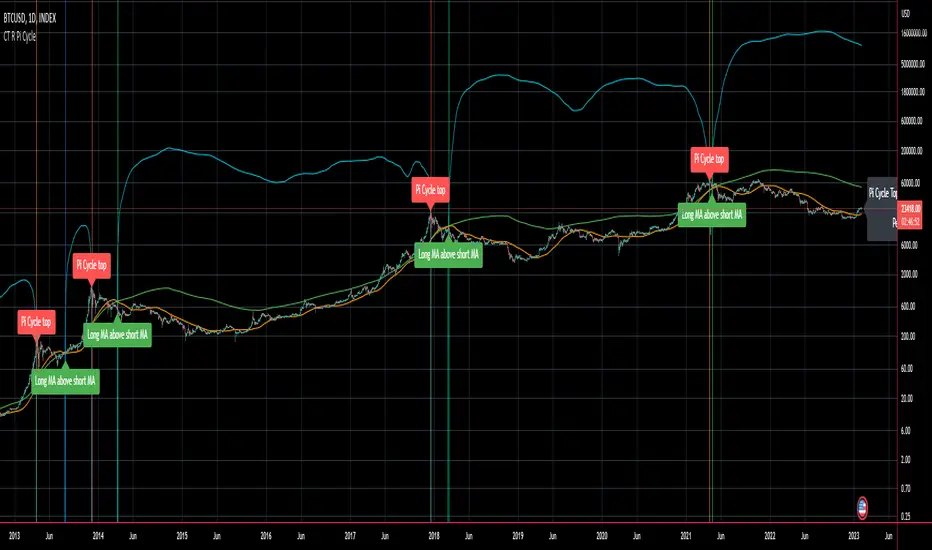
CT Reverse Pi Cycle Bitcoin Top IndicatorIntroducing the Reverse BTC Pi Market Cycle Top indicator
Much respect to Philip Swift the original creator of this idea and big thanks to Tradingview author Ninorigo for sharing the script which this indicator is based on.
Philip Swift has noted that:
Using the x2 multiple of the 350 day moving average along with the 111 day moving average provides an interesting market cycle indicator.
Over the past three market cycles, when the 350DMA x2 crosses below the 111DMA, Bitcoin price peaks in its market cycle, this has been accurate to within three days of Bitcoin price topping out.
Here I have modified an existing script by Tradingview author @Ninorigo which shows the moving averages and gives signals upon crossover by adding the following features:
A function which shows the price at which the 350DMA will Cross Below the 111DMA.
(This is calculated from the prior bar closing data and does not repaint)
An “anticipated cross” function which may give a 1 bar advanced warning of a cross.
(this is calculated from current bar values and may change and repaint)
The crossover levels are shown in an info label to the right of the current price.
When there is a BTC Pi Market Cycle Top anticipated cross on the next bar there will be an orange background signal.
When there is an actual BTC Pi Market Cycle Top cross there will be a red background signal
When there is an anticipated cross back there will be a blue background signal
When there is an actual cross back there will be a green background signal
This indicator will show the appropriate moving averages and crossover information from the daily timeframe regardless of the timeframe you are using.
This should be helpful in more accurately identifying the price level where the Pi Market Cycle moving averages will cross denoting a possible market cycle top.
It is interesting to note:
350 / 111 = 3.153
Which is the closest we can get to Pi when dividing 350 by another whole number.
This is a script to give another view and metric on an interesting experimental idea. This is not financial advice.
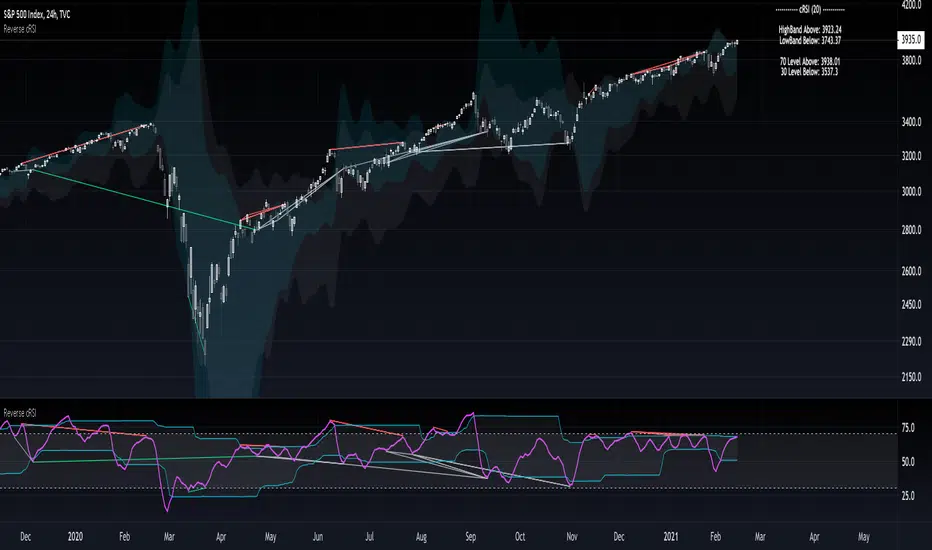
On Chart Reverse RSI cyclic smoothed + DivergenceThis indicator is based on the amazing work of (@whentotrade) Lars von Theinen's RSI cyclic smoothed (cRSI). More information on the original indicator and how to use it can be found below.
The On Chart Reverse cRSI is a visual representational spin of the cRSI or (RSI cyclic smoothed, by Lars von Theinen) you all know and love with the addition of two key features, that in conjunction can be used to greatly assist the end-user in their decision making for entry, exit and risk management.
The first feature is the visual reverse engineered calculations of the HighBand, LowBand, as well as the user defined Upper and Lower Levels (70 & 30 by default), compared to the cRSI Level, in relation to the current price level as the point of divergence, which at a glance can then be used to visually see on the chart the closing price level needed in order to cross the cRSI either under or over the afore mentioned levels.
The second feature is the addition of my advanced On Chart divergence script in order to display regular as well as hidden divergences on the cRSI compared to the price level, in order to help the end-user train their eyes to spot them more accurately.
Divergence colors and description:
-------------------------------------
Green : Regular Bullish Divergence
White : Hidden Bullish Divergence
Red : Regular Bearish Divergence
Orange : Hidden Bearish Divergence
Optional Settings Include:
-----------------------------
1.) Show/Hide Reverse Levels
2.) Change the Reverse Levels Text Size
3.) Change the Reverse Levels Text Color
4.) Change the Reverse Levels Text Left Margin
5.) Change the Reverse Levels Decimal value
6.) Show/Hide the Reverse Levels Currency
7.) Show/hide the cRSI Divergence lines
8.) Change the cRSI Divergence line offset
9.) Show/hide the cRSI Divergence arrows
10.) Change the Regular Bullish Divergence Color
11.) Change the Hidden Bullish Divergence Color
12.) Change the Regular Bearish Divergence Color
13.) Change the Hidden Bearish Divergence Color
14.) Change the cRSI Divergence lookback (No. of bars to lookback)
RSI cyclic smoothed (cRSI)
-----------------------------
The RSI cyclic smoothed (cRSI) indicator is developed by Lars von Theinen and is subject to the terms of the Mozilla Public License 2.0 at mozilla.org Copyright (C) 2017 CC BY, whentotrade / Lars von Thienen. For more details on the cRSI Indicator:
RSI cyclic smoothed v2
The RSI cyclic smoothed (cRSI) is an enhancement of the classic RSI , adding
1) additional smoothing according to the market vibration,
2) adaptive upper and lower bands according to the cyclic memory and
3) using the current dominant cycle length as input for the indicator.
It is much more responsive to market moves than the basic RSI . The indicator uses the dominant cycle as input to optimize signal, smoothing, and cyclic memory. To get more in-depth information on the cyclic-smoothed RSI indicator, please read Decoding The Hidden Market Rhythm - Part 1: Dynamic Cycles (2017), Chapter 4: "Fine-tuning technical indicators." You need to derive the dominant cycle as input parameter for the cycle length as described in chapter 4.
Please PM me to obtain access.
Reverse RSI cyclic smoothed + DivergenceThis indicator is based on the amazing work of (whentotrade) Lars von Theinen's RSI cyclic smoothed (cRSI). More information on the original indicator and how to use it can be found below.
The Reverse cRSI is in essence the same cRSI or (RSI cyclic smoothed, by Lars von Theinen) you all know and love with the addition of two key features, that in conjunction can be used to greatly assist the end-user in their decision making for entry, exit and risk management.
The first feature is a reverse engineered calculation of the HighBand, LowBand, as well as the user defined Upper and Lower Levels (70 & 30 by default), compared to the cRSI Level, in relation to the current price level as the point of divergence, which at a glance can then be used to determine the closing price level needed in order to cross the cRSI either under or over the afore mentioned levels.
The second feature is the addition of my advanced divergence script to display regular as well as hidden divergences on the cRSI, in order to help the end-user train their eyes to spot them more accurately.
Divergence colors and description:
-------------------------------------
Green : Regular Bullish Divergence
White : Hidden Bullish Divergence
Red : Regular Bearish Divergence
Orange : Hidden Bearish Divergence
Optional Settings Include:
-----------------------------
1.) Show/Hide Reverse Levels
2.) Change the Reverse Levels Text Size
3.) Change the Reverse Levels Text Color
4.) Change the Reverse Levels Text Left Margin
5.) Change the Reverse Levels Decimal value
6.) Show/Hide the Reverse Levels Currency
7.) Show/hide the cRSI Divergence lines
8.) Change the cRSI Divergence line offset
9.) Show/hide the cRSI Divergence arrows
10.) Change the cRSI Divergence arrow offset
11.) Change the Regular Bullish Divergence Color
12.) Change the Hidden Bullish Divergence Color
13.) Change the Regular Bearish Divergence Color
14.) Change the Hidden Bearish Divergence Color
15.) Change the cRSI Divergence lookback (No. of bars to lookback)
RSI cyclic smoothed (cRSI)
-----------------------------
The RSI cyclic smoothed (cRSI) indicator is developed by Lars von Theinen and is subject to the terms of the Mozilla Public License 2.0 at mozilla.org Copyright (C) 2017 CC BY, whentotrade / Lars von Thienen.
RSI cyclic smoothed v2
The RSI cyclic smoothed (cRSI) is an enhancement of the classic RSI , adding
1) additional smoothing according to the market vibration,
2) adaptive upper and lower bands according to the cyclic memory and
3) using the current dominant cycle length as input for the indicator.
It is much more responsive to market moves than the basic RSI . The indicator uses the dominant cycle as input to optimize signal, smoothing, and cyclic memory. To get more in-depth information on the cyclic-smoothed RSI indicator, please read Decoding The Hidden Market Rhythm - Part 1: Dynamic Cycles (2017), Chapter 4: "Fine-tuning technical indicators." You need to derive the dominant cycle as input parameter for the cycle length as described in chapter 4.

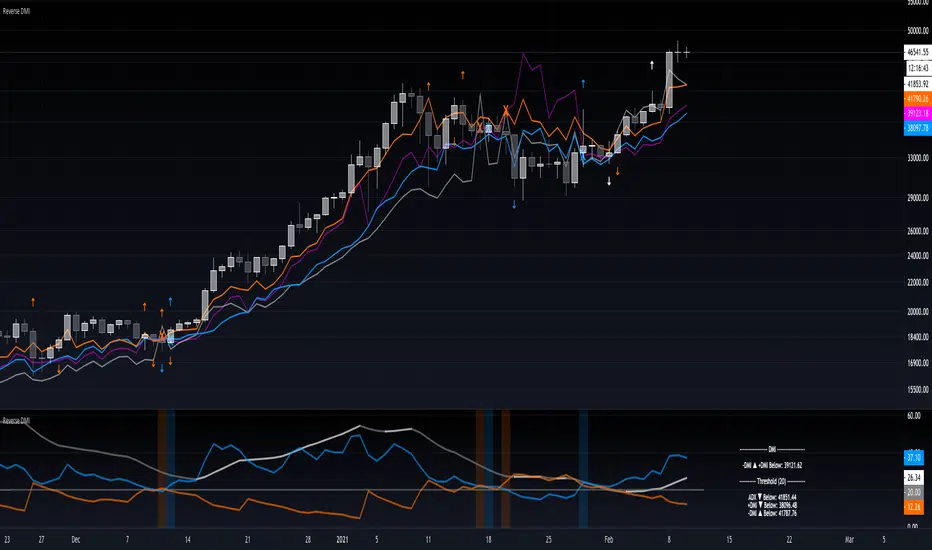
Reverse DMIThe Reverse DMI is in essence the same DMI or (Directional Movement Index) you all know and love with the addition of two reverse level features, and can be used to assist the end-user in their decision making for entry, exit and risk management.
In a nutshell the first feature is a reverse engineered calculation of the +DMI, and -DMI levels, compared to each other, in relation to the current price level as the point of divergence. The second feature is a reverse engineered calculation of the ADX, +DMI, and -DMI levels, compared to the user defined Threshold level, in relation to the current price level as the point of divergence.
At a glance this can then be used to determine the closing price level needed in order to cross the +DMI and -DMI, as well as the closing price level needed in order to cross the ADX, +DMI, and -DMI either under or over the user defined Threshold.
Optional Settings Include:
-------------------------------
1.) Change the Threshold Levels Right Margin
2.) Show/Hide ADX Exhaustion (will highlight the plot, if condition is met or exceeded)
3.) Show/Hide DMI Crosses (will highlight the background once, if condition is met)
4.) Show/Hide Reverse Levels
5.) Change the Reverse Levels Text Size
6.) Change the Reverse Levels Text Color
7.) Change the Reverse Levels Text Left Margin
8.) Change the Reverse Levels Decimal value
9.) Show/Hide the Reverse Levels Currency
On Chart Reverse MACD HistogramThe On Chart Reverse MACD Histogram is a visual representational spin of the original MACD Histogram to assist the end-user in their decision making for entry, exit and risk management, as well as freeing up space for the chart.
The On Chart Reverse MACD Histogram, which very basically is a reverse engineered calculation of the MACD's Histogram gives the user a visual representation of the relationship between the current price and the MACD's Histogram on the chart instead of having to reference the MACD itself. At a glance this can then be used to visually see on the chart the closing price level needed in order to change the MACD's Histogram momentum either up or down.
Optional Settings Include:
-------------------------------
1.) Show/Hide Reverse MACD Histogram Momentum text
2.) Change the Reverse MACD Histogram Momentum information type (Basic/Detailed)
3.) Change the Reverse MACD Histogram Momentum text size
4.) Change the Reverse MACD Histogram Momentum text color
5.) Change the Reverse MACD Histogram Momentum text left margin
6.) Show/hide the Reverse MACD Histogram Momentum text currency
7.) Change the Reverse MACD Histogram Momentum text decimal value
8.) Show/hide the MACD Histogram Momentum Level
9.) Show the MACD Histogram Momentum Level As Columns *
* Please Note: When using the "Show Histogram Level As Columns" setting, in order to display this feature correctly without distorting the chart, click the ⚙️ (cog) icon in the bottom right corner of your chart and select the 'Scale Price Chart Only' option.

On Chart Reverse RSI+EMA Cross With DivergenceThe On Chart Reverse RSI+EMA Cross With Divergence is a visual representational spin of the original RSI+EMA to assist the end-user in their decision making for entry, exit and risk management, as well as freeing up space for the chart.
The On Chart Reverse RSI+EMA Cross With Divergence, which very basically is a smoothed reverse engineered calculation of the RSI's EMA Line gives the user a visual representation of the relationship between the current price and the RSI's EMA Line, which also includes RSI's divergences on the chart instead of having to reference the RSI itself. At a glance this can then be used to visually see on the chart potential momentum changes as well as the closing price level needed in order to cross the RSI either up or down.
Divergence colors and description:
------------------------------------------
Green : Regular Bullish Divergence
White : Hidden Bullish Divergence
Red : Regular Bearish Divergence
Orange : Hidden Bearish Divergence
Optional settings include:
-------------------------------
1.) Show/Hide the Reverse RSI+EMA Cross label
2.) Change the Reverse RSI+EMA Cross label text size
3.) Change the Reverse RSI+EMA Cross label text color
4.) Change the Reverse RSI+EMA Cross label left margin
5.) Show/hide the Reverse RSI+EMA Cross label currency
6.) Change the Reverse RSI+EMA Cross label decimal value
7.) Show/hide the RSI Divergence lines
8.) Change the RSI Divergence line offset
9.) Show/hide the RSI Divergence arrows
10.) Change the RSI Divergence arrow offset
11.) Change the RSI Divergence lookback (No. of bars to lookback)

Nick Rypock Trailing Reverse (NRTR)This indicator was invented in 2001 by Konstantin Kopyrkin. The name "Nick Rypock" is derived from his surname reading in the opposite direction:
Kopyrkin -> Kopyr Kin -> Kin Kopyr -> Nik Rypok
The idea of the indicator is similar to the Chandelier Exit, but doesn't involve ATR component and uses a percentage instead.
A dynamic price channel is used to calculate the NRTR. The calculations involve only those prices that are included in the current trend and exclude the extremes related to the previous trend. The indicator is always at the same distance (in percent) from the extremes reached by prices (below the maximum peak for the current uptrend, above the minimum bottom for the current downtrend).

On Chart Reverse MACD CrossThe On Chart Reverse MACD Cross is a visual representation of the Reverse MACD Cross calculation which can be used to assist the end-user in their decision making for entry, exit and risk management, as well as freeing up space for the chart.
The On Chart Reverse MACD Cross, which very basically is a smoothed reverse engineered calculation of the MACD Signal Line gives the user a visual representation of the relationship between the current price and the MACD Signal Line instead of having to reference the MACD itself. At a glance this can then can be used to visually see on the chart the closing price level needed in order to cross the MACD either up or down.
Optional settings include:
-------------------------------
1.) Show/Hide the Reverse MACD Cross label
2.) Change the Reverse MACD Cross label text size
3.) Change the Reverse MACD Cross label left margin
4.) Show/hide the Reverse MACD Cross label currency
5.) Change the Reverse MACD Cross label decimal value
Please PM me to obtain access

Reverse MACD Cross + Histogram DivergenceThe Reverse MACD Cross + Histogram Divergence is in essence the same MACD you all know and love with two added features which can be used to assist the end-user in their decision making for entry, exit and risk management.
The first feature is a Reverse MACD Cross price, which very basically is a smoothed reverse engineered calculation of the MACD Signal Line in relation to the current price level. At a glance this can then be used to determine the closing price level needed in order to cross the MACD either up or down.
The second feature is visual MACD Histogram regular as well as hidden divergences. This feature was added as MACD histogram divergences are not as easy to
spot as on the RSI for example, and can help the end-user train their eyes in order to spot them more accurately.
Divergence colors and description:
------------------------------------------
Green : Regular Bullish Divergence
White : Hidden Bullish Divergence
Red : Regular Bearish Divergence
Orange : Hidden Bearish Divergence
Optional settings include:
-------------------------------
1.) Show the Histogram only (Hide the MACD and Signal lines)
2.) Show/Hide the Reverse MACD Cross label
3.) Change the Reverse MACD Cross label text size
4.) Change the Reverse MACD Cross label left margin
5.) Show/hide the Reverse MACD Cross label currency
6.) Change the Reverse MACD Cross label decimal value
7.) Show/hide the MACD Histogram Divergence lines
8.) Change the MACD Histogram Divergence line offset
9.) Show/hide the MACD Histogram Divergence arrows
10.) Change the MACD Histogram Divergence arrow offset
11.) Change the MACD Histogram Divergence lookback (No. of bars to lookback)
Please PM me to obtain access.

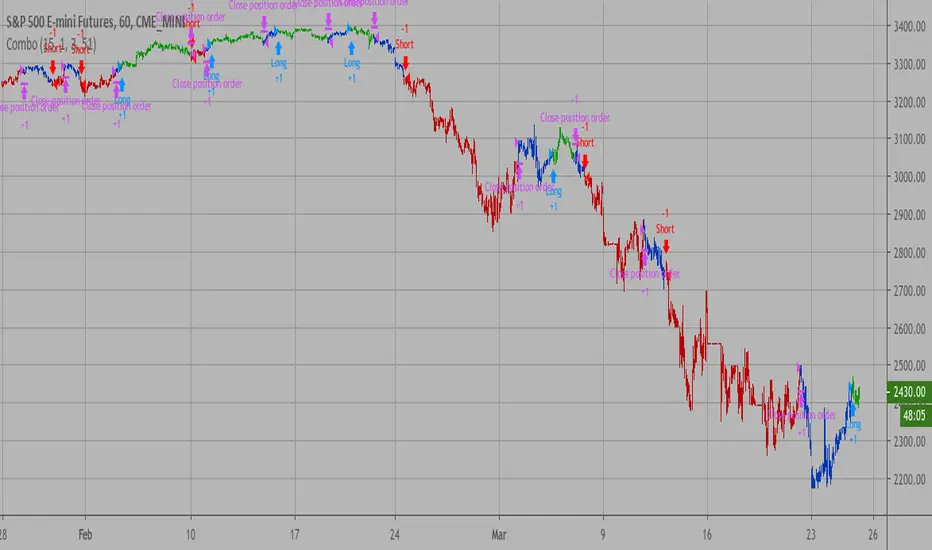
CHOP Zone Entry Strategy + DMI/PSAR ExitThis is a Strategy with associated visual indicators and Long/Short and Reverse/Close Position Alerts for the Choppiness Index (CHOP) . It is used to determine if the market is choppy (trading sideways) or not choppy (trading within a trend in either direction). CHOP is not directional, so a DMI script was ported into this strategy to allow for trend confirmation and direction determination; it consists of an Average Directional Index (ADX) , Plus Directional Indicator (+DI) and Minus Directional Indicator (-DI) . In addition, a Parabolic SAR is also included to act as a trailing stop during any strong trends.
Development Notes
---------------------------
This indicator, and most of the descriptions below, were derived largely from the TradingView reference manual. Feedback and suggestions for improvement are more than welcome, as well are recommended Input settings and best practices for use.
www.tradingview.com
www.tradingview.com
www.tradingview.com
Recommend using the below DMI and PSAR indicators in conjunction with this script to fully visualize and understand how entry and exit conditions are chosen. Variable inputs should correlate between the scripts for uniformity and visual compatibility.
THANKS to LazyBear and his Momentum Squeeze script for helping me quickly develop a momentum state model for coloring the Chop line by trend.
Strategy Description
---------------------------
CHOP produces values that determine whether the market is choppy or trending . The closer the value is to 100 , the higher the choppiness levels , while the closer it is to 0 , the stronger the market is trending . Territories for both levels, and their associated upper and lower thresholds, are popularly defined using the Fibonacci Retracements, 61.8 and 38.2.
Basic Use
---------------------------
CHOP is often used to confirm the market condition to help you stay out of sideways markets and only enter when there is movement or imminent explosions. When readings are above the upper threshold, continued sideways movement may be expected, while readings below the lower threshold are typically indicative of a continuing trend. It is also used to anticipate upcoming trendiness changes, with the general belief that extended periods of consolidation (sideways movement) are followed by extended periods of strong, trending, directional movement, and vice versa.
One limitation in this index is that you must be cautious in deciding whether the range or trend will likely continue, or if it will reverse.
Confidence in price action and trend is higher when two or more indicators are in agreement -- while this strategy combines CHOP with both DMI and PSAR, we would still recommend pairing with other indicators to determine entry or exit trade opportunities.
Recommend also choosing 'Once Per Bar Close' when creating alerts.
Inputs
---------------------------
Strategy Direction - an option to only trade Short, Long, Both, or only in the direction of the Trend (Follow Trend is the Default).
Sensitivity - an incremental variable to test whether the past n candles are in the same trend state before triggering a delayed long or short alert (1 is the Default). Can help filter out noise and reduces active alerts.
Show Chop Index - two visual styles are provided for user preference, a visible Chop line with a background overlay, or a compact column and label only view.
Chop Lookback Period - the time period to be used in calculating CHOP (14 is the Default).
Chop Offset - changing this number will move the CHOP either forwards or backwards relative to the current market (0 is the Default).
Smooth Chop Line and Length - if enabled, the entered time period will be used in calculating a smooth average of the index (Enabled and 4 are the Defaults).
Color Line to Trend Direction - toggles whether the index line is colored to visually depict the current trend direction (Enabled is the Default).
Color Background - toggles the visibility of a background color based on the index state (Enabled is the Default).
Enable DMI Option - if enabled, then entry will be confirmed by and dependent on the ADX Key Level, with any close or reversal confirmed by both ADX and +/-DI to determine whether there is a strong trend present or not (Enabled is the Default).
ADX Smoothing - the time period to be used in calculating the ADX which has a smoothing component (14 is the Default).
DI Length - the time period to be used in calculating the DI (14 is the Default).
ADX Key Level - any trade with the ADX above the key level is a strong indicator that it is trending (23 to 25 is the suggested setting).
Enable PSAR Option - enables trailing stop loss orders (Enabled is the Default).
PSAR Start - the starting value for the Acceleration Force (0.015 is our chosen Default, 0.02 is more common).
PSAR Increment - the increment in which the Acceleration Force will move (0.001 is our chosen Default, 0.02 is more common).
PSAR Max Value - the maximum value of the Acceleration Factor (0.2 is the Default).
Color Candles Option - an option to transpose the CHOP condition levels to the main candle bars. Note that the outer red and green border will still be distinguished by whether each individual candle is bearish or bullish during the specified timeframe.
Note too that if both DMI and PSAR are deselected, then close determinations will default to a CHOP reversal strategy (e.g., close long when below 38.2 and close short when above 61.8). Though if either DMI or PSAR are enabled, then the CHOP reversal for close determination will automatically be disabled.
Indicator Visuals
---------------------------
For the candle colors, black indicates tight chop (45 to 55), yellow is loose chop (38.2 to 45 and 55 to 61.8), dark purple is trending down (< 38.2), and dark blue is trending up (> 61.8).
The background color has additional shades to differentiate a wider range of more levels…
• < 30 is dark purple
• 30 to 38.2 is purple
• 38.2 to 45 is light purple
• 45 to 55 is black
• 55 to 61.8 is light blue
• 61.8 to 70 is blue
• > 70 is dark blue
Long, Short, Close, and Reverse labels are plotted on the Chop line, which itself can be colored based on the trend. The chop line can also be hidden for a clean and compact, columnar view, which is my preferred option (see example image below).
Visual cues are intended to improve analysis and decrease interpretation time during trading, as well as to aid in understanding the purpose of this strategy and how its inclusion can benefit a comprehensive trading plan.
DMI and Trend Strength
---------------------------
To analyze trend strength, the focus should be on the ADX line and not the +DI or -DI lines. An ADX reading above 25 indicates a strong trend , while a reading below 20 indicates a weak or non-existent trend . A reading between those two values would be considered indeterminable. Though what is truly a strong trend or a weak trend depends on the financial instrument being examined; historical analysis can assist in determining appropriate values.
DMI exits trade when ADX is below the user selected key level (e.g., default is 25) and when the +/- DI lines cross (e.g., -DI > +DI exits long position and +DI > -DI exits short position).
PSAR and Trailing Stop
---------------------------
PSAR is a time and price based indicator that excels at measuring direction and duration, though not the actual strength of a trend, which is why we use this in conjunction with DMI. It is also included in this script as a trailing stop option to maximize gains during strong trends and to mitigate any false ADX strengthening signals.
This creates a parabola that is located below the candle during a Bullish trend and above during a Bearish trend. A buy or reversal is signaled when the price crosses above or below the Parabolic SAR.
Long/Short Entry
---------------------------
1. CHOP must be over 61.8 (long) or under 38.2 (short).
2. If DMI is enabled, then the ADX signal line must be above the user selected Key Level (default is 25).
3. If Sensitivity is selected, then that past candle must meet the criteria in step 1, as well as all the intermediate candles in between.
4. If "Follow Trend" is selected and PSAR is enabled, then a long position can only open when the momentum and PSAR are in an uptrend, or short when both are in a downtrend, to include all intermediate candles if the Sensitivity option is set on a past candle.
Close/Reverse
---------------------------
1. If DMI is enabled, then a close flag will be raised when the ADX signal drops below the Key Level (of 25), and -DI crosses over +DI (if long), or +DI crosses over -DI (if short).
2. If PSAR is enabled, then a close flag will be raised when the current trend state is opposite the last state.
3. If both DMI and PSAR are disabled, then a close flag will be raised if the Chop line drops under 38.2 (if long) or goes over 61.8 (if short).
4. If a Long or Short Entry is triggered on the same candle as any of the above close flags, then the position will be reversed, else the position will be closed.
Strategy Alerts
---------------------------
1. Long Entry
2. Short Entry
3. Reverse
4. Close
The provided backtest result is based on a position sizing of 10% equity with 100k initial capital. When testing SPX, disabling the DMI performed the best, but EURUSD performed poorly without it enabled, and TSLA had a small reduction in net profit. Timeframe likewise differed between commodities with TSLA performing best at 30M, SPX at 15M, and EURUSD at 4H. I do not plan on using this as a standalone strategy, but I also was expecting better results with the inclusion of EMI and PSAR to compliment the CHOP. Key elements of this script will likely be included in future, more holistic strategies.
Disclaimer
---------------------------
Past performance may not be indicative of future results. Due to various factors, including changing market conditions, the strategy may no longer perform as well as in historical backtesting. This post and the script are not intended to provide any financial advice. Trade at your own risk.
No known repainting, though there may be if an offset is introduced in the Inputs. I did my best not to code any other variables that repaint, but cannot fully attest to this fact.

Forex SWING TraderThis strategy is mainly designed for swing trading applied to FOREX.
In this case we make use of 2 moving averages but with different time frame, lets say 1h and 1 day.
When they cross above we would initially have a long trade, but in this strategy we trade it in reverse, so we would actually enter a short position.
The same for short trade.
At the same time we make use of hours for entry, so we can filter even better between the trades, and select the best possible hours for entries.
For exit we have 2 conditions : one is when we receive an opposite signal ( by default ).
The other is when a certain movement between moving averages, like lets say 1% of price movement, we will exit. This can act both as TP and SL.

Sniper RSniper entry can be used on any time frame and is a continuous process of possible trend changing signals based on pure price action.
This script is a depiction of a change in trend and not a recommendation from the publisher. Do consult your financial advisor if you need to get into a trade. It is not a recommendation to trade and needs to be used as a reference along with other analysis that you may already be doing currently.
Sniper entry is a graphical expression in terms of a trend change based on price action only. You may want to combine this with other indicators to bring out best results as per need.
Sniper entry can be used on a multi time frame and is not limited to one trading day and can continue into the next day to depict a change in trend.
Note: This is not a recommendation of a buy or a sell but a study of most recent trends depending on time frame selected. Please do contact your financial advisor before placing the trade.
Trade smart, trade right.
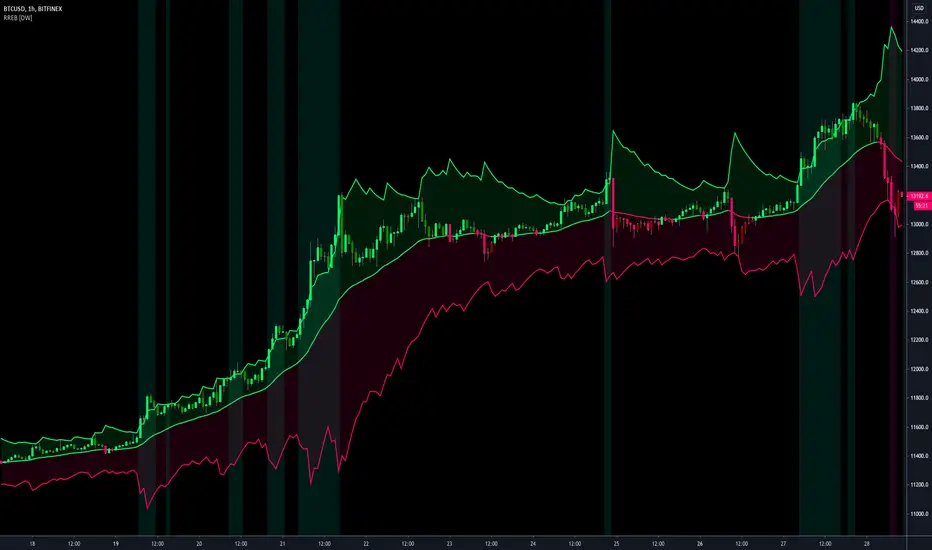
Resampling Reverse Engineering Bands [DW]This is an experimental study designed to reverse engineer price levels from centered oscillators at user defined sample rates.
This study aims to educate users on the process of oscillator reverse engineering, and to give users an alternative perspective on some of the most commonly used oscillators in the trading game.
Reverse engineering price levels from an oscillator is actually a rather simple, straightforward process.
Rather than plugging price values into a function to solve for oscillator values, we rearrange the function using some basic algebraic operations and plug in a specified oscillator value to solve for price values instead.
This process tells us what price value is needed in order for the oscillator to equal a certain value.
For example, if you wanted to know what price value would be considered “overbought” or “oversold” according to your oscillator, you can do that using this process.
In this study, the reverse engineering functions are used to calculate the price values of user defined high and low oscillator thresholds, and the price values for the oscillator center.
This allows you to visualize what prices will trigger thresholds as a sort of confidence interval, which is information that isn't inherently available when simply analyzing the oscillator directly.
This script is equipped with three reverse engineering functions to choose from for calculating the band values:
-> Reverse Relative Strength Index (RRSI)
-> Reverse Stochastic Oscillator (RStoch)
-> Reverse Commodity Channel Index (RCCI)
You can easily select the function you want to utilize from the "Band Calculation Type" dropdown tab.
These functions are specially designed to calculate at any sample rate (up to 1 bar per sample) utilizing the process of downsampling that I introduced in my Resampling Filter Pack.
The sample rate can be determined with any of these three methods:
-> BPS - Resamples based on the number of bars.
-> Interval - Resamples based on time in multiples of current charting timeframe.
-> PA - Resamples based on changes in price action by a specified size. The PA algorithm in this script is derived from my Range Filter algorithm.
The range for PA method can be sized in points, pips, ticks, % of price, ATR, average change, and absolute quantity.
Utilizing downsampled rates allows you to visualize the reverse engineered values of an oscillator calculated at larger sample scales.
This can be rather beneficial for trend analysis since lower sample rates completely remove certain levels of noise.
By default, the sample rate is set to 1 BPS, which is the same as bar-to-bar calculation. Feel free to experiment with the sample rate parameters and configure them how you like.
Custom bar colors are included as well. The color scheme is based on disparity between sources and the reverse engineered center level.
In addition, background highlights are included to indicate when price is outside the bands, thus indicating "overbought" and "oversold" conditions according to the thresholds you set.
I also included four external output variables for easy integration of signals with other scripts:
-> Trend Signals (Current Resolution Prices) - Outputs 1 for bullish and -1 for bearish based on disparity between current resolution source and the central level output.
-> Trend Signals (Resampled Prices) - Outputs 1 for bullish and -1 for bearish based on disparity between resampled source and the central level output.
-> Outside Band Signal (Current Resolution Prices) - Outputs 1 for overbought and -1 for oversold based on current resolution source being outside the bands. Returns 0 otherwise.
-> Outside Band Signal (Resampled Prices) - Outputs 1 for overbought and -1 for oversold based on resampled source being outside the bands. Returns 0 otherwise.
To use these signals with another script, simply select the corresponding external output you want to use from your script's source input dropdown tab.
Reverse engineering oscillators is a simple, yet powerful approach to incorporate into your momentum or trend analysis setup.
By incorporating projected price levels from oscillators into our analysis setups, we are able to gain valuable insights, make (potentially) smarter trading decisions, and visualize the oscillators we know and love in a totally different way.
I hope you all find this script useful and enjoyable!
Backwards price projection - few bars ahead reverse chartEver wondered what the chart would look like if it's flipped upside down and flipped horizontally into the future? The idea is that when there is a trend, a repeating pattern tends to occur. Going backwards and projecting that movement into the future can supposedly show what the future price will be.
Somehow I haven't found anyone try it like this and I am currently trying to find a way to use a reversed moving average or plot of some kind to project further ahead. TV at the moment does not allow offsets on candle plot(as far as I know) and I am only allowed a certain number of plots to go on the chart, so I put as many price moves ahead as I could to project the future price. It's a bit sloppy with all those forced plots but it gets the job done. I'll see if I can improve it with a moving average or something and possibly make a strategy out of it in the future.

[Max] Volume Entropy Divergence FilteredAn indicator that represent in 3 line my Volume Entropy Divergence Heatmap indicator.
I've use a very basic sum with some weights like this : Long therm > Mid therm > short Therm, But short and mid therm can still have influence.
Some people did request this indicator to be able to use the heatmap in there indicators with the new tradingview link function. There still a problem that will be the subject of a future update, when the divergence is to high it's often mean that instead of a divergence, we have a continuation or a parabolic.
This indicator still also need a location checker to try to don't short the bottom.
There is 3 lines, 2 are the sum of the negative/positive divergences.
The third one is the result off a karman volatility filter, with differents weigths for each line off the heatmap, it can easily used to find reversals.
You have some options to play with the volatility filter, the defaults settings are the ones I think is the best.
This script will still private for the same reasons raised in the original heatmap.
My policy : If you can provide me nice updates, I will give you the source code, if within 3 month I don't use it anymore it will pass in public.
If you have any improvement idears I will be please to ear them.
Have a nice day !
Max

Combo Backtest 123 Reversal & Empirical Mode Decomposition This is combo strategies for get a cumulative signal.
First strategy
This System was created from the Book "How I Tripled My Money In The
Futures Market" by Ulf Jensen, Page 183. This is reverse type of strategies.
The strategy buys at market, if close price is higher than the previous close
during 2 days and the meaning of 9-days Stochastic Slow Oscillator is lower than 50.
The strategy sells at market, if close price is lower than the previous close price
during 2 days and the meaning of 9-days Stochastic Fast Oscillator is higher than 50.
Second strategy
The related article is copyrighted material from Stocks & Commodities Mar 2010
WARNING:
- For purpose educate only
- This script to change bars colors.

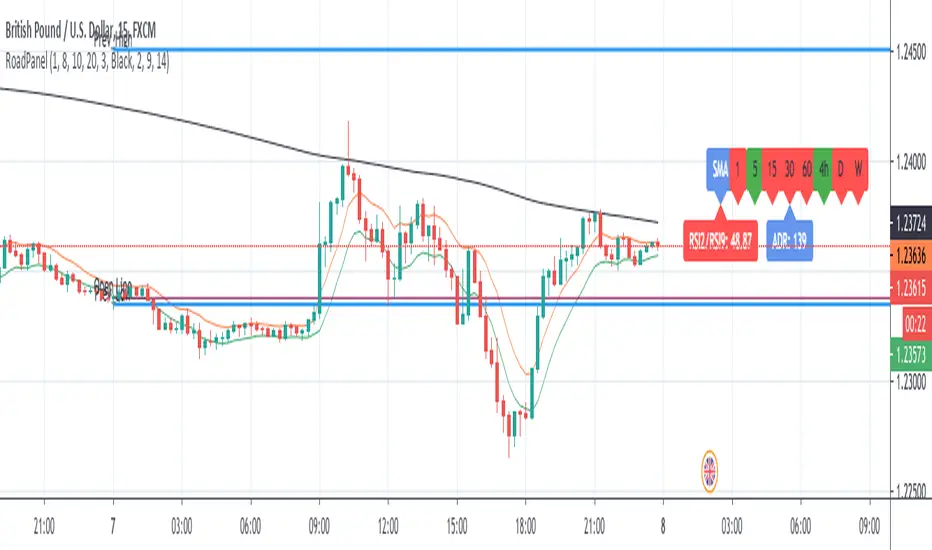
RoadMap PanelThis study is usefull for who follows the rules of "Laura's RoadMap" trading strategy.
If someone doesn't know what I'm talking about, google it because I cannot post link here.
It could be used for scaliping too.
Basically, the rules are:
- Open only in direction of Multitimeframe SMA200
- EMA high/low channel shall be above(buy) or below (Sell) SMA200
- RSI2/RSI9 shall be above(buy) or below (sell) 50
- Look at ADR, last day high/low, daily open for possible supports/resistance.
Next improvement (only to whom is interested to this script and follows me): ADR, last day high/low, daily open to be added to this study.
Next improvement (only to whom is interested to this script and follows me): Alerts to be added.
Please use comment section for any feedback.
********************************** IMPORTANT********************************************************************
I have developed an expert advisor for metatrader4 (MT4) with good results in 2019-April 2020
*********************************************************************************************************************
This study is free to use but code is private. If you like or have question please use comment section.
Check also my other scripts at www.tradingview.com
Thanks for your feedbaks.
Combo Backtest 123 Reversal & Dynamic Pivot Point This is combo strategies for get a cumulative signal.
First strategy
This System was created from the Book "How I Tripled My Money In The
Futures Market" by Ulf Jensen, Page 183. This is reverse type of strategies.
The strategy buys at market, if close price is higher than the previous close
during 2 days and the meaning of 9-days Stochastic Slow Oscillator is lower than 50.
The strategy sells at market, if close price is lower than the previous close price
during 2 days and the meaning of 9-days Stochastic Fast Oscillator is higher than 50.
Second strategy
This Pivot points is calculated on the current day.
Pivot points simply took the high, low, and closing price from the previous period and
divided by 3 to find the pivot. From this pivot, traders would then base their
calculations for three support, and three resistance levels. The calculation for the most
basic flavor of pivot points, known as ‘floor-trader pivots’, along with their support and
resistance levels.
WARNING:
- For purpose educate only
- This script to change bars colors.
Candlestick PatternsCandlestick Patterns
- Candlesticks are graphical representations of price movements for a given period of time.
- There are candlestick patterns that try to predict the final direction, caused by pressure between buyers and sellers.
As a general recommendation, use the candlestick patterns in the same direction of the current trend (continuations),
for reverse patterns we must expect the price to be over extended, for example,
that it is the highest or lowest value of (20-50) periods,
or that the RSI is overbought or oversold (14-50),
or that the price is far from its standard deviation.
- This indicator allows you to view more than 20 different patterns, some of them:
Doji
Engulfing
Hammer
Shooting Star
Inverted Hammer
Hanging Man
Morning Star
Evening Star
etc...
- The indicator allows displaying the full name of the pattern
- It allows you to view the labels at the top of the chart, to avoid this affecting the technical analysis

Data structure ListThe script shows a workaround for list in pine-script via drawings.
There are few restrictions with them:
1. The size of the list cannot be more that amount of allowed drawings (about 40 by now)
2. Because the list shares the space of drawings throughout the whole script, using drawings with the list must be careful, with handly creating and removing of each drawing, because otherwise pine's garbage collector might break the list
3. Setters and Getters must be called on every bar, because of implementation of functions in pine there are inner serieses, which must be updated on every bar. So wherever you have a setter or getter in the code - it must be called on every bar. But if it's just an update, then you should pass 'false' as a param of the funtion.
And an example of using the list - reversing of the list. When the list have been created, it's filled on every bar and then gets reversed. Plots show result before and after reversing of the list.
There are also some pieces of commented code showing possible way of working with another funtions of the list.

Market StructureMarket Structure
The Market Structure is important to be able to establish areas of rejection or possible break,
to determine channels, points of possible reversals or trend breaks.
So we can use them as support and resistance zones for stoploss and take profit.
- This indicator will automatically show the market structure.
- Allows you to calculate the levels with the closing of the candles as well as with the highs and lows
- You can change the number of levels on the screen with the intensity adjustment
- Extended levels are shown as well as at the end of the graph to avoid noise when making technical analysis
- Visually you can modify the style, color, thickness of the level lines
- This indicator is multi-time, so you can check the structure of other temporalities, for example see the levels corresponding to 1D while the graph is H4
- Green lines are the resitance levels and red lines are support levels, these will automatically change color according to the current price
BTC 1W
EURUSD 1W
ETHUSDT 1D
