Adaptive Risk Management [sgbpulse]1. Introduction:
Adaptive Risk Management is an advanced indicator designed to provide traders with a comprehensive risk management tool directly on the chart. Instead of relying on complex manual calculations, the indicator automates all critical steps of trade planning. It dynamically calculates the estimated Entry Price , the Stop Loss location, the required Position Size (Quantity) based on your capital and risk limits, and the three Take Profit targets based on your defined Reward/Risk ratios. The indicator displays all these essential data points clearly and visually on the chart, ensuring you always know the potential risk-reward profile of every trade.
ARM : The A daptive R isk M anagement every trader needs to ARM themselves with.
2. The Critical Importance of Risk Management
Proper risk management is the cornerstone of successful trading. Consistent profitability in the market is impossible without rigorously defining risk limits.
Risk Control: This starts by setting the maximum risk amount you are willing to lose in a single trade (Risk per Trade), and limiting the total capital allocated to the position (Max Capital per Trade).
Defining Boundaries (Stop Loss & Take Profit): It is mandatory to define a technical Stop Loss and a Take Profit target. A fundamental rule of risk management is that the Reward/Risk Ratio (R/R) must be a minimum of 1:1.
3. Core Features, Adaptivity, and Customization
The Adaptive Risk Management indicator is engineered for use across all major trading styles, including Swing Trading, Intraday Trading, and Scalping, providing consistent risk control regardless of the chosen timeframe.
Real-Time Dynamic Adaptivity: The indicator calculates all risk management parameters (Entry, Stop Loss, Quantity) dynamically with every new bar, thus adapting instantly to changing market conditions.
Trend Direction Adjustment: Define the analysis direction (Long/Uptrend or Short/Downtrend).
Intraday Session Data Control: Full control over whether lookback calculations will include data from Extended Trading Hours (ETH), or if the daily calculations will start actively only from the first bar of Regular Trading Hours (RTH).
Status Validation: The indicator performs critical status checks and displays clear Warning Messages if risk conditions are not met.
4. Intuitive Visualization and Real-Time Data
Dynamic Tracking Lines: The Entry Price and Stop Loss lines are updated with every new bar. Crucially, the length of these lines dynamically reflects the calculation's lookback range (e.g., the extent of Lookback Bars or the location of the confirmed Pivot Point), providing a visual anchor for the calculated price.
Risk and Reward Zones: The indicator creates a graphical background fill between Entry and Stop Loss (marked with the risk color) and between Entry and the Reward Targets (marked with the reward color).
Essential Information Labels: Labels are placed at the end of each line, providing critical data: Estimated Entry Price, Stock/Contract Quantity (Quantity), Total Entry Amount, Estimated Stop Loss, Risk per Share, Total Financial Risk (Risk Amount), Exit Amount, Estimated Take Profit 1/2/3, Reward/Risk Ratio 1/2/3, Total Reward 1/2/3, TP Exit Amount 1/2/3.
4.1. Data Window Metrics (16 Full Series)
The indicator displays 16 full data series in the TradingView Data Window, allowing precise tracking of every calculation parameter:
Entry Data: Estimated Entry, Quantity, Entry Amount.
Risk Data (Stop Loss): Estimated Stop Loss, Risk per Share, Risk Amount, Exit Amount.
Reward Data (Take Profit): Estimated Take Profit 1/2/3, Reward/Risk Ratio 1/2/3, Total Reward 1/2/3, TP Exit Amount 1/2/3.
4.2. Instant Tracking in the Status Line
The indicator displays 6 critical parameters continuously in the indicator's Status Line: Estimated Entry, Quantity, Estimated Stop Loss, Estimated Take Profit 1/2/3.
5. Detailed Indicator Inputs
5.1 General
Focused Trend: Defines the analysis direction (Uptrend / Downtrend).
Max Capital per Trade: The maximum amount allocated to purchasing stocks/contracts (in account currency).
Risk per Trade: The maximum amount the user is willing to risk in this single trade (in account currency).
ATR Length: The lookback period for the Average True Range (ATR) calculation.
5.2 Intraday Session Data Control
Regular Hours Limitation : If enabled, all daily lookback calculations (for Entry/Stop Loss anchor points) will begin strictly from the first Regular Trading Hours (RTH) bar. This limits the lookback range to the current RTH session, excluding preceding Extended Trading Hours (ETH) data. Only relevant for Intraday charts. Default: False (Off)
5.3 Entry Inputs
Entry Method: Selects the entry price calculation method:
Current Price: Uses the closing price of the current bar as the estimated entry point (Market Entry).
ATR Real Bodies Margin :
- Uptrend: Calculates the Maximum Real Body over the lookback period + the calculated safety margin.
- Downtrend: Calculates the Minimum Real Body over the lookback period - the calculated safety margin.
ATR Bars Margin :
- Uptrend: Calculates the Maximum High price over the lookback period + the calculated safety margin.
- Downtrend: Calculates the Minimum Low price over the lookback period - the calculated safety margin.
Lookback Bars: The number of bars used to calculate the extremes in the ATR-based entry methods (Relevant only for ATR Real Bodies Margin and ATR Bars Margin methods).
ATR Multiplier (Entry): The multiplier applied to the ATR value. The result of the multiplication is the calculated safety margin used to determine the estimated Entry Price.
5.4 Risk Inputs (Stop Loss)
Risk Method: Selects the Stop Loss price calculation method.
ATR Current Price Margin :
- Uptrend: Entry Price - the calculated safety margin.
- Downtrend: Entry Price + the calculated safety margin.
ATR Current Bar Margin :
- Uptrend: Current Bar's Low price - the calculated safety margin.
- Downtrend: Current Bar's High price + the calculated safety margin.
ATR Bars Margin :
- Uptrend: Lowest Low over lookback period - the calculated safety margin.
- Downtrend: Highest High over lookback period + the calculated safety margin.
ATR Pivot Margin :
- Uptrend: The first confirmed Pivot Low point - the calculated safety margin.
- Downtrend: The first confirmed Pivot High point + the calculated safety margin.
Lookback Bars: The lookback period for finding the extreme price used in the 'ATR Bars Margin' calculation.
ATR Multiplier (Risk): The multiplier applied to the ATR value. The result of the multiplication is the calculated safety margin used to place the estimated Stop Loss. Note: If set to 0, the Stop Loss will be placed exactly at the technical anchor point, provided the Minimum Margin Value is also 0.
Minimum Margin Value: The minimum price value (e.g., $0.01) the Stop Loss margin buffer must be.
Pivot (Left / Right): The number of bars required on either side of the pivot bar for confirmation (relevant only for the ATR Pivot Margin method).
5.5 Reward Inputs (Take Profit)
Show Take Profit 1/2/3: ON/OFF switch to control the visibility of each Take Profit target.
Reward/Risk Ratio 1/ 2/ 3: Defines the R/R ratio for the profit target. Must be ≥1.0.
6. Indicator Status/Warning Messages
In situations where the Stop Loss location cannot be calculated logically and validly, often caused by a mismatch between the configured Focused Trend (Uptrend/Downtrend) and the actual price action, the indicator will display a warning message, explaining the reason and suggesting corrective action.
Status Message 1: Pivot reference unavailable
Condition: The Stop Loss is set to the "ATR Pivot Margin" method, but the anchor point (Pivot) is missing or inaccessible.
Message Displayed: "Pivot reference unavailable. Wait for valid price action, or adjust the Regular Hours Limitation setting or Pivot Left/Right inputs."
Status Message 2: Calculated Stop Loss is unsafe
Condition: The calculated Stop Loss is placed illogically or unsafely relative to the trend direction and the Entry price.
Message Displayed: "Calculated Stop Loss is unsafe for current trend. Wait for valid price action or adjust SL Lookback/Multiplier."
7. Summary
The Adaptive Risk Management (ARM) indicator provides a seamless and systematic approach to trade execution and risk control. By dynamically automating all critical trade parameters—from Entry Price and Stop Loss placement to Position Sizing and Take Profit targets—ARM removes emotional bias and ensures every trade adheres strictly to your predefined risk profile.
Key Benefits:
Systematic Risk Control: Strict enforcement of maximum capital allocation and risk per trade limits.
Adaptivity: Dynamic calculation of prices and quantities based on real-time market data (ATR and Lookback).
Clarity and Trust: Clear on-chart visualization, precise data metrics (16 series), and unambiguous Status/Warning Messages ensure transparency and reliability.
ARM allows traders to focus on strategy and analysis, confident that their execution complies with the core principles of professional risk management.
Important Note: Trading Risk
This indicator is intended for educational and informational purposes only and does not constitute investment advice or a recommendation for trading in any form whatsoever.
Trading in financial markets involves significant risk of capital loss. It is important to remember that past performance is not indicative of future results. All trading decisions are your sole responsibility. Never trade with money you cannot afford to lose.
Riskreward

RiskCraft - Advanced Risk Management SystemRiskCraft – Risk Intelligence Dashboard
Trade like you actually respect risk
"I know the setup looks good… but how much am I actually risking right now?"
RiskCraft is an open-source Pine Script v6 indicator that keeps risk transparent directly on the chart. It is not a signal generator; it is a risk desk that calculates size, frames volatility, and reminds you when your behaviour drifts away from the plan.
Core utilities
Calculates professional-style position sizing in real time.
Reads volatility and market regime before position size is confirmed.
Adjusts risk based on the trader’s emotional state and confidence inputs.
Maps session risk across Asian, London, and New York hours.
Draws exactly one stop line and one target line in the preferred direction.
Provides rotating education tips plus contextual warnings when risk escalates.
It is intentionally conservative and keeps you in the game long enough for any separate entry logic to matter.
---
Chart layout checklist
Use a clean chart on a liquid symbol (e.g., AMEX:SPY or major FX pairs).
Main RiskCraft dashboard placed on the right edge.
Session Risk box on the left with UTC time visible.
Floating risk badge above price.
Stop/target guide lines enabled.
Education panel visible in the bottom-right corner.
---
1. On-chart components
Right-side dashboard : account risk %, position size/value, stop, target, risk/reward, regime, trend strength, emotional state, behavioural score, correlation, and preferred trade direction.
Session Risk box : highlights active session (Asian, London, NY), current UTC time, and risk label (High/Med/Low) per session.
Floating risk badge : keeps actual account risk percent visible with colour-coded wording from Ultra Cautious to Very Aggressive.
Stop/target lines : exactly one dashed stop and one dashed target aligned with the preferred bias.
Education panel : rotates core principles and AI-style warnings tied to volatility, risk %, and behaviour flags.
---
2. Volatility engine – ATR with context 📈
atr = ta.atr(atrLength)
atrPercent = (atr / close) * 100
atrSMA = ta.sma(atr, atrLength)
volatilityRatio = atr / atrSMA
isHighVol = volatilityRatio > volThreshold
ATR vs ATR SMA shows how wild price is relative to recent history.
Volatility ratio above the threshold flips isHighVol , which immediately trims risk.
An ATR percentile rank over the last 100 bars indicates calm versus chaotic regimes.
Daily ATR sampling via request.security() gives higher time-frame context for intraday sessions.
When volatility spikes the script dials position size down automatically instead of cheering for maximum exposure.
---
3. Market regime radar – Danger or Drift 🌊
ema20 = ta.ema(close, 20)
ema50 = ta.ema(close, 50)
ema200 = ta.ema(close, 200)
trendScore = (close > ema20 ? 1 : -1) +
(ema20 > ema50 ? 1 : -1) +
(ema50 > ema200 ? 1 : -1)
= ta.dmi(14, 14)
Regimes covered:
Danger : high volatility with weak trend.
Volatile : volatility elevated but structure still directional.
Choppy : low ADX and noisy action.
Trending : directional flows without extreme volatility.
Mixed : anything between.
Each regime maps to a 1–10 risk score and a multiplier that feeds the final position size. Danger and Choppy clamp size; Trending restores normal risk.
---
4. Behaviour engine – trader inputs matter 🧠
You provide:
Emotional state : Confident, Neutral, FOMO, Revenge, Fearful.
Confidence : slider from 1 to 10.
Toggle for behavioural adjustment on/off.
Behind the scenes:
Each state triggers an emotional multiplier .
Confidence produces a confidence multiplier .
Combined they form behavioralFactor and a 0–100 Behavioural Score .
High-risk emotions or low conviction clamp the final risk. Calm inputs allow normal size. The dashboard prints both fields to keep accountability on-screen.
---
5. Correlation guardrail – avoid stacking identical risk 📊
Optional correlation mode compares the active symbol to a reference (default AMEX:SPY ):
corrClose = request.security(correlationSymbol, timeframe.period, close)
priceReturn = ta.change(close) / close
corrReturn = ta.change(corrClose) / corrClose
correlation = calcCorrelation()
Absolute correlation above the threshold applies a correlation multiplier (< 1) to reduce size.
Dashboard row shows the live correlation and reference ticker.
When disabled, the row simply echoes the current symbol, keeping the table readable.
---
6. Position sizing engine – heart of the script 💰
baseRiskAmount = accountSize * (baseRiskPercent / 100)
adjustedRisk = baseRiskAmount * behavioralFactor *
regimeAdjustment * volAdjustment *
correlationAdjustment
finalRiskAmount = math.min(adjustedRisk,
accountSize * (maxRiskCap / 100))
stopDistance = atr * atrStopMultiplier
takeProfit = atr * atrTargetMultiplier
positionSize = stopDistance > 0 ? finalRiskAmount / stopDistance : 0
positionValue = positionSize * close
Outputs shown on the dashboard:
Position size in units and value in currency.
Actual risk % back on account after adjustments.
Risk/Reward derived from ATR-based stop and target.
---
7. Intelligent trade direction – bias without signals 🎯
Direction score ingredients:
EMA stack alignment.
Price versus EMA20.
RSI momentum relative to 50.
MACD line vs signal.
Directional Movement (DI+/DI–).
The resulting Trade Direction row prints LONG, SHORT, or NEUTRAL. No orders are generated—this is guidance so you only risk capital when the structure supports it.
---
8. Stop/target guide lines – two lines only ✂️
if showStopLines
if preferLong
// long stop below, target above
else if preferShort
// short stop above, target below
Lines refresh each bar to keep clutter low.
When the direction score is neutral, no lines appear.
Use them as visual anchors, not auto-orders.
---
9. Session Risk map – global volatility clock 🌍
Tracks Asian, London, and New York windows via UTC.
Computes average ATR per session versus global ATR SMA.
Labels each session High/Med/Low and colours the cells accordingly.
Top row shows the active session plus current UTC time so you always know the regime you are trading.
One glance tells you whether you are trading quiet drift or the part of the day that hunts stops.
---
10. Floating risk badge – honesty above price 🪪
Text ranges from Ultra Cautious through Very Aggressive.
Colour matches the risk palette inputs (High/Med/Low).
Updates on the last bar only, keeping historical clutter off the chart.
Account risk becomes impossible to ignore while you stare at price.
---
11. Education engine & warnings 📚
Rotates evergreen principles (risk 1–2%, journal trades, respect plan).
Triggers contextual warnings when volatility and risk % conflict.
Flags when emotional state = FOMO or Revenge.
Highlights sub-standard risk/reward setups.
When multiple danger flags stack, an AI-style warning overrides the tip text so you can course-correct before capital is exposed.
---
12. Alerts – hard guard rails 🚨
Excessive Risk Alert : actual risk % crosses custom threshold.
High Volatility Alert : ATR behaviour signals danger regime.
Emotional State Warning : FOMO or Revenge selected.
Poor Risk/Reward Alert : risk/reward drops below your standard.
All alerts reinforce discipline; none suggest entries or exits.
---
13. Multi-market behaviour 🕒
Intraday (1m–1h): session box and badge react quickly; ideal for scalpers needing constant risk context.
Higher time frames (1D–1W): dashboard shifts slowly, supporting swing planning.
Asset classes confirmed in validation: crypto majors, large-cap equities, indices, major FX pairs, and liquid commodities.
Risk logic is price-based, so it adapts across markets without bespoke tuning.
15. Key inputs & recommended defaults
Account Size : 10,000 (modify to match actual account; min 100).
Base Risk % : 1.0 with a Maximum Risk Cap of 2.5%.
ATR Period : 14, Stop Multiplier 2.0, Target Multiplier 3.0.
High Vol Threshold : 1.5 for ATR ratio.
Behavioural Adjustment : enabled by default; disable for fixed risk.
Correlation Check : optional; default symbol AMEX:SPY , threshold 0.7.
Display toggles : main dashboard, risk badge, session map, education panel, and stop lines can be individually disabled to reduce clutter.
16. Usage notes & limits
Indicator mode only; no automated entries or exits.
Trade history panel intentionally disabled (requires strategy context).
Correlation analysis depends on additional data requests and may lag slightly on illiquid symbols.
Session timing uses UTC; adjust expectations if you trade localized instruments.
HTF ATR sampling uses daily data, so bar replay on lower charts may show brief data gaps while HTF loads.
What does everyone think RISK really means?

Universal Lot Size Calculator (Forex, Index, Metals)Multi-functional lot size calculator with support for various instruments
🎯 MAIN FEATURES:
Universal — works with Forex, indices, metals, and custom instruments
Auto-detect — automatically detects instrument type by ticker
Precise position sizing - considering risk and currency conversions
Currency conversion — automatic conversion between deposit currencies
Advanced visualization — entry, stop-loss, take-profit lines
Smart table — convenient display of all parameters
⚙️ SETTINGS GROUPS:
📈 Instrument Settings
Instrument Type — selection: Auto, Forex, Index, Metals, Custom
Custom Contract Size — manual contract size configuration
Use Manual Exchange Rate — manual rate for currency conversion
💰 Account & Risk Settings
Deposit Currency — account currency (USD, EUR, GBP, CHF, JPY)
Account Size — deposit amount
Risk in % — risk percentage from deposit
🎯 Price Levels
Entry Price — entry price
Stop Price — stop-loss price
Target Price — take-profit price
Color settings for each line
📊 Risk/Reward Settings
Manual Target Price — manual TP setting
Show R Levels — display profit levels in R multiples
Show only last R level — show only the last R level
Number of R Levels — number of R levels (1-10)
🎨 Line Styles & Table Appearance
Line style settings (solid, dashed, dotted)
Line width
Table position and size
Color schemes
📈Supported instrument types:
Forex — standard lot 100,000
Indices — E-mini futures (US100=20, SP500=50, US30=5, DAX=25)
Metals — Gold=100 oz, Silver=5000 oz
Custom — user-defined contract size
📱 KEY FEATURES:
- Auto instrument detection:
Indices: US100, SP500, US30, DAX
Metals: XAUUSD (Gold), XAGUSD (Silver)
Forex: all currency pairs
- Smart table with key parameters:
Instrument type and contract size
Account size and risk
Entry/exit prices
Calculated lot size
- Visual elements:
Dynamic level lines
Labels with profit/loss calculations
R-levels for target prices
- Currency conversion:
Automatic rate fetching
Support for USD, EUR, GBP, CHF, JPY
Manual rate setting when needed
⚠️ IMPORTANT NOTES:
Contract sizes may vary between brokers
For CFD brokers use Custom type with Contract Size = 1
During weekends currency rates may be unavailable — use manual rate
When trading in different currencies verify conversion accuracy
🚀 HOW TO USE:
Select instrument type (Auto for auto-detection)
Set deposit size and account currency
Define risk percentage (1-100%)
Specify prices for entry, stop-loss, and take-profit
Use calculated lot to open positions
⚠️ RESETTING CALCULATIONS:
To reuse the calculator with new price levels, you need to:
Right-click on the indicator's table/chart
Select "Reset Points" from the context menu
OR manually update all three price levels (Entry, Stop Loss, Take Profit) in the settings

Futures Position Size Calculator (NQ/ES)DISCLAIMER:
This indicator is provided solely for informational and educational purposes. It calculates position sizing based on user-defined inputs such as entry and stop-loss levels, but it does not provide trading signals, recommendations, or financial advice . All trading decisions are made at the sole discretion of the user.
By using this indicator, you acknowledge that you are fully responsible for your own trades and risk management . The developer/publisher of this indicator assumes no liability for any losses, damages, or financial consequences that may arise from its use.
Features:
• Position size calculator (based on Entry & Stop Loss)
• Reward ratio calculator (1R, 2R, 3R, etc.)
• Supports: NQ / MNQ / ES / MES
Usage:
When you first add the script to your chart (on any supported futures symbol), you will be prompted to set the Entry Price and Stop Loss Price on the chart using draggable lines .
After setup, you can freely move the price lines, and the indicator will automatically update:
• Position size
• Reward targets
• Direction (long/short is auto-detected)
RISK Settings:
You can calculate position size using either:
1. Account Percent
Select "Percent" in the Risk Method dropdown and enter the percent of your account you want to risk per trade.
2. Fixed Dollar Amount
Select "Fixed Dollar" in the Risk Method dropdown and enter the dollar amount you want to risk.
You may set separate values for: NQ, MNQ, ES, and MES.
Reward Calculator:
Enable the checkbox "Show Reward Targets" in the Reward Ratio section to display projected targets (1R, 2R, etc.).
You can also choose how many R-levels are displayed on the chart.

Position Sizing Calculator (Real-Time) - Futures Edition█ SUMMARY
The following indicator is a Position Sizing Calculator based on Average True Range (ATR), originally developed by market technician J. Welles Wilder Jr., intended for real-time trading.
This script utilizes the user's account size, acceptable risk percentage, and a stop-loss distance based on ATR to dynamically calculate the appropriate position size for each trade in real time.
█ BACKGROUND
Developed for use on the Micro E-mini Nasdaq-100 futures (MNQ), this script provides traders with continuously updated dynamic position sizes. It enables traders to instantly determine the exact number of contracts to use when entering a trade while staying within their acceptable risk tolerance.
This real-time position sizing tool helps traders make well-informed decisions when planning trade entries and calculating maximum stop-loss levels, ultimately enhancing risk management.
█ USER INPUTS
Trading Account Size: Total dollar value of the user's trading account.
Acceptable Risk (%): Maximum percentage of the trading account that the user is willing to risk per trade.
ATR Multiplier for Stop-Loss: Multiplier used to determine the distance of the stop-loss from the current price, based on the ATR value.
ATR Length: The length of the lookback period used to calculate the ATR value.
Show Target Risk Row: Toggle to hide/show the Target Risk Row
SL Levels Display: Option to see Both, Long Only, Short Only, or None of the Stop Loss Level Values.
Contract Point Value ($): Point value per contract. Tooltip highlights common values.
Tick Size: Minimum Price Movement (Default set to 0.25)
Minimum Contracts: Override the Minimum Contracts per trade to a user selected value.
(May Exceed User's Target Risk)

Micro/Mini P&L [LDT]Overview
Micro/Mini P&L is a risk and P&L visualization tool built primarily for futures traders.
It provides accurate dollar-based calculations for either micros or minis, regardless of which contract type you are currently charting.
The indicator automatically detects your instrument (NQ, MNQ, ES, MES, YM, RTY, CL, GC, etc.) and adjusts point-value data accordingly, allowing you to chart one contract while evaluating risk for another.
This removes the need for manual conversions and keeps your position data consistent at all times.
Although optimized for futures, the tool also works on any other asset for general trade-level visualization.
Features
• Automatic instrument detection for major futures markets including NQ/MNQ, ES/MES, YM/MYM, RTY/M2K, CL/MCL, GC/MGC and others.
Point-value logic adjusts instantly based on the detected symbol ensuring accurate calculations without manual configuration.
• Micro/Mini display toggle, allowing you to calculate dollar values for either contract type regardless of which contract is on your chart.
Useful for traders who prefer charting minis whilst trading micros or the opposite.
• Trade-level visualization, including Entry, Take Profit and Stop Loss levels with automatically drawn lines and optional TP/SL zone shading for clear and structured display on the chart.
• Dynamic P/L calculations, showing both point-based and dollar-based metrics in real time.
This includes TP/SL dollar values, points to target/stop, real-time P/L and an optional risk-reward ratio.
• Adaptive risk table, displaying contract counts from 1 up to your selected maximum, total dollar risk for each row and highlighting your chosen contract size.
This provides a straightforward method for evaluating risk, scaling and position sizing.
• Customizable display options, including color settings, label visibility, extension length, bar offsets and table positioning.
This allows the tool to remain clean, unobtrusive and easy to integrate into any chart layout.
Purpose
This tool is designed to give futures traders a clear, consistent and reliable way to view dollar-accurate risk per contract without performing manual conversions.
Whether you trade micros or minis, the displayed values always align with your selected contract type, even when charting the opposite market.

Smart Range Breakout System (Zeiierman)█ Overview
Smart Range Breakout System (Zeiierman) is a full breakout–trend–risk framework engineered around volatility compression, adaptive range detection, and a volatility-adaptive structural mapping layer that continuously reshapes itself as price migrates away from compression zones. Rather than reacting to simple line breaks, the system identifies statistically quiet regimes, models the expansion phase as momentum re-enters the market, and then deploys a unified architecture of trend projection, dynamic trailing stops, and risk–reward structuring that evolves in real time with the unfolding move.
This tool is designed for traders who want a self-contained breakout workflow: first detect valid ranges, then trade the expansion, then manage the trend and exits via automatically generated levels and alerts.
⚪ Why This One Is Unique
The core engine combines a custom price-contraction model with volatility-responsive boundary levels to detect when the market is transitioning between quiet and active phases. From this model, the script generates a smoothed synthetic average that acts as the reference point for identifying compression zones and validating breakout conditions. Using this foundation, the system builds a complete visual trade map: breakout boxes that mark consolidation, breakout markers that signal expansion, a trend cloud that tracks directional bias, adaptive trailing stops that follow price movement, and optional risk-reward levels that automatically adjust to each new breakout.
Unlike conventional breakout indicators that rely on a single high/low lookback, this system uses:
A price contraction engine that re-weights candle structure through a momentum-like transform, generating a stabilized price that better captures compression and release.
An adaptive low-volatility counter that waits for statistically quiet behavior before declaring a range.
█ Main Features
⚪ Breakout Signals With Dynamic Risk-Reward Levels
The system identifies meaningful breakouts emerging from compressed price zones and immediately maps a complete trade structure around each signal.
Each breakout generates:
Directional breakout markers to confirm expansion
Entry, Stop, TP1, and TP2 levels that are automatically projected
A dynamic trailing stop is added to lock in profits as the price moves
Risk and reward zones visualized through adaptive fills
Labels that update in real time as targets are reached or invalidated
This creates a clear, self-contained decision map that helps traders evaluate opportunities, manage risk, and track the progression of each breakout without manual calculations.
⚪ Trend Cloud
A continuously updating Trend Cloud highlights the active directional regime and offers immediate visual trend identification through its color-coded bias. It shows whether a breakout aligns with the prevailing direction, provides a smoother and more stable representation of the trend than raw price alone, and creates an intuitive backdrop for distinguishing trend-following opportunities from countertrend setups. By filtering out noise and emphasizing directional stability, the cloud helps improve timing, signal quality, and overall alignment with the dominant market structure.
█ How to Use
⚪ Breakout Trading from Range Boxes
1. Identify Compression Zones
Look for periods where the Range Breakout Box appears: this signals a statistically quiet regime where price has compressed around a bounded range.
The box top and bottom approximate the upper and lower bounds of the market’s recent equilibrium.
2. Trade the Expansion
Bullish Breakout:
Triggered when the synthetic price crosses above the box top.
A green breakout marker appears below the price (triangle up).
This signals that price is breaking out of the compression zone with enough momentum to establish a meaningful structural move to the upside.
Bearish Breakout:
Triggered when the price crosses below the box bottom.
A red breakout marker appears above the price (triangle down).
Signals a breakdown out of the range to the downside.
⚪ Trend Following with the Trend Cloud
The Trend Cloud is a volatility-responsive band that adjusts to the system’s internal trend. In bullish conditions, it shifts to the up-color beneath price, and in bearish conditions, it flips to the down-color above price, giving a clear visual read of market direction.
The cloud effectively separates impulsive trend legs from noise, so you can align breakout trades only with the dominant directional regime.
Long Setups
Favor long setups (Break Up) when the price is traveling above or inside a bullish cloud.
Short Steups
Favor short setups (Break Down) when the price is below or inside a bearish cloud.
Ignore counter-trend breakouts that form directly against a strong, stable cloud unless you are intentionally trading mean reversion.
⚪ Breakout Management and Risk-Reward
Once a breakout occurs, the system instantly activates a directional trailing stop that follows the trend. For long setups, the stop stays below the price and moves upward as momentum builds. For short setups, it stays above the price and moves downward as the trend strengthens. If price hits the trailing stop, an X-cross appears on the chart to mark the exit, and the stop is reset for the next signal. You can adjust the sensitivity to make the stop tighter or more relaxed, depending on your preference.
When Risk-Reward Levels are enabled, the script also builds a complete trade structure around the breakout. It places an entry line at the breakout close, and projects two target levels forward. The area between entry and stop is shaded as risk, while the area toward the targets is shaded as reward. Labels update automatically as targets are reached, turning into a clear confirmation mark when a level is hit and signaling with an icon if the stop is touched.
Together, the trailing stop and risk-reward ladder create a clear, real-time map of each breakout’s progression, helping you manage risk, monitor targets, and follow the move with structure and confidence.
█ How It Works
⚪ Compression Detection & Range Formation
The system identifies quiet market phases where price contracts into narrow zones and stabilizes around a synthetic equilibrium level. These zones form the foundation for valid breakout opportunities.
Calculation: Persistence-based boundary tracking with volatility-normalized change detection and equilibrium anchoring to identify statistically constrained price regimes.
⚪ Breakout Engine
Breakouts occur only when the internal average breaks out of a validated compression zone, confirming that the market is transitioning from containment to expansion.
Calculation: Boundary-crossing logic on dispersion-expanded structures with directional state shifts encoded through threshold-gated transitions.
⚪ Trend State
A dynamic trend state guides directional bias, while the Trend Cloud visually expresses this bias directly on the chart, shifting beneath or above the price depending on the active regime.
Calculation: Dual-regime state modeling using filtered directional vectors, volatility-responsive offsets, and continuity enforcement to avoid noise-driven flips.
-----------------
Disclaimer
The content provided in my scripts, indicators, ideas, algorithms, and systems is for educational and informational purposes only. It does not constitute financial advice, investment recommendations, or a solicitation to buy or sell any financial instruments. I will not accept liability for any loss or damage, including without limitation any loss of profit, which may arise directly or indirectly from the use of or reliance on such information.
All investments involve risk, and the past performance of a security, industry, sector, market, financial product, trading strategy, backtest, or individual's trading does not guarantee future results or returns. Investors are fully responsible for any investment decisions they make. Such decisions should be based solely on an evaluation of their financial circumstances, investment objectives, risk tolerance, and liquidity needs.

BTC Risk Metric DCA Adapter (3Commas Webhook Strategy)Risk Metric DCA Adapter (3Commas Webhook Strategy) - WORK IN PROGRESS
This Pine Script strategy, originally inspired by the Risk Metric Indicator, is fundamentally engineered as an Adapter to interface with external trading bots like 3Commas via Webhooks. It calculates a dynamic market risk score and translates that score into specific dollar-cost averaging (DCA) entry levels and tiered profit-taking exits.
Key Features & Logic
Risk Metric Calculation (Credit to The Trading Parrot):
The strategy incorporates a complex, multi-timeframe Risk Metric calculation based on daily and weekly moving averages (SMA) and standard deviation (StDev). This metric aims to quantify the current market overextension or compression relative to long-term historical data. The resulting score dictates the level of conviction for a new trade.
Tiered DCA Entry Sizing:
The strategy defines three distinct Buy Levels (L1, L2, L3) corresponding to increasingly favorable (lower) Risk Metric scores.
L1 (Base): Risk is moderate, initiating the minimum defined trade amount.
L2 (Scaled): Risk is low, initiating L1 amount + L2 amount.
L3 (Aggressive): Risk is very low, initiating L1 + L2 + L3 amounts.
Tiered Profit-Taking Exits:
The strategy implements a staggered, partial profit-taking approach based on the Risk Metric rising:
Sell L1 & L2: Closes a percentage of the current position when the Risk Metric reaches defined high thresholds, locking in partial profits.
Sell L3 (Full Exit): Closes the remaining position when the Risk Metric reaches the highest defined threshold.
The Adapter Function (Webhook Integration)
This script is unique because it uses the Pine Script strategy() function to trigger Order Fills, which are necessary to access powerful placeholders in the TradingView alert system.
Trigger Type: The alert must be set to trigger on Any order fill.
Dynamic Webhook Data: Instead of using fixed alert() commands, the strategy generates dynamic labels (e.g., BUY_ENTRY_L3_USD_1000 or SELL_L1_PCT_25) using the strategy.entry and strategy.close commands.
Data Transfer: The alert message then uses the placeholder {{strategy.order.comment}} to pass these dynamic labels to the 3Commas bot, allowing the bot to execute the precise action (e.g., start_deal_with_volume_in_quote_currency or close_deal_at_market_percentage).
Full Strategy Webhook payload
{
"secret": "YOUR_3COMMAS_SECRET_KEY",
"max_lag": "300",
"timestamp": "{{timenow}}",
"trigger_price": "{{close}}",
"tv_exchange": "{{exchange}}",
"tv_instrument": "{{ticker}}",
"action": "{{strategy.order.action}}",
"bot_uuid": "YOUR_BOT_UUID",
"strategy_info": {
"market_position": "{{strategy.market_position}}",
"market_position_size": "{{strategy.market_position_size}}",
"prev_market_position": "{{strategy.prev_market_position}}",
"prev_market_position_size": "{{strategy.prev_market_position_size}}"
},
"order": {
"amount": "{{strategy.order.contracts}}",
"currency_type": "base",
"comment": "{{strategy.order.comment}}"
}
}
Disclaimer: This script is an adapter tool and does not guarantee profit. Trading requires manual configuration of risk settings, bot parameters, and adherence to platform-specific setup instructions.

Lot Size Calculator for FX(JPY Base)-By Jason v1.1 ロッド自動計算ツール🧭概要
このインジケーターは、日本円口座で取引するFXトレーダー専用に設計されたロットサイズ自動計算ツールです。
クロス円だけでなく、ドルストレート通貨ペア(EURUSD・GBPUSD・など)も自動換算に対応。
リアルなJPY換算ベースで、リスクとロットを正確に可視化します。
🎯 主な特徴
✅ JPY自動換算対応
ドルストレート・クロス円ペアを問わず、リアルタイムでJPYベースに換算。
✅ リスク/リワード自動計算
口座残高・ストップロス・リスク割合・固定損失額からロットサイズを即時算出。
✅ 証拠金維持率 / 実効レバレッジ表示
過剰エントリーを防ぎ、リスクを数値で管理。
✅ パネル表示を自由カスタマイズ
* 表示項目を個別にON/OFF可能
* 項目名(ラベル)を自分の言葉に変更可能
* パネル位置・文字サイズ・色・背景も自由設定
✅ 日本口座仕様に最適化
DMM、GMO、外為どっとコムなどJPY建て口座での取引計算に完全対応。
💡 推奨リスク管理ルール(プロトレーダー実践例)
プロ仕様のトレードは、「勝つこと」より「失わないこと」を最優先に行われます。
安定して利益を積み上げるトレーダーは、常に明確なリスク基準をもって行動します。
以下は、その代表的なリスク管理ルールです。
📉 連敗時のリスクコントロール(防御モード)
* 1トレードあたり口座残高の1%以下に抑える
* 連続2~3敗でリスクを半分(例:1%→0.5%)に下げる
* 1日の最大損失率を 3〜5%以内に制限(到達したらその日は終了)
* 「メンタルドローダウン」を避けるために連敗日翌日は休むことも多い
📘 目的:生き残ること。資金を守ることが最大の攻撃。
📈 連勝時のリスクコントロール(拡張モード)
* 2連勝以上の場合、**リスクを段階的に拡大(例:1%→1.5%)**
* ただし、最大でも3%以内
* リワードが積み上がっている時にのみ増加させる(利益分をリスクに再投資)
📘 目的:勝っている時にリスクを“複利的”に活かすが、ルール内にとどめる。
🧠 デイリーマネジメントルール(プロ基準)
1トレードリスク : 1〜2%以内
1日最大損失 :3〜5%以内
1週間最大損失 : 10%以内
リスクリワード比 :最低 1 : 2(理想は 1 : 3 以上)
勝率の目安 : 40〜50%でもRR管理で黒字維持可能
⚙️ このツールを使う理由
このロット計算機を使えば、
「感覚的なロット設定」から「数値的なリスク管理」へ進化できます。
✅ 過剰ロット防止
✅ 損失率の明確化
✅ 勝ち負けのバランス最適化
✅ 冷静なトレード継続が可能に
🧩 使い方
1️⃣ チャートにインジケーターを追加
2️⃣ 「口座残高」「リスク割合」「ストップロス(pips)」を設定
3️⃣ 「ロットサイズ」欄の数値が、**最適ロットサイズ**
4️⃣ リスク指標(証拠金維持率・実効レバレッジ)をチェック
⚠️ 免責事項
このインジケーターは教育目的の補助ツールです。
最終的な売買判断はご自身の責任で行ってください。
---
🧾 クレジット
Developed for Japanese Traders 🇯🇵
Optimized for FX Based Risk Control
Created by
💬 まとめ
資金を守ることは「守り」ではなく、次のチャンスに立ち続けるための最強の戦略です。
リスクを管理できる者だけが、長期的に勝ち続けることができます。
🧩 今後について
このインジケーターは、今後も使いやすさと精度を追求しながら改善を続けていきます。
もちろんです。以下は、あなたの日本語説明文を**自然でプロフェッショナルな英語**に翻訳したものです。
TradingViewのインジケーター説明欄にそのまま使えるトーン(ややフォーマル+分かりやすい)で整えています👇
---
🧭 Overview
This indicator is a **lot size auto-calculator** designed specifically for **FX traders using Japanese Yen (JPY) accounts**.
It automatically converts values not only for JPY crosses but also for **USD-based pairs (e.g., EURUSD, GBPUSD, etc.)**,
providing precise **risk and lot visualization in real JPY terms**.
🎯 Key Features
✅ **Automatic JPY Conversion**
Real-time JPY-based conversion for both USD and JPY pairs.
✅ **Risk / Reward Auto Calculation**
Instantly calculates the optimal lot size based on account balance, stop loss, and defined risk percentage or fixed loss.
✅ **Margin Maintenance Rate / Effective Leverage Display**
Prevents over-leveraging and allows you to monitor your risk numerically.
✅ **Fully Customizable Panel Display**
* Enable or disable each display item individually
* Rename labels freely to your preferred wording
* Adjust panel position, font size, colors, and background
✅ **Optimized for Japanese Brokerage Accounts**
Fully compatible with major JPY-based brokers such as **DMM, GMO, and Gaitame.com**.
💡 Recommended Risk Management Rules (Professional Trader Practices)
Professional trading prioritizes **“not losing” over “winning.”**
Consistent traders operate with a clear and disciplined risk framework.
Here are the most common examples of professional risk management rules:
📉 Loss Streak Risk Control (Defensive Mode)
* Keep risk per trade below **1% of account balance**
* After **2–3 consecutive losses**, reduce risk by half (e.g., 1% → 0.5%)
* Limit daily loss to **3–5%** — stop trading once reached
* Take a break after a losing streak to avoid **mental drawdown**
📘 **Objective:** Survival first. Protecting capital is the strongest form of offense.
📈 Win Streak Risk Control (Expansion Mode)
* After 2 consecutive wins, **gradually increase risk (e.g., 1% → 1.5%)**
* Never exceed **3% total risk per trade**
* Only scale up when trading with accumulated profit — reinvest from gains, not from capital
📘 **Objective:** Use profits to grow risk *compoundedly*, but always within defined limits.
🧠 Daily Risk Management (Professional Standards)
Risk per trade : 1–2% of account balance
Max daily loss : 3–5%
Max weekly loss :10%
Minimum R:R ratio : 1 : 2 (Ideal: 1 : 3 or higher)
Profitability baseline : 40–50% win rate can still stay profitable with proper R:R control
⚙️ Why Use This Tool?
This calculator helps you shift from **“emotional lot sizing” to “numerical risk control.”**
✅ Prevents over-lotting
✅ Clarifies risk exposure
✅ Balances wins and losses
✅ Enables calm, consistent execution
🧩 How to Use
1️⃣ Add the indicator to your chart
2️⃣ Set your **account balance**, **risk percentage**, and **stop loss (pips)**
3️⃣ The **“Lot Size”** value automatically displays the optimal lot size
4️⃣ Check risk indicators such as **Margin Maintenance** and **Effective Leverage**
⚠️ Disclaimer
This indicator is a **support tool for educational purposes only**.
All final trading decisions are the sole responsibility of the user.
🧾 Credits
Developed for **Japanese Traders 🇯🇵**
Optimized for **FX-Based Risk Control**
Created by ** **
💬 Summary
Protecting your capital isn’t a defensive move —
it’s the **strongest strategy to stay in the game and seize the next opportunity**.
Only those who manage risk properly can sustain consistent long-term success.
🧩 Future Updates
This indicator will continue to evolve with improvements in usability and accuracy.
Stay tuned for upcoming updates and refinements.

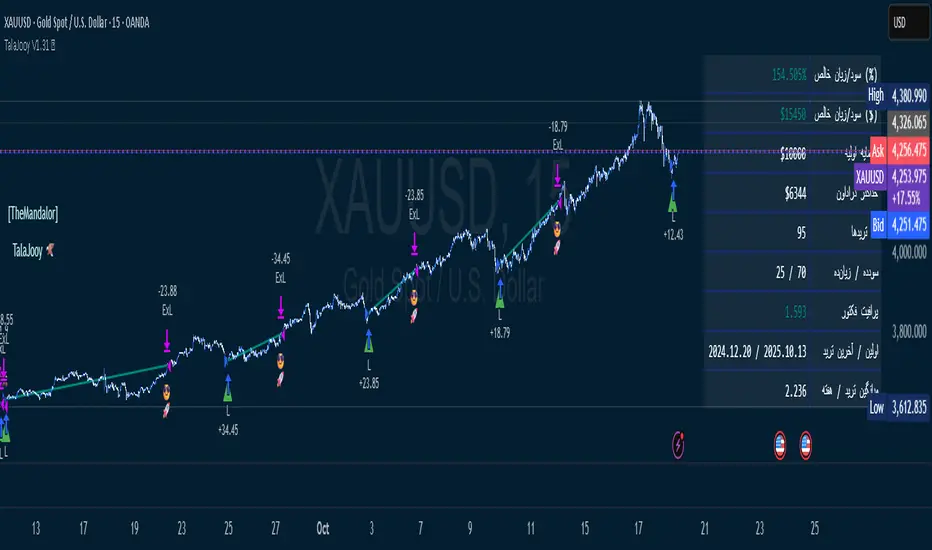
TalaJooy V1.31 𓅂💎 استراتژی معاملاتی TalaJooy V1.31 𓅂
TalaJooy (طلاجوی) یک چارچوب معاملاتی حرفهای و کامل برای TradingView است که برای حذف حدس و گمان، احساسات و تصمیمگیریهای هیجانی از فرآیند معاملات طراحی شده است.
این محصول یک «اندیکاتور سیگنالدهی» ساده نیست؛ بلکه یک استراتژی (Strategy) کامل است که چهار وظیفه کلیدی را به صورت خودکار انجام میدهد:
تحلیل بازار (بر اساس یک موتور امتیازدهی کمی)
صدور سیگنال (ورود و خروج شفاف)
مدیریت ریسک پویا (محاسبه خودکار حد ضرر)
مدیریت حجم پوزیشن (محاسبه خودکار حجم بر اساس ریسک)
هدف «طلاجوی» تبدیل معاملهگری شهودی به یک فرآیند مکانیکی، مبتنی بر داده و مدیریت ریسک است.
⚙️ قابلیتهای کلیدی (آنچه دریافت میکنید)
این استراتژی مجهز به مجموعهای از ابزارهای حرفهای است که مستقیماً روی چارت شما اجرا میشوند:
🎯 ۱. سیگنالهای ورود و خروج شفاف
فلشهای واضح خرید (▲) و فروش (▼) که نقاط دقیق ورود بر اساس منطق استراتژی را مشخص میکنند. این سیستم تنها زمانی سیگنال صادر میکند که فیلترهای روند، همسویی لازم را تایید کنند.
🛡️ ۲. مدیریت ریسک پویای ATR
بزرگترین چالش معاملهگران، تعیین حد ضرر (SL) مناسب است. این استراتژی حد ضرر را به صورت خودکار و پویا بر اساس نوسانات واقعی بازار (با استفاده از ATR) محاسبه میکند.
نتیجه: در بازارهای پرنوسان، استاپ شما برای جلوگیری از استاپهانت شدن، فاصله ایمنتری میگیرد و در بازارهای آرام، بهینهتر و نزدیکتر تنظیم میشود.
💰 ۳. محاسبه خودکار حجم پوزیشن
دیگر نیازی به «ماشین حساب پوزیشن» ندارید. استراتژی به صورت اتوماتیک، حجم دقیق هر معامله را بر اساس درصد ریسک ثابتی که شما از کل سرمایهتان تعیین میکنید، محاسبه مینماید. این ویژگی، مدیریت سرمایه حرفهای را در تمام معاملات شما تضمین میکند.
🎨 ۴. نواحی بصری سود و زیان (TP/SL)
هنگامی که یک معامله باز است، این ابزار به صورت زنده، نواحی حد سود (سبز) و حد ضرر (قرمز) را مشابه ابزار پوزیشن خود تریدینگ ویو، مستقیماً روی چارت برای شما رسم میکند.
📈 ۵. پنل آمار عملکرد پیشرفته
یک جدول آماری جامع که تمام معیارهای کلیدی عملکرد شما را به صورت زنده نمایش میدهد:
سود و زیان خالص (دلاری و درصدی)
ضریب سود (Profit Factor)
نرخ موفقیت (Win Rate)
تعداد معاملات سودده / زیانده
حداکثر افت سرمایه (Max Drawdown)
و موارد دیگر...
🚦 ۶. آیکونهای بازخورد معامله
با آیکونهای هوشمند، فوراً کیفیت معاملات بسته شده خود را ارزیابی کنید:
😎🚀 (سود ویژه و قابل توجه)
💰 (سود عادی)
🙈 (زیان)
📈 چگونه از این ابزار استفاده کنید؟
«طلاجوی» یک 'ماشین چاپ پول' جادویی نیست، بلکه یک ابزار تست و اجرای حرفهای است.
۱. بکتست و بهینهسازی (Backtesting)
مهمترین قدرت این اسکریپت، قابلیت Strategy بودن آن است. شما میتوانید این استراتژی را روی هر جفتارز و تایم فریمی که معامله میکنید (طلا، کریپتو، جفتارزها و...) بکتست بگیرید تا آمار عملکرد آن را مشاهده کنید.
۲. تنظیم پارامترها
از طریق منوی تنظیمات، پارامترهای کلیدی مانند درصد ریسک، نسبت ریسک به ریوارد (R:R)، و فیلترهای زمانی را مطابق با سبک معاملاتی و دارایی مورد نظر خود بهینهسازی کنید.
۳. اجرای سیستماتیک
پس از یافتن تنظیمات بهینه در بکتست، در معاملات زنده به سیگنالها پایبند بمانید و اجازه دهید منطق مکانیکی، معاملات شما را مدیریت کند.
⚠️ سلب مسئولیت مهم (مطابق با قوانین TradingView)
این اسکریپت صرفاً یک ابزار تحلیلی و معاملاتی است و نباید به عنوان سیگنال مالی یا توصیهای برای خرید و فروش تلقی شود. تمام معاملات دارای ریسک هستند و نتایج گذشته تضمینکننده عملکرد آینده نمیباشد.
لطفاً قبل از استفاده از این استراتژی در حساب واقعی، آن را به طور کامل در حالت دمو یا بکتست ارزیابی کنید. مسئولیت تمامی سودها و زیانها بر عهده خود معاملهگر است.
💎 TalaJooy V1.31 𓅂 Trading Strategy
TalaJooy (meaning "Gold Seeker") is a complete, professional trading framework for TradingView, designed to remove guesswork, emotion, and impulsive decisions from your trading process.
This is not a simple signal indicator; it is a complete Strategy script that automates four key tasks:
Market Analysis (Based on a quantitative scoring engine)
Signal Generation (Clear entries and exits)
Dynamic Risk Management (Automated Stop Loss calculation)
Position Sizing (Automated trade sizing based on risk)
The goal of "TalaJooy" is to transform intuitive trading into a mechanical, data-driven, and risk-managed process.
⚙️ Key Features (What You Get)
This strategy comes equipped with a suite of professional tools that run directly on your chart:
🎯 1. Clear Entry & Exit Signals
Receive unambiguous Buy (▲) and Sell (▼) arrows identifying precise entry points based on the strategy's logic. The system only generates signals when its trend-confirmation filters are aligned.
🛡️ 2. Dynamic ATR Risk Management
A trader's biggest challenge is setting a proper Stop Loss (SL). This strategy calculates your SL automatically and dynamically based on real-time market volatility (using ATR).
The Benefit: In volatile markets, your stop is placed at a safer distance to avoid being "stopped out" by noise. In calm markets, it's set tighter and more efficiently.
💰 3. Automated Position Sizing
Stop using external "position size calculators." The strategy automatically calculates the exact trade size for every position based on a fixed risk percentage of your total equity (which you define). This enforces professional money management on every trade.
🎨 4. Visual Profit & Loss (TP/SL) Zones
While a trade is active, this tool plots live, visual zones for your Take Profit (green) and Stop Loss (red) targets, similar to TradingView's native "Long/Short Position" tool.
📈 5. Advanced Performance Stats Panel
A comprehensive statistics table displays all your key performance metrics in real-time:
Net Profit (% and $)
Profit Factor
Win Rate
Win / Loss Trade Count
Max Drawdown
And more...
🚦 6. Smart Trade Feedback Icons
Instantly review the quality of your closed trades with intelligent emoji feedback:
😎🚀 (Exceptional Profit)
💰 (Standard Profit)
🙈 (Loss)
📈 How to Use This Tool
"TalaJooy" is not a "magic money machine"; it is a professional-grade tool for testing and execution.
1. Backtesting & Optimization
The most powerful feature of this script is its Strategy component. You can backtest it on any asset or timeframe you trade (Gold, Crypto, Forex, etc.) to see its historical performance data.
2. Parameter Tuning
Use the settings menu to optimize key parameters—such as Risk Percentage, Risk:Reward Ratio, and core filter settings—to match your personal trading style and preferred assets.
3. Systematic Execution
After identifying optimal settings via backtesting, adhere to the signals in your live trading and let the mechanical logic manage your trades.
⚠️ Important Disclaimer (TradingView Compliant)
This script is provided for educational and analytical purposes only. It is not financial advice or a recommendation to buy or sell any asset. All trading involves substantial risk. Past performance is not indicative of future results.
Please thoroughly evaluate this strategy via backtesting or paper trading before deploying it with real funds. The user assumes full responsibility for all profits and losses incurred.
Risk ModuleThis indicator provides a visual reference for position sizing and approximate stop and target placement. It supports trade planning by calculating equalized risk per trade and maintaining consistent exposure across different markets.
For more information about the concept, see the post Position Sizing and Risk Management .
Fixed Fractional Risk
The indicator calculates the number of shares that can be traded to maintain consistent monetary risk. The formula is based on the distance between the current price and stop reference, adjusting position size proportionally. A closer stop results in a larger position size, while a wider stop results in a smaller one.
Position Size = (Account Size × Risk %) ÷ (Entry Price – Stop Price)
Stop and Target
Stop placement is derived from volatility using the Average True Range (ATR). The target is plotted as a multiple of the stop distance, defining the risk-to-reward relationship in R units.
Stop = Price ± ATR × Multiplier
Target = Price ± (R × Risk Distance)
Chart Elements
The stop and target levels are plotted above and below the current price, with the stop marked by a red dot and the target by a green dot. The information table displayed on the chart shows the number of shares to trade, stop level, and target level.
Setup and Configuration
This configuration only needs to be set once, but can be adjusted later if preferred.
1. Start by setting the account size and risk percentage per trade to define the monetary amount risked on each trade. These values form the basis for position size calculation.
2. Set the ATR multiplier to determine stop distance, common values range between 1 and 3 ATR. Lower values place stops closer to price, increasing sensitivity but risking short-term noise. Higher values widen the stop, which reduces noise impact but extends time in risk.
3. Set the R-multiple to determine target distance relative to the stop. A value of 1 represents a 1:1 risk-to-reward relationship. Lower values reduce potential reward but tend to increase win rate, whereas higher values increase potential reward but tend to reduce win rate. The selection depends on system characteristics and trade expectancy.
When the parameters are defined, the indicator displays the stop, target, and calculated position size on the chart. All that remains is to enter the trade with the number of shares shown in the table and place bracket orders at the plotted stop and target levels.
Settings Overview
Account Size / Risk %: Defines account capital and per-trade exposure.
ATR Multiplier: Adjusts stop distance relative to volatility.
R Multiple: Sets target distance relative to stop (risk-reward ratio).
Position: Choose Long or Short direction.
Table Position: Controls information table placement and scale.

Trade PullBack - EMA Pullback System with Auto Risk-Reward# Trade Pull Back - Professional Pullback Trading System
## 📊 Overview
**Trade Pull Back** is a comprehensive pullback trading system that combines trend-following principles with precise entry timing using candlestick pattern confirmation. This indicator is designed for traders who want to enter trending markets at optimal retracement levels with pre-calculated risk-reward ratios.
---
## 🎯 Core Methodology
### Why This System Works
Most traders struggle with two key challenges:
1. **Entering too early** - jumping into trades before the pullback completes
2. **Entering too late** - missing the momentum after the pullback reverses
This system solves both problems by using a **3-Phase Confirmation Process**:
**Phase 1: Trend Identification** → **Phase 2: Pullback Detection** → **Phase 3: Reversal Confirmation**
---
## 🔧 How It Works
### 1. Triple EMA Framework (The Foundation)
Unlike traditional single EMA systems, this indicator uses **3 separate EMAs** with different purposes:
- **EMA Trend (default: 50)** - Determines the overall market direction
- Source: HL/2 for balanced trend reading
- Acts as the primary filter - we only trade in its direction
- **EMA High (default: 20)** - Dynamic resistance in uptrends
- Source: High prices for accurate resistance mapping
- Entry trigger for bullish setups when price closes above it
- **EMA Low (default: 20)** - Dynamic support in downtrends
- Source: Low prices for accurate support mapping
- Entry trigger for bearish setups when price closes below it
**Why 3 EMAs?**
- Single EMA can't distinguish between trend and pullback zones
- Two EMAs (like MACD) don't provide clear entry/exit levels
- Three EMAs create a **channel system** that identifies both trend direction AND optimal entry zones
### 2. Pattern Recognition Engine
The system detects two high-probability reversal patterns:
#### Engulfing Patterns
- **Bullish Engulfing**: Previous bearish candle completely engulfed by bullish candle
- **Bearish Engulfing**: Previous bullish candle completely engulfed by bearish candle
- Validates: Strong momentum reversal with volume confirmation
#### Pin Bar Patterns
- **Bullish Pin Bar (Hammer)**: Long lower wick (60%+ of total range) rejecting lower prices
- **Bearish Pin Bar (Inverted Hammer)**: Long upper wick (60%+ of total range) rejecting higher prices
- Validates: Institutional rejection at support/resistance levels
**Pattern Quality Filter:**
- Body-to-wick ratio must meet minimum standards
- Checks previous candle momentum
- Requires trend alignment before signaling
### 3. Pullback Confirmation System
The system includes **5 mandatory conditions** before generating a signal:
#### For Bullish Signals (BUY):
1. ✅ Close > EMA Trend (uptrend confirmed)
2. ✅ EMA High > EMA Trend AND EMA Low > EMA Trend (healthy trend structure)
3. ✅ Bullish Engulfing OR Bullish Pin Bar (pattern detected)
4. ✅ Close > EMA High (breakout confirmation)
5. ✅ Optional: Low < EMA High (pullback occurred)
#### For Bearish Signals (SELL):
1. ✅ Close < EMA Trend (downtrend confirmed)
2. ✅ EMA High < EMA Trend AND EMA Low < EMA Trend (healthy trend structure)
3. ✅ Bearish Engulfing OR Bearish Pin Bar (pattern detected)
4. ✅ Close < EMA Low (breakdown confirmation)
5. ✅ Optional: High > EMA Low (pullback occurred)
**Additional Filters:**
- **Consecutive Bars Check**: Ensures pullback had momentum (1-5 bearish/bullish bars)
- **Signal Spacing**: Minimum 4 bars between signals to avoid noise
- **Confirmation Delay**: Signal appears only AFTER bar closes (no repainting)
---
## 💰 Automatic Risk-Reward Calculator
### Smart Position Sizing
When a signal triggers, the system automatically calculates:
**For Long Positions:**
- **Entry**: High of signal candle
- **Stop Loss**: Lower of last 2 candle lows (protects against false breakouts)
- **Target 1 (1R)**: Entry + 1x Risk
- **Target 2 (2R)**: Entry + 2x Risk
- **Target 3 (3R)**: Entry + 3x Risk
**For Short Positions:**
- **Entry**: Low of signal candle
- **Stop Loss**: Higher of last 2 candle highs
- **Targets**: Calculated based on risk multiple
### Auto-Remove Feature
Lines and labels automatically disappear when:
- Price hits Stop Loss (trade invalidated)
- Price reaches 3R target (trade complete)
This keeps your chart clean and focuses only on active trades.
---
## 📈 Multi-Timeframe Trend Analysis
### Confluence Trading
The built-in MTF trend box shows trend status across 7 timeframes simultaneously:
- M1, M5, M15, M30, H1, H4, D1
**Color Coding:**
- 🟢 **Green**: Uptrend (Price > EMA Trend AND EMAs aligned bullish)
- 🔴 **Red**: Downtrend (Price < EMA Trend AND EMAs aligned bearish)
- ⚪ **Gray**: No clear trend
**Why This Matters:**
- Trade with higher timeframe trends for better win rate
- Avoid counter-trend trades when all timeframes show same direction
- Identify divergences between timeframes for reversal opportunities
---
## 🎨 Customization Options
### EMA Settings
- Adjust periods for different trading styles (scalping vs swing trading)
- Choose price sources (HL/2, Close, HLC/3) for sensitivity tuning
### Pattern Selection
- Enable/disable Engulfing patterns
- Enable/disable Pin Bar patterns
- Trade only your preferred pattern type
### Signal Filters
- **Require Pullback**: Force pullback condition (stricter entries)
- **Consecutive Bars**: Set momentum requirement (1-5 bars)
### Display Options
- Show/hide EMA lines
- Show/hide signals
- Enable/disable alerts
- Customize Risk-Reward line styles and extensions
---
## 📋 How to Use This Indicator
### Step 1: Identify the Trend
- Wait for price to establish clear direction relative to EMA Trend (50)
- Check MTF box to confirm higher timeframe alignment
### Step 2: Wait for Pullback
- In uptrend: Watch for price to pull back toward EMA High
- In downtrend: Watch for price to pull back toward EMA Low
### Step 3: Pattern Confirmation
- Look for Engulfing or Pin Bar pattern (triangle/diamond markers)
- Ensure pattern forms at or near the EMA High/Low zone
### Step 4: Entry & Risk Management
- Enter when signal appears (after bar closes)
- Use displayed Stop Loss and Take Profit levels
- Consider partial profits at 1R and 2R, let remainder run to 3R
### Step 5: Trade Management
- If price hits SL, lines disappear automatically (trade invalidated)
- If price reaches 3R, lines disappear (trade complete)
- Consider trailing stop after 1R is reached
---
## ⚙️ Recommended Settings
### For Scalping (M1-M5)
- EMA Trend: 20-30
- EMA High/Low: 10-15
- Require Pullback: OFF
- Consecutive Bars: 1
### For Day Trading (M15-H1)
- EMA Trend: 50 (default)
- EMA High/Low: 20 (default)
- Require Pullback: ON
- Consecutive Bars: 2-3
### For Swing Trading (H4-D1)
- EMA Trend: 100-200
- EMA High/Low: 50
- Require Pullback: ON
- Consecutive Bars: 3-5
---
## ✅ What Makes This Script Original
### 1. Systematic Approach
This isn't just a collection of indicators. It's a **complete trading system** with:
- Defined entry rules (5-point confirmation checklist)
- Automatic risk management (SL/TP calculation)
- Trade validation (consecutive bars, signal spacing)
### 2. Smart EMA Framework
The 3-EMA system creates a **dynamic channel** that adapts to market conditions:
- Trend EMA = Direction filter
- High/Low EMAs = Entry/Exit zones
- Together they form a "trade zone" that standard EMAs can't provide
### 3. Pattern Quality Control
Not all Engulfing or Pin Bar patterns are equal. This system:
- Validates body-to-wick ratios
- Checks previous candle momentum
- Requires trend alignment before signaling
### 4. Auto Risk-Reward Management
Most indicators just show signals. This one:
- Calculates exact entry prices
- Places stop loss at optimal location (lower of 2 lows)
- Projects 3 profit targets based on risk
- Auto-removes when trade is complete/invalidated
### 5. No Repainting
- All signals appear AFTER bar closes
- No future data leaking
- What you see in backtest = what you get in real-time
---
## 🚨 Alerts
Built-in alerts notify you when:
- Bullish signal confirmed
- Bearish signal confirmed
Alerts fire once per bar (no spam) and only after bar closes (no false alerts).
---
## 📊 Best Practices
### ✅ DO:
- Trade in direction of higher timeframe trends
- Wait for full confirmation (all 5 conditions met)
- Use proper position sizing (1-2% risk per trade)
- Let winners run to at least 2R
### ❌ DON'T:
- Trade against major trend on MTF box
- Enter before signal bar closes
- Ignore the Stop Loss level
- Overtrade - respect the 4-bar minimum spacing
---
## 🔍 Limitations
This indicator is a **tool**, not a crystal ball:
- No indicator wins 100% of the time
- False signals occur in choppy/ranging markets
- Best results in trending conditions
- Requires proper risk management
- Should be combined with fundamental analysis and market context
---
## 📚 Educational Value
This script teaches:
- How to combine trend following with mean reversion
- Pattern recognition and validation
- Risk-reward ratio calculation
- Multi-timeframe analysis
- Proper trade entry timing
---
## 🎓 Credits & Disclaimer
**Original Work**: All code written from scratch
**Methodology**: Based on classical technical analysis principles (EMA crossovers, candlestick patterns, support/resistance)
**Disclaimer**: This indicator is for educational purposes. Past performance does not guarantee future results. Always practice proper risk management.
---
## 📞 Support
If you find this indicator helpful:
- Leave a review
- Share with fellow traders
- Provide feedback for improvements
**Note**: This is a closed-source script to protect the proprietary signal logic and filtering algorithms. The description above provides comprehensive understanding of the methodology without revealing exact implementation details.
---
**Version**: 1.0
**Pine Script Version**: 5
**Type**: Indicator (Overlay)
**Category**: Trend Following + Pattern Recognition
---
*Happy Trading! 🚀*
# 🇹🇭 คู่มือภาษาไทย / Thai Guide
# Trade Pull Back - คู่มือภาษาไทย
## 📊 ภาพรวม
**Trade Pull Back** เป็นระบบเทรด Pullback ที่ผสมผสานการเทรดตามเทรนด์กับการจับจังหวะเข้าออเดอร์ด้วย Candlestick Pattern พร้อมคำนวณ Risk-Reward อัตโนมัติ
---
## 🎯 หลักการทำงาน
### ทำไมระบบนี้ได้ผล?
แก้ปัญหา 2 ข้อหลักของเทรดเดอร์:
1. **เข้าเร็วเกินไป** - เข้าก่อน Pullback เสร็จ
2. **เข้าช้าเกินไป** - พลาดโมเมนตัมหลังกลับตัว
**วิธีแก้**: ใช้กระบวนการยืนยัน 3 ขั้นตอน
- **ขั้น 1**: ระบุเทรนด์ → **ขั้น 2**: ตรวจจับ Pullback → **ขั้น 3**: ยืนยันการกลับตัว
---
## 🔧 ส่วนประกอบหลัก
### 1. ระบบ EMA 3 เส้น
ต่างจาก EMA ทั่วไป ระบบนี้ใช้ 3 เส้นที่มีหน้าที่แยกกัน:
- **EMA Trend (50)** - กำหนดทิศทางเทรนด์หลัก
- **EMA High (20)** - แนวต้านไดนามิก (สำหรับ Buy)
- **EMA Low (20)** - แนวรับไดนามิก (สำหรับ Sell)
**ทำไมต้อง 3 เส้น?**
- 1 เส้น = แยกเทรนด์กับ Pullback ไม่ได้
- 2 เส้น = ไม่มีจุด Entry/Exit ชัดเจน
- 3 เส้น = สร้าง Channel ที่บอกทั้งเทรนด์และโซนเข้าออเดอร์
### 2. ตรวจจับ Pattern
ระบบตรวจจับ 2 Pattern หลัก:
**Engulfing (แท่งกลืน)**
- Bullish: แท่งเขียวกลืนแท่งแดงทั้งหมด
- Bearish: แท่งแดงกลืนแท่งเขียวทั้งหมด
**Pin Bar (แท่งหาง)**
- Bullish: หางล่างยาว 60%+ ของช่วงทั้งหมด
- Bearish: หางบนยาว 60%+ ของช่วงทั้งหมด
### 3. เงื่อนไขยืนยันสัญญาณ (5 ข้อ)
**สัญญาณ Buy:**
1. ✅ ราคาปิด > EMA Trend (เทรนด์ขาขึ้น)
2. ✅ EMA High และ Low เหนือ EMA Trend (โครงสร้างดี)
3. ✅ เกิด Bullish Engulfing หรือ Pin Bar
4. ✅ ราคาปิด > EMA High (ยืนยัน Breakout)
5. ✅ ตัวเลือก: มี Pullback มาแตะ EMA High
**สัญญาณ Sell:**
1. ✅ ราคาปิด < EMA Trend (เทรนด์ขาลง)
2. ✅ EMA High และ Low ใต้ EMA Trend (โครงสร้างดี)
3. ✅ เกิด Bearish Engulfing หรือ Pin Bar
4. ✅ ราคาปิด < EMA Low (ยืนยัน Breakdown)
5. ✅ ตัวเลือก: มี Pullback มาแตะ EMA Low
**ตัวกรองเพิ่มเติม:**
- ต้องมีแท่งติดกัน 1-5 แท่ง (กำหนดได้)
- ห่างสัญญาณก่อนหน้าอย่างน้อย 4 แท่ง
- สัญญาณปรากฏหลังแท่งปิดเท่านั้น (ไม่ Repaint)
---
## 💰 คำนวณ Risk-Reward อัตโนมัติ
เมื่อสัญญาณเกิด ระบบคำนวณให้อัตโนมัติ:
**Long Position:**
- Entry = High ของแท่งสัญญาณ
- Stop Loss = Low ที่ต่ำกว่าของ 2 แท่งล่าสุด
- Target = 1R, 2R, 3R
**Short Position:**
- Entry = Low ของแท่งสัญญาณ
- Stop Loss = High ที่สูงกว่าของ 2 แท่งล่าสุด
- Target = 1R, 2R, 3R
**ลบอัตโนมัติ:** เส้นหายเมื่อราคาชน SL หรือถึง 3R
---
## 📈 กล่องเทรนด์หลาย Timeframe
แสดงเทรนด์พร้อมกัน 7 Timeframe:
- M1, M5, M15, M30, H1, H4, D1
**สีแสดงผล:**
- 🟢 เขียว = Uptrend
- 🔴 แดง = Downtrend
- ⚪ เทา = ไม่มีเทรนด์
**ประโยชน์:** เทรดตาม Timeframe ใหญ่เพื่อเพิ่ม Win Rate
---
## 📋 วิธีใช้งาน (5 ขั้นตอน)
1. **ระบุเทรนด์** - เช็คราคาเทียบกับ EMA Trend และกล่อง MTF
2. **รอ Pullback** - เฝ้าราคา Pullback มาที่ EMA High/Low
3. **เช็ค Pattern** - มองหาลูกศรสามเหลี่ยม (Engulfing) หรือเพชร (Pin Bar)
4. **เข้าออเดอร์** - เข้าเมื่อสัญญาณปรากฏ ใช้ SL/TP ที่แสดง
5. **จัดการเทรด** - เส้นจะหายเองเมื่อชน SL หรือถึง 3R
---
## ⚙️ การตั้งค่าแนะนำ
**Scalping (M1-M5)**
- EMA Trend: 20-30
- EMA High/Low: 10-15
- Require Pullback: ปิด
**Day Trading (M15-H1)**
- EMA Trend: 50 (ค่าเริ่มต้น)
- EMA High/Low: 20 (ค่าเริ่มต้น)
- Require Pullback: เปิด
**Swing Trading (H4-D1)**
- EMA Trend: 100-200
- EMA High/Low: 50
- Require Pullback: เปิด
---
## ✅ จุดเด่นที่แตกต่าง
1. **เป็นระบบสมบูรณ์** - ไม่ใช่แค่รวม Indicator
2. **EMA 3 เส้นสร้าง Channel** - บอกทั้งเทรนด์และโซนเข้า
3. **ตรวจสอบคุณภาพ Pattern** - ไม่ใช่ทุก Pattern ที่ให้สัญญาณ
4. **คำนวณ RR อัตโนมัติ** - วาง SL/TP ให้เลย
5. **ไม่ Repaint** - สัญญาณปรากฏหลังแท่งปิดเท่านั้น
---
## 📊 ควรทำ / ไม่ควรทำ
### ✅ ควรทำ:
- เทรดตามเทรนด์ Timeframe ใหญ่
- รอยืนยันครบ 5 เงื่อนไข
- เสี่ยง 1-2% ต่อเทรด
- ปล่อยกำไรไปอย่างน้อย 2R
### ❌ ไม่ควรทำ:
- เทรดทวนเทรนด์ในกล่อง MTF
- เข้าก่อนแท่งปิด
- ละเลย Stop Loss
- เทรดบ่อยเกินไป
---
## 🔍 ข้อจำกัด
- ไม่มี Indicator ไหนชนะ 100%
- สัญญาณผิดพลาดเกิดในตลาด Sideways
- ผลดีสุดในตลาดที่มีเทรนด์ชัด
- ต้องใช้ Money Management
- ควรดูปัจจัยพื้นฐานประกอบ
---
## 🎓 คำเตือน
**Disclaimer**: อินดิเคเตอร์นี้สำหรับการศึกษา ผลในอดีตไม่รับประกันอนาคต ใช้ Risk Management ที่เหมาะสมเสมอ
---
**เวอร์ชั่น**: 1.0
**Pine Script**: v5
**ประเภท**: Indicator (Overlay)
*Happy Trading! 🚀*
## Screenshots
**Bearish Signals with Risk-Reward:**
! (drive.google.com)
**Bullish Signal with Risk-Reward:**
! (drive.google.com)
**Multi-Timeframe Trend Box:**
! (drive.google.com)
**Settings Panel:**
! (drive.google.com)

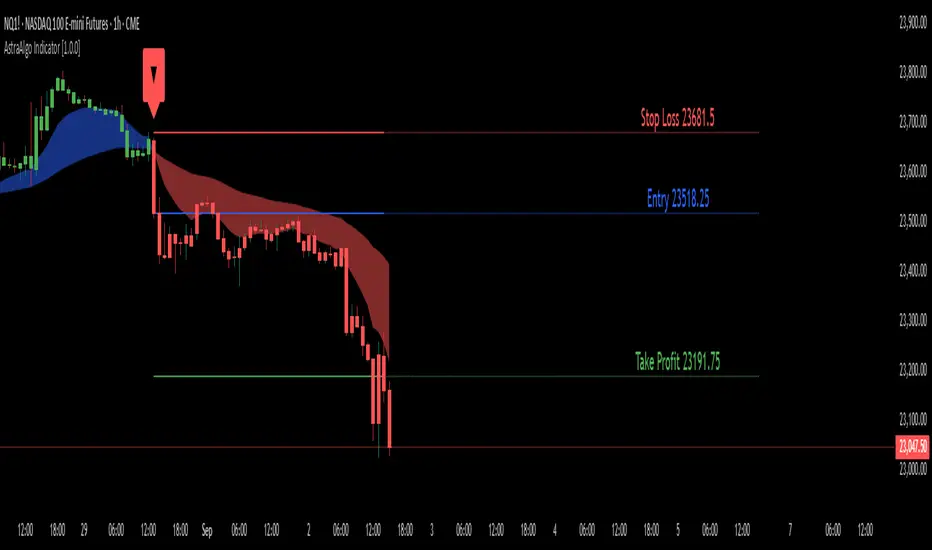
AstraAlgo IndicatorOVERVIEW
The AstraAlgo Indicator delivers precise, actionable trade signals on TradingView. With configurable signal modes, dynamic support and resistance, and a fully adjustable alerts system, it helps traders make informed decisions and manage risk effectively.
SIGNAL MODES
Signal Modes are the core of the AstraAlgo Indicator, providing users with proprietary trade signals tailored to their preferred complexity and style.
BAR COLORING
Bar Coloring provides a clear visual distinction between bullish and bearish candlesticks, allowing traders to interpret price action at a glance. This feature helps identify momentum and trend direction without analyzing raw price data.
ASTRA CLOUD
Astra Cloud is a dynamic support and resistance overlay that visually highlights key price zones on your TradingView charts. These zones adjust in real time to reflect market movements, helping traders identify areas of potential price reaction.
ALERTS
Alerts in the AstraAlgo Indicator are designed to keep traders informed of key market movements in real time. They notify you whenever a significant trading signal appears on your chart, ensuring you can act promptly even when you’re away from TradingView.
AstraAlgo BacktesterOVERVIEW
The AstraAlgo Backtester allows traders to simulate and evaluate trading strategies directly on TradingView. By simulating trades across different timeframes and markets, it provides valuable insights into win rates, drawdowns, and overall strategy effectiveness.
SIGNAL MODES
Signal Modes generate proprietary trade signals based on live price data. Users can choose between Off, Basic, Advanced, or Custom modes to evaluate strategies under different conditions and refine their trading approach.
ADJUSTABLE BACKTESTING
Parameters for historical simulations can be customized to test different market conditions and trading scenarios. This allows traders to measure strategy performance, including win rate, profit/loss, and risk/reward ratios, helping refine and optimize strategies before live execution.
BAR COLORING
Bar Coloring highlights bullish and bearish bars on historical charts, allowing traders to visually assess trend direction and trade outcomes during backtesting. This makes it easier to analyze momentum and strategy effectiveness at a glance.
ASTRA CLOUD
Astra Cloud overlays dynamic support and resistance levels on live price data. These zones adapt automatically to past market movements, helping traders identify areas where trades would have reacted, aiding strategy evaluation and optimization.

Best MA Finder: Sharpe/Sortino ScannerThis script, Best MA Finder: Sharpe/Sortino Scanner, is a tool designed to identify the moving average (SMA or EMA) that best acts as a dynamic trend threshold on a chart, based on risk-adjusted historical performance. It scans a wide range of MA lengths (SMA or EMA) and selects the one whose simple price vs MA crossover delivered the strongest results using either the Sharpe ratio or the Sortino ratio. Reading it is intuitive: when price spent time above the selected MA, conditions were on average more favorable in the backtest; below, less favorable. It is a trend and risk gauge, not an overbought or oversold signal.
What it does:
- Runs individual long-only crossover backtests for many MA lengths across short to very long horizons.
- For each length, measures the total number of trades, the annualized Sharpe ratio, and the annualized Sortino ratio.
- Uses the chosen metric value (Sharpe or Sortino) as the score to rank candidates.
- Applies a minimum trade filter to discard statistically weak results.
- Optionally applies a local stability filter to prefer a length that also outperforms its close neighbors by at least a small margin.
- Selects the optimal MA and displays it on the chart with a concise summary table.
How to use it:
- Choose MA type: SMA or EMA.
- Choose the metric: Sharpe or Sortino.
- Set the minimum trade count to filter out weak samples.
- Select the risk-free mode:
Auto: uses a short-term risk-free rate for USD-priced symbols when available.
Manual: you provide a risk-free ticker.
None: no risk-free rate.
- Optionally enable stability controls: neighbor radius and epsilon.
- Toggle the on-chart summary table as needed.
On-chart output:
- The selected optimal MA is plotted.
- The optional table shows MA length, number of trades, chosen metric value annualized, and the annual risk-free rate used.
Key features:
- Risk-adjusted optimization via Sharpe or Sortino for fair, comparable assessment.
- Broad MA scan with SMA and EMA support.
- Optional stability filter to avoid one-off spikes.
- Clear and auditable presentation directly on the chart.
Use cases:
- Traders who want a defensible, data-driven trend threshold without manual trial and error.
- Swing and trend-following workflows across timeframes and asset classes.
- Quick SMA vs EMA comparisons using risk-adjusted results.
Limitations:
- Not a full trading strategy with position sizing, costs, funding, slippage, or stops.
- Long-only, one position at a time.
- Discrete set of MA lengths, not a continuous optimizer.
- Requires sufficient price history and, if used, a reliable risk-free series.
This script is open-source and built from original logic. It does not replicate closed-source scripts or reuse significant external components.

Apex Edge – Wolfe Wave HunterApex Edge – Wolfe Wave Hunter
The modern Wolfe Wave, rebuilt for the algo era
This isn’t just another Wolfe Wave indicator. Classic Wolfe detection is rigid, outdated, and rarely tradable. Apex Edge – Wolfe Wave Hunter re-engineers the pattern into a modern, SMC-driven model that adapts to today’s liquidity-dominated markets. It’s not about drawing pretty shapes – it’s about extracting precision entries with asymmetric risk-to-reward potential.
🔎 What it does
Automatic Wolfe Wave Detection
Identifies bullish and bearish Wolfe Wave structures using pivot-based logic, symmetry filters, and slope tolerances.
Channel Glow Zones
Highlights the Wolfe channel and projects it forward into the future (bars are user-defined). This allows you to see the full potential of the trade before price even begins its move.
Stop Loss (SL) & Entry Arrow
At the completion of Wave 5, the algo prints a Stop Loss line and a tiny entry arrow (green for bullish, red for bearish). but the colours can be changed in user settings. This is the “execution point” — where the Wolfe setup becomes tradable.
Target Projection Lines
TP1 (EPA): Derived from the traditional 1–4 line projection.
TP2 (1.272 Fib): Optional secondary profit target.
TP3 (1.618 Fib): Optional extended target for large runners.
All TP lines extend into the future, so you can track them as price evolves.
Volume Confirmation (optional)
A relative volume filter ensures Wave 5 is formed with meaningful market participation before a setup is confirmed.
Alerts (ready out of the box)
Custom alerts can be fired whenever a bullish or bearish Wolfe Wave is confirmed. No need to babysit the charts — let the script notify you.
⚙️ Customisation & User Control
Every trader’s market and style is different. That’s why Wolfe Wave Hunter is fully customisable:
Arrow Colours & Size
Works on both light and dark charts. Choose your own bullish/bearish entry arrow colours for maximum visibility.
Tolerance Levels
Adjust symmetry and slope tolerance to refine how strict the channel rules are.
Tighter settings = fewer but cleaner zones.
Looser settings = more frequent setups, but with slightly lower structural quality.
Channel Glow Projection
Define how many bars forward the channel is drawn. This controls how far into the future your Wolfe zones are extended.
Stop Loss Line Length
Keep the SL visible without it extending infinitely across your chart.
Take Profit Line Colors
Each TP projection can be styled to your preference, allowing you to clearly separate TP1, TP2, and TP3.
This isn’t a one-size-fits-all tool. You can shape Wolfe detection logic to match the pairs, timeframes, and market conditions you trade most.
🚀 Why it’s different
Classic Wolfe waves are rare — this script adapts the model into something practical and tradeable in modern markets.
Liquidity-aligned — many setups align with structural sweeps of Wave 3 liquidity before driving into profit.
Entry built-in — most Wolfe scripts only draw the structure. Wolfe Wave Hunter gives you a precise entry point, SL, and projected TPs.
Backtest-friendly — you’ll quickly discover which assets respect Wolfe waves and which don’t, creating your own high-probability Wolfe watchlist.
⚠️ Limitations & Disclaimer
Not all markets respect Wolfe Waves. Some FX pairs, metals, and indices respect the structure beautifully; others do not. Backtest and create your own shortlist.
No guaranteed sweeps. Many entries occur after a liquidity sweep of Wave 3, but not all. The algo is designed to detect Wolfe completion, not enforce textbook liquidity rules.
Probabilistic, not predictive. Wolfe setups don’t win every time. Always use risk management.
High-RR focus. This is not a high-frequency tool. It’s designed for precision, asymmetric setups where risk is small and reward potential is large.
✅ The Bottom Line
Apex Edge – Wolfe Wave Hunter is a modern reimagination of the Wolfe Wave. It blends structural geometry, liquidity dynamics, and algo-driven execution into a single tool that:
Detects the pattern automatically
Provides SL, entry, and TP levels
Offers alerts for hands-off trading
Allows deep customisation for different markets
When it hits, it delivers outstanding risk-to-reward. Backtest, refine your tolerances, and build your watchlist of assets where Wolfe structures consistently pay.
This isn’t just Wolfe detection — it’s Wolfe trading, rebuilt for the modern trader.
Developer Notes - As always with the Apex Edge Brand, user feedback and recommendations will always be respected. Simply drop us a message with your comments and we will endeavour to address your needs in future version updates.

Crypto Perp Calc v1Advanced Perpetual Position Calculator for TradingView
Description
A comprehensive position sizing and risk management tool designed specifically for perpetual futures trading. This indicator eliminates the confusion of calculating leveraged positions by providing real-time position metrics directly on your chart.
Key Features:
Interactive Price Selection: Click directly on chart to set entry, stop loss, and take profit levels
Accurate Lot Size Calculation: Instantly calculates the exact position size needed for your margin and leverage
Multiple Entry Support: DCA into positions with up to 3 entry points with customizable allocation
Multiple Take Profit Levels: Scale out of positions with up to 3 TP targets
Comprehensive Risk Metrics: Shows dollar P&L, account risk percentage, and liquidation price
Visual Risk/Reward: Color-coded boxes and lines display your trade setup clearly
Real-time Info Table: All critical position data in one organized panel
Perfect for traders using perpetual futures who need precise position sizing with leverage.
---------
How to Use
Quick Start (3 Clicks)
1. Add the indicator to your chart
2. Click three times when prompted:
First click: Set your entry price
Second click: Set your stop loss
Third click: Set your take profit
3. Read the TOTAL LOTS value from the info table (highlighted in yellow)
4. Use this lot size in your exchange when placing the trade
Detailed Setup
Step 1: Configure Your Account
Enter your account balance (total USDT in account)
Set your margin amount (how much USDT to risk on this trade)
Choose your leverage (1x to 125x)
Select Long or Short position
Step 2: Set Price Levels
Main levels use interactive clicking (Entry, SL, TP)
For multiple entries or TPs, use the settings panel to manually input prices and percentages
Step 3: Read the Results
The info table shows:
TOTAL LOTS - The position size to enter on your exchange
Margin Used - Your actual capital at risk
Notional - Total position value (margin × leverage)
Max Risk - Dollar amount you'll lose at stop loss
Total Profit - Dollar amount you'll gain at take profit
R:R Ratio - Risk to reward ratio
Account Risk - Percentage of account at risk
Liquidation - Price where position gets liquidated
Step 4: Advanced Features (Optional)
Multiple Entries (DCA):
Enable "Use Multiple Entries"
Set up to 3 entry prices
Allocate percentage for each (must total 100%)
See individual lot sizes for each entry
Multiple Take Profits:
Enable "Use Multiple TPs"
Set up to 3 TP levels
Allocate percentage to close at each level (must total 100%)
View profit at each target
Visual Elements
Blue lines/labels: Entry points
Red lines/labels: Stop loss
Green lines/labels: Take profit targets
Colored boxes: Visual risk (red) and reward (green) zones
Info table: Can be positioned anywhere on screen
Alerts
Set price alerts for:
Entry zones reached
Stop loss approached
Take profit levels hit
Works with TradingView's alert system
Tips for Best Results
Always verify the lot size matches your intended risk
Check the liquidation price stays far from your stop loss
Monitor the account risk percentage (recommended: keep under 2-3%)
Use the warning indicators if risk exceeds margin
For quick trades, use single entry/TP; for complex strategies, use multiple levels
Example Workflow
Find your trade setup using your analysis
Add this indicator and click to set levels
Check risk metrics in the table
Copy the TOTAL LOTS value
Enter this exact position size on your exchange
Set alerts for key levels if desired
This tool bridges the gap between TradingView charting and exchange execution, ensuring your position sizing is always accurate when trading with leverage.
Disclaimer, this was coded with help of AI, double check calculations if they are off.

Optimised GBP/CAD (IC Markets, 30m) - Automated TradingHere’s the Illyad Strategy 1.0 optimised for GBP/CAD on the 30-minute timeframe (IC Markets feed).
📊 Backtest Results (Jan 2024 – Aug 2025):
✅ Total P&L: +28,529.35 CAD (+28.53%)
📉 Max Drawdown: 3.61% (3,822.27 CAD)
🔁 Total Trades: 38
📈 Win Rate: 50.00% (19/38 trades)
⚖️ Profit Factor: 2.49
This setup shows strong performance with low drawdown, making it well-suited for prop firm trading and long-term portfolio compounding.
🔧 Optimisation Notes:
Works best on the 30-minute timeframe.
Each symbol has unique volatility and structure. To maximise results, you must optimise the algo per symbol (e.g., GBP/CAD vs EUR/USD vs NASDAQ).
Parameters such as moving averages, signal intensity, and SL/TP levels should be tuned to the instrument.
💡 Best Use Cases:
Prop firm challenges (FTMO, AquaFunded, MyForexFunds alternatives).
Running across multiple accounts simultaneously for compounding.
Automated execution via TradingView alerts → MT5 integration.
⚠️ Disclaimer:
This script is provided for educational purposes only. Past results do not guarantee future performance. Always backtest and forward-test on demo before live trading.
📲 Next Steps:
This version demonstrates the GBP/CAD optimisation. The Illyad Strategy can be tuned to work on any symbol (forex, indices, or stocks).
👉 Visit my profile for full automation solutions (TradingView → MT5)
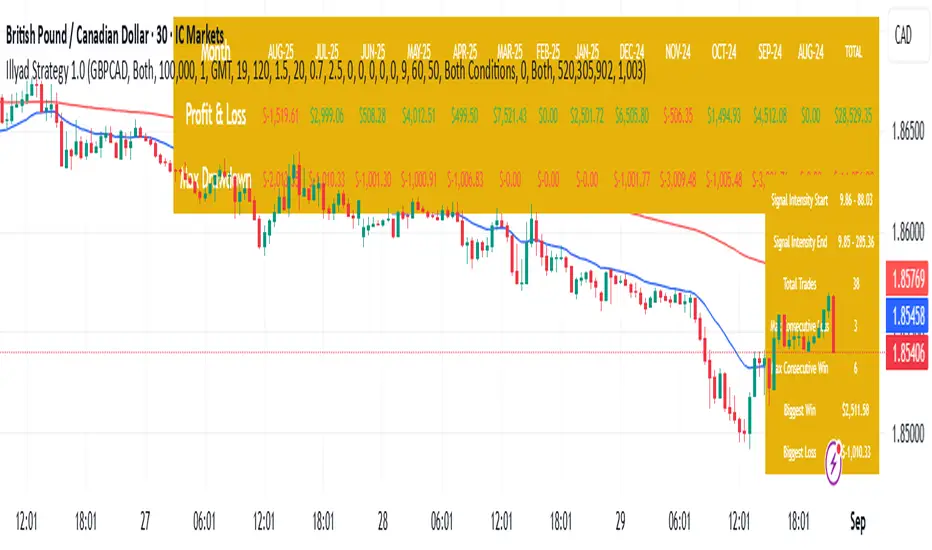
Optimised EURGBP (IC Markets, 30m)Illyad Strategy 1.0 – Optimised EURGBP (IC Markets, 30m)
Description:
This is the Illyad Strategy 1.0 optimised for EURGBP on the 30-minute timeframe (IC Markets feed).
📊 Results (Jan 2024 – Aug 2025):
✅ Total P&L: +£31,032.15 (+31.03%)
📉 Max Drawdown: 2.86% (£3,576.85)
🔁 Total Trades: 39
📈 Win Rate: 58.97%
⚖️ Profit Factor: 2.92
This strategy focuses on controlled drawdown + consistent growth, making it ideal for prop trading challenges and long-term account compounding.
🔧 Optimisation:
Works best on the 30m timeframe.
Each symbol behaves differently — for maximum performance, you should optimise the parameters (MAs, SL/TP, intensity) to the instrument you want to trade.
Example: The EURGBP setup shown here differs from what you’d use on NASDAQ, XAUUSD, or stocks like Tesla.
💡 Best Use Cases:
Passing and scaling prop firm accounts (FTMO, AquaFunded, etc.).
Automated alerts → MT5 integration (hands-free trading).
Consistent, rule-based trading without emotion.
⚠️ Disclaimer:
This script is for educational purposes only. Past results don’t guarantee future performance. Always backtest and forward-test on demo before live trading.
📲 Next Steps:
This version shows the EURGBP optimisation. If you want to run it on other pairs, indices, or stocks → simply optimise parameters for that symbol.
👉 For full automation (TradingView → MT5 execution), check my profile for details.
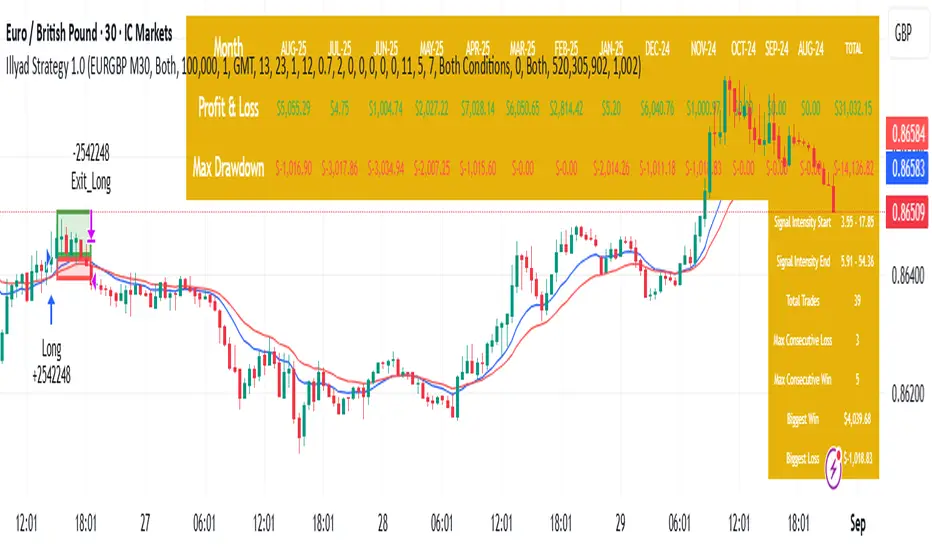
Lot Size & Risk Calculator [FunkyMax]🔹 Overview
This script is a lot size and risk management calculator directly integrated into your chart.
It automatically determines the optimal position size based on your account balance, chosen risk percentage, and stop-loss distance.
In addition to risk calculation, the script also displays Entry, Stop-Loss, and Take-Profit levels on the chart, along with a dashboard panel summarizing all key trading information:
Account balance
Selected risk %
Amount at risk
Optimal lot size
Stop & TP distances in pips
Risk/Reward ratios (R:R)
Potential profit for each TP
Contract size & pip size
🔹 Key Features
✅ Automatic lot size calculation based on:
Account balance
Risk %
Stop-Loss distance
✅ Clear visual display:
Dynamic labels for Entry, Stop, and TP (supports 1 or 2 TPs)
Colored lines (green for TP, red for SL, blue for Entry)
Profit/Loss zones filled on the chart
✅ Dashboard panel:
Compact summary displayed on-screen (position customizable)
Real-time automatic updates
✅ Automatic asset detection:
Forex: contract size = 100,000 (pip = 0.0001 or 0.01 for JPY pairs)
Gold (XAUUSD): contract size = 100 (pip = 0.1)
Indices & crypto: contract size = 1 (pip = 1.0)
Manual override available (custom contract & pip size)
✅ Multi-currency support:
Display in USD or EUR
🔹 How to Use
Add the indicator to your chart then define entry price, stop-loss, Take-Profit targets (TP1 & TP2) by clicking directly on chart. Then, configure settings of the indicator as needed :
1. Basic settings (Money Management tab):
Enter your account balance (e.g., $1000).
Select your risk percentage (e.g., 1%, 2%, 3%).
Choose your deposit currency (USD or EUR).
2. Trading levels (Levels tab):
Set your Entry price.
Define your Stop-Loss (SL).
Add up to two Take-Profit targets (TP1 / TP2).
3. Chart display:
Toggle levels on/off with Display TP & SL on chart.
Levels appear automatically with lot size and R:R ratio.
4. Dashboard (Dashboard tab):
Choose text size (Normal / Small).
Position the info panel anywhere (top/bottom/left/right).
🔹 Benefits
Time-saving: no more manual lot size calculations
Risk control: enforces consistent money management
Versatility: works across Forex, Gold, Indices, Crypto
Clarity: instant visualization of risk and potential reward
🔹 Limitations
Pip value may vary depending on your broker (CFDs, Futures, etc.). Double-check with your platform.
Educational purpose only: this script is not financial advice.
🔹 Author
Script developed and optimized by FunkyMax.

Advanced Swing Trading Suite(Mastersinnifty)🔹 Core Logic
The Advanced Swing Trading Suite is a complete framework for analyzing and trading market swings.
It combines:
A modified QQE momentum engine (adapted from the original QQE by © Peter_O under MPL 2.0).
RSI-based trend strength filter for validation.
Zigzag-driven swing structure detection (higher highs, higher lows, lower highs, lower lows).
Dynamic trade and risk management modules for practical execution.
By merging momentum, structure, and risk control, this tool goes beyond standalone indicators and provides a structured decision-support system for swing traders.
🔹 Uniqueness
While the QQE concept is freely available, this script builds an integrated swing trading ecosystem that adds multiple layers of functionality:
Swing structure analyzer that maps price action into HH, HL, LH, LL patterns in real time.
Dynamic percentage-based trade table that automatically logs entries, exits, P&L %, and timestamps.
Lot size calculator that converts account capital into position size per trade.
Swing extensions and retracement projections for planning targets.
Momentum confirmation via a tuned QQE + RSI engine.
This makes it not just an indicator, but a complete swing trading suite.
🔹 Key Features
✔ Modified QQE + RSI Momentum Filter → Early trend confirmation.
✔ Real-Time Swing Structure Labels (HH, HL, LH, LL) → Clear market context.
✔ Trade Performance Table → Tracks signals with percentage P&L and timing.
✔ Lot Size Calculator → Position sizing based on account capital.
✔ Dynamic Stops & Targets → Swing highs/lows as stops, extensions for projections.
✔ Alerts Ready → Configurable buy/sell alerts.
✔ Visual Labels → Background highlighting and trade markers.
🔹 How to Use
Entries: Green background = Long entry, Red background = Short entry.
Structure: HH/HL/LH/LL labels mark evolving swing structure.
Trade Table: Displays performance stats of past signals.
Risk Control: Use lot size calculator for instant position sizing.
Targets: Refer to swing extensions for profit zones.
Alerts: Set alerts for buy/sell triggers to receive notifications.
🔹 Disclaimer
This script integrates a modified version of QQE by © Peter_O (MPL 2.0 License).
Original QQE source: mozilla.org
All additional modules (swing analyzer, trade table, lot calculator, extensions) are original contributions by Mastersinnifty.
⚠️ Trading Disclaimer:
This script is for educational purposes only and does not constitute financial advice. Past performance is not indicative of future results. Always conduct your own research, test thoroughly, and trade with proper risk management.
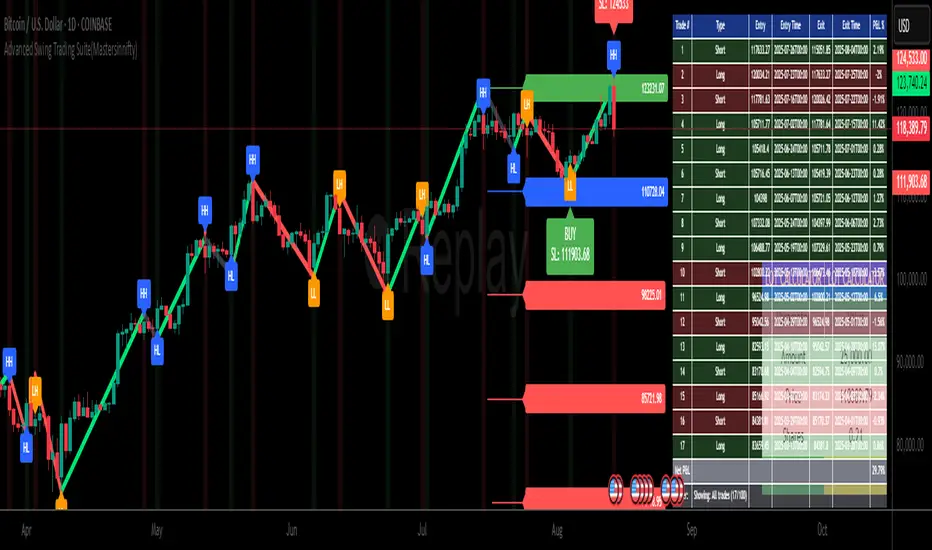
🧠 STWP Options Strategy Dashboard (Strangle)________________________________________
🧠 STWP Options Strategy Dashboard (Long/Short Strangle)
Author: simpletradewithpatience
Markets: NSE (India)
Best timeframe: 1-second chart
Built with: Pine Script v5
________________________________________
📌 Overview
A real-time options strategy dashboard tailored for NSE Strangles:
✅ Long Strangle → Buy OTM CE + Buy OTM PE
✅ Short Strangle → Sell OTM CE + Sell OTM PE
This tool offers a tick-by-tick visual dashboard to monitor:
Live premiums, PnL, breakeven levels, expiry decay, and Greeks.
It is designed **for manual use only** — no trade automation.
Ideal for strategy tracking, education, and decision support.
________________________________________
📌 Key Features
✅ Long & Short Strangle support
✅ Real-time tracking of CE & PE legs (LTPs, PnL, Premium)
✅ Max Loss / Profit calculator
✅ Breakeven range calculator
✅ Risk:Reward verdict (dynamic logic)
✅ Smart Exit logic with trade-specific warnings
✅ Reversal Exit logic based on spot compression
✅ Optional manual Greeks input (Delta, Gamma, Theta, IV)
✅ Greek-based bias: Bullish / Bearish / Neutral
✅ Days to Expiry (DTE) calculator
✅ Clean dashboard UI (emoji-labeled)
✅ Built for Indian NSE Options
✅ Designed to run on **1-second chart only**
________________________________________
📌 Option Symbol Inputs (LTP Tracking)
✅ Call Symbol: OTM CE (above spot)
✅ Put Symbol: OTM PE (below spot)
🎯 Symbol Tips: Use NSE format like `NSE:RELIANCE25JUL3050CE` and `PE`
⚠️ Valid option symbols are critical for accurate PnL tracking
________________________________________
📌 Strategy Parameters
- Call & Put Strike Prices
- Buy/Sell Premiums for both legs
- Lot Size & Number of Lots
- Loss Bearable Amount (₹)
- Expiry Date & Time (used for DTE tracking)
________________________________________
📌 Smart Exit Logic
🧠 A dynamic assistant that checks:
✅ Profit Target Hit
❌ Loss Threshold Breach
⏳ Expiry nearing with no breakout
🟡 Partial Profit Zone
📉 Guides the trader to avoid emotional decisions.
All messages are suggestive only — no trade recommendations.
________________________________________
📌 Reversal Exit Logic (Strangle Specific)
🔁 Detects if spot is trapped between the call/put strikes
➡️ If no breakout from the average strike zone, exit is suggested
⚠️ Helps prevent theta decay trap in Long Strangles
________________________________________
📌 Greeks (Optional Input)
🔹 Manual input for Delta, Gamma, Theta, and IV for both legs
🔍 Dashboard shows:
- Net Delta: Directional Bias
- Net Gamma: Volatility Risk
- Net Theta: Time Decay Risk
- Avg IV: Vol Crush or Low IV Warning
- Verdict: 🟢 Strong / 🟡 Moderate / ❌ Risky
________________________________________
📌 Dashboard Display
📈 Strategy Type: Long or Short Strangle
💹 Call & Put Premiums (Entry vs LTP)
📊 Total Net Premium
📉 Real-time PnL
📐 Breakeven Range (Lower & Upper)
🧠 Smart Exit verdict
🔁 Reversal Exit guidance
📆 Days to Expiry (DTE)
📊 R:R Ratio & Quality Verdict
📐 Greeks Summary + Risk Flags (if enabled)
________________________________________
⚠️ Important Notes
✅ Built for NSE Options only
✅ Designed for Long/Short Strangle strategies
✅ Use on 1-second chart only
❌ Will not function correctly on higher timeframes
✅ This is a manual dashboard — **no orders or automation**
✅ For educational, research, and tracking use only
❌ Not financial advice or a trading recommendation
________________________________________
💬 How to Use This Dashboard
1️⃣ Choose your strategy: Long or Short Strangle
2️⃣ Enter valid CE & PE symbols (OTM strikes)
3️⃣ Fill in strike prices and premiums (Buy/Sell)
4️⃣ Optionally enter Greeks (Delta, Gamma, etc.)
5️⃣ Set your expiry date
6️⃣ Monitor PnL, risk zones, exit suggestions
7️⃣ Use alerts (if enabled) for major thresholds
________________________________________
🤝 Final Note
This tool was built with patience and care by simpletradewithpatience to help fellow options traders trade more objectively, systematically, and confidently.
Feel free to share feedback on Tradingview.
Happy Trading! 📈
Stay disciplined. Stay smart.
________________________________________
🔠 Glossary
PnL – Profit & Loss
LTP – Last Traded Price
IV – Implied Volatility
DTE – Days to Expiry
ROI – Return on Investment
R:R – Risk to Reward Ratio
CE / PE – Call / Put Option
SEBI – Securities and Exchange Board of India
________________________________________
⚠️ Disclaimer
This script is for educational and research purposes only.
I am not a SEBI-registered advisor.
No buy or sell recommendations are made.
Trading options involves significant risk.
Use proper risk management and always consult a licensed advisor if in doubt.
The author is not responsible for any financial losses incurred.
By using this tool, you agree to these terms.
________________________________________
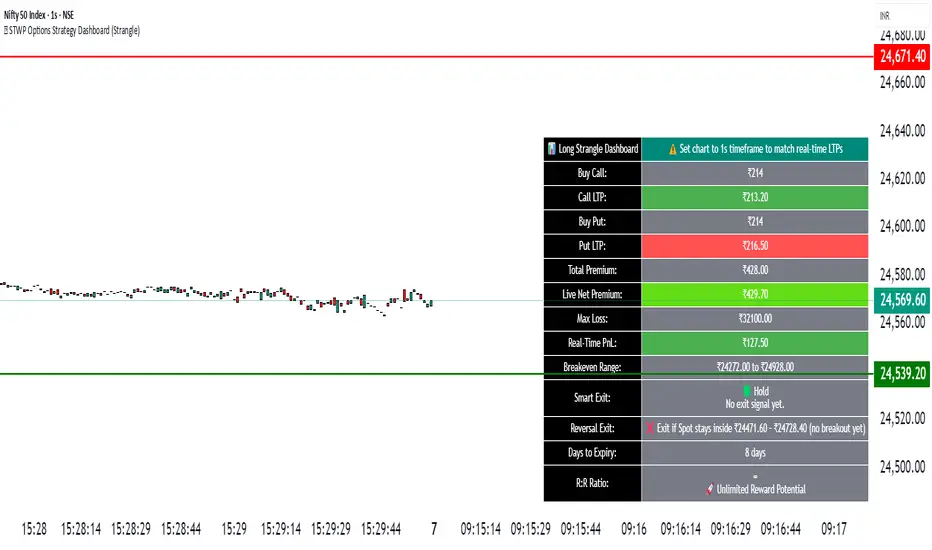
🧠 Options Strategy Dashboard (Straddle)________________________________________
🧠 STWP Options Strategy Dashboard (Long/Short Straddle)
Author: simpletradewithpatience
Markets: NSE (India)
Best timeframe: 1-second chart
Built with: Pine Script v5
________________________________________
📌 Overview
A real-time options strategy dashboard designed for NSE Straddles:
✅ Long Straddle → Buy ATM CE + Buy ATM PE
✅ Short Straddle → Sell ATM CE + Sell ATM PE
This tool provides a visual, tick-by-tick dashboard for monitoring:
Live premiums, real-time PnL, ROI, Greeks, and risk conditions — all in one screen.
It’s fully manual and built for educational & tracking purposes only — not for automation.
________________________________________
📌 Key Features
✅ Track Long & Short Straddles
✅ Live LTP tracking via dual symbol inputs
✅ Real-time PnL, breakeven, max profit/loss
✅ ROI & Risk:Reward calculation
✅ Smart Exit logic with context-based alerts
✅ Invalidation logic via Reversal Range breach
✅ Manual input of Greeks (Delta, Gamma, Theta, IV%)
✅ Greek-based warnings: Gamma Risk, IV Crush, Theta Decay
✅ Days to Expiry (DTE) tracking
✅ Fully customizable alert system
✅ Clean emoji-labelled dashboard UI
✅ Built for Indian NSE Options
✅ Requires 1-second chart for correct functioning
________________________________________
📌 Option Symbol Inputs (LTP Tracking)
✅ Call Symbol: ATM CE (same strike as Put)
✅ Put Symbol: ATM PE (same strike as Call)
✅ Symbol Tips: Use Tradingview dropdown to select NSE option symbols like NSE:RELIANCE25JUL3000CE and PE
⚠️ Providing valid option symbols is essential — all live data relies on them.
________________________________________
📌 Trade Setup Parameters
Spot Price at Entry
Strike Price (same for both legs)
Buy Price (for Long Straddle)
Sell Price (for Short Straddle)
Lot Size & Number of Lots
Loss Bearable Amount (₹) → Used by Smart Exit logic to trigger warnings
________________________________________
📌 Expiry Date Input
Expiry Year, Month, and Day
🎯 Used to calculate Days to Expiry (DTE) and enable:
⏱️ Expiry alerts like “Less than 2 Days”, “Theta Risk”, etc.
📉 Smart Exit logic dynamically adapts based on DTE
________________________________________
📌 Greeks (Optional)
🔹 Default: Leave Greeks empty
🔹 Optional: Input Delta, Gamma, Theta, IV for both Call & Put
🔍 Enables:
Net Delta, Gamma, Theta, IV
Greek-based alerts and visual verdict
🟢 Conservative 🟡 Moderate 🔴 Aggressive Risk
________________________________________
📌 Dashboard Display
📈 Strategy Type: Long or Short Straddle
💹 Entry Premiums & Live Net LTP
📊 Net Premium, Max Profit/Loss
📉 Real-time PnL (tick-level)
📐 Breakeven range
📊 ROI %, Risk:Reward & trade verdict
🚦 Smart Exit verdict: Hold, Exit Soon, or Book Loss
🔁 Reversal Range for invalidation
📆 Days to Expiry (DTE)
📐 Greek Data (if enabled) with Net & Avg values
⚠️ Greek Risk Verdict for managing directional exposure
________________________________________
📌 Alert System (Built-in Alerts)
🎯 Target Profit Hit
❌ Max Loss Reached
🛑 Loss Bearable Limit Breached
📍 Hold Signal
📉 Book Loss / Exit Soon
⏳ Expiry Nearing
⚠️ Reversal Breach (spot breaks outside expected range)
💥 High Gamma Risk (> ±0.05)
📉 High IV Alert (> 35%)
🚨 Combined Master Alert — if any key risk triggers
________________________________________
📌 Smart Exit System
⚙️ A dynamic, context-aware trade assistant
✅ Assesses price movement, expiry risk, and loss thresholds
✅ Provides real-time exit suggestions to prevent overholding
✅ Filters emotional decisions — encourages disciplined trading
________________________________________
📌 Reversal Exit Logic (For Straddles)
🔁 Detects directional invalidation
Reversal Range = ±35% of Total Premium around strike price
⚠️ If spot breaches this range, trade likely invalid — exit advised
📉 Works as directional filter for neutral strategies
________________________________________
⚠️ Important Notes
✅ Built for NSE Options – not suitable for other exchanges
✅ Designed only for Long/Short Straddles
✅ Use on 1-second chart only
❌ Will malfunction on higher timeframes
✅ For manual use only — no automation
✅ For educational and research use only
________________________________________
💬 How to Use This Dashboard
1️⃣ Select Strategy
Long Straddle (Buy Both Legs) or Short Straddle (Sell Both Legs)
2️⃣ Input Symbols
Use accurate NSE symbols for CE & PE
3️⃣ Enter Strike & Premiums
Same strike for both legs. Add Buy or Sell prices
4️⃣ (Optional) Enter Greeks
Add Delta, Gamma, Theta, IV for both legs
5️⃣ Set Expiry
Year, Month, Day — enables DTE alerts
6️⃣ Track Dashboard
Live PnL, Net Premium, ROI, Reversal Range, Smart Exit
7️⃣ Enable Alerts
Get push/email/sound notifications for PnL, expiry, and Greek risks
________________________________________
🤝 Final Note
This tool was built with patience and care by simpletradewithpatience to help fellow options traders trade more objectively, systematically, and confidently.
Feel free to share feedback on Tradingview.
Happy Trading! 📈
Stay disciplined. Stay smart.
________________________________________
🔠 Glossary
PnL – Profit & Loss
LTP – Last Traded Price
IV – Implied Volatility
DTE – Days to Expiry
ROI – Return on Investment
R:R – Risk to Reward Ratio
CE / PE – Call / Put Option
SEBI – Securities and Exchange Board of India
________________________________________
⚠️ Disclaimer
This script is for educational and research purposes only.
I am not a SEBI-registered advisor.
No buy or sell recommendations are made.
Trading options involves significant risk.
Use proper risk management and always consult a licensed advisor if in doubt.
The author is not responsible for any financial losses incurred.
By using this tool, you agree to these terms.
________________________________________
