Momentum ScopeOverview
Momentum Scope is a Pine Script™ v6 study that renders a –1 to +1 momentum heatmap across up to 32 lookback periods in its own pane. Using an Augmented Relative Momentum Index (ARMI) and color shading, it highlights where momentum strengthens, weakens, or stays flat over time—across any asset and timeframe.
Key Features
Full-Spectrum Momentum Map : Computes ARMI for 1–32 lookbacks, indexed from –1 (strong bearish) to +1 (strong bullish).
Flexible Scale Gradation : Choose Linear or Exponential spacing, with adjustable expansion ratio and maximum depth.
Trending Bias Control : Apply a contrast-style curve transform to emphasize trending vs. mean-reverting behavior.
Duotone & Tritone Palettes : Select between two vivid color styles, with user-definable hues for bearish, bullish, and neutral momentum.
Compact, Overlay-Free Display : Renders solely in its own pane—keeping your price chart clean.
Inputs & Customization
Scale Gradation : Linear or Exponential spacing of intervals
Scale Expansion : Ratio governing step-size between successive lookbacks
Scale Maximum : Maximum lookback period (and highest interval)
Trending Bias : Curve-transform bias to tilt the –1 … +1 grid
Color Style : Duotone or Tritone rendering modes
Reducing / Increasing / Neutral Colors : Pick your own hues for bearish, bullish, and flat zones
How to Use
Add to Chart : Apply “Momentum Scope” as a separate indicator.
Adjust Scale : For exponential spacing, switch your indicator Y-axis to Logarithmic .
Set Bias & Colors : Tweak Trending Bias and choose a palette that stands out on your layout.
Interpret the Heatmap :
Red tones = weakening/bearish momentum
Green tones = strengthening/bullish momentum
Neutral hues = indecision or flat momentum
Copyright © 2025 MVPMC. Licensed under MIT. For full license see opensource.org
Rmi

PresentTrend RMI Synergy - Strategy [presentTrading] █ Introduction and How it is Different
The "PresentTrend RMI Synergy Strategy" is the combined power of the Relative Momentum Index (RMI) and a custom presentTrend indicator. This strategy introduces a multifaceted approach, integrating momentum analysis with trend direction to offer traders a more nuanced and responsive trading mechanism.
BTCUSD 6h L/S Performance
Local
█ Strategy, How It Works: Detailed Explanation
The "PresentTrend RMI Synergy Strategy" intricately combines the Relative Momentum Index (RMI) and a custom SuperTrend indicator to create a powerful tool for traders.
🔶 Relative Momentum Index (RMI)
The RMI is a variation of the Relative Strength Index (RSI), but instead of using price closes against itself, it measures the momentum of up and down movements in price relative to previous prices over a given period. The RMI for a period length `N` is calculated as follows:
RMI = 100 - 100/ (1 + U/D)
where:
- `U` is the average upward price change over `N` periods,
- `D` is the average downward price change over `N` periods.
The RMI oscillates between 0 and 100, with higher values indicating stronger upward momentum and lower values suggesting stronger downward momentum.
RMI = 21
RMI = 42
For more information - RMI Trend Sync - Strategy :
🔶 presentTrend Indicator
The presentTrend indicator combines the Average True Range (ATR) with a moving average to determine trend direction and dynamic support or resistance levels. The presentTrend for a period length `M` and a multiplier `F` is defined as:
- Upper Band: MA + (ATR x F)
- Lower Band: MA - (ATR x F)
where:
- `MA` is the moving average of the close price over `M` periods,
- `ATR` is the Average True Range over the same period,
- `F` is the multiplier to adjust the sensitivity.
The trend direction switches when the price crosses the presentTrend bands, signaling potential entry or exit points.
presentTrend length = 3
presentTrend length = 10
For more information - PresentTrend - Strategy :
🔶 Strategy Logic
Entry Conditions:
- Long Entry: Triggered when the RMI exceeds a threshold, say 60, indicating a strong bullish momentum, and when the price is above the presentTrend, confirming an uptrend.
- Short Entry: Occurs when the RMI drops below a threshold, say 40, showing strong bearish momentum, and the price is below the present trend, indicating a downtrend.
Exit Conditions with Dynamic Trailing Stop:
- Long Exit: Initiated when the price crosses below the lower presentTrend band or when the RMI falls back towards a neutral level, suggesting a weakening of the bullish momentum.
- Short Exit: Executed when the price crosses above the upper presentTrend band or when the RMI rises towards a neutral level, indicating a reduction in bearish momentum.
Equations for Dynamic Trailing Stop:
- For Long Positions: The exit price is set at the lower SuperTrend band once the entry condition is met.
- For Short Positions: The exit price is determined by the upper SuperTrend band post-entry.
These dynamic trailing stops adjust as the market moves, providing a method to lock in profits while allowing room for the position to grow.
This strategy's strength lies in its dual analysis approach, leveraging RMI for momentum insights and presentTrend for trend direction and dynamic stops. This combination offers traders a robust framework to navigate various market conditions, aiming to capture trends early and exit positions strategically to maximize gains and minimize losses.
█ Trade Direction
The strategy provides flexibility in trade direction selection, offering "Long," "Short," or "Both" options to cater to different market conditions and trader preferences. This adaptability ensures that traders can align the strategy with their market outlook, risk tolerance, and trading goals.
█ Usage
To utilize the "PresentTrend RMI Synergy Strategy," traders should input their preferred settings in the Pine Script™ and apply the strategy to their charts. Monitoring RMI for momentum shifts and adjusting positions based on SuperTrend signals can optimize entry and exit points, enhancing potential returns while managing risk.
█ Default Settings
1. RMI Length: 21
The 21-period RMI length strikes a balance between capturing momentum and filtering out market noise, offering a medium-term outlook on market trends.
2. Super Trend Length: 7
A SuperTrend length of 7 periods is chosen for its responsiveness to price movements, providing a dynamic framework for trend identification without excessive sensitivity.
3. Super Trend Multiplier: 4.0
The multiplier of 4.0 for the SuperTrend indicator widens the trend bands, focusing on significant market moves and reducing the impact of minor fluctuations.
---
The "PresentTrend RMI Synergy Strategy" represents a significant step forward in trading strategy development, blending momentum and trend analysis in a unique way. By providing a detailed framework for understanding market dynamics, this strategy empowers traders to make more informed decisions.

RMI Trend Sync - Strategy [presentTrading]█ Introduction and How It Is Different
The "RMI Trend Sync - Strategy " combines the strength of the Relative Momentum Index (RMI) with the dynamic nature of the Supertrend indicator. This strategy diverges from traditional methodologies by incorporating a dual analytical framework, leveraging both momentum and trend indicators to offer a more holistic market perspective. The integration of the RMI provides an enhanced understanding of market momentum, while the Super Trend indicator offers clear insights into the end of market trends, making this strategy particularly effective in diverse market conditions.
BTC 4h long/short performance
█ Strategy: How It Works - Detailed Explanation
- Understanding the Relative Momentum Index (RMI)
The Relative Momentum Index (RMI) is an adaptation of the traditional Relative Strength Index (RSI), designed to measure the momentum of price movements over a specified period. While RSI focuses on the speed and change of price movements, RMI incorporates the direction and magnitude of those movements, offering a more nuanced view of market momentum.
- Principle of RMI
Calculation Method: RMI is calculated by first determining the average gain and average loss over a given period (Length). It differs from RSI in that it uses the price change (close-to-close) rather than absolute gains or losses. The average gain is divided by the average loss, and this ratio is then normalized to fit within a 0-100 scale.
- Momentum Analysis in the Strategy
Thresholds for Decision Making: The strategy uses predetermined thresholds (pmom for positive momentum and nmom for negative momentum) to trigger trading decisions. When RMI crosses above the positive threshold and other conditions align (e.g., a bullish trend), it signals a potential long entry. Similarly, crossing below the negative threshold in a bearish trend may trigger a short entry.
- Super Trend and Trend Analysis
The Super Trend indicator is calculated based on a higher time frame, providing a broader view of the market trend. This indicator uses the Average True Range (ATR) to adapt to market volatility, making it an effective tool for identifying trend reversals.
The strategy employs a Volume Weighted Moving Average (VWMA) alongside the Super Trend, enhancing its capability to identify significant trend shifts.
ETH 4hr long/short performance
█ Trade Direction
The strategy offers flexibility in selecting the trading direction: long, short, or both. This versatility allows traders to adapt to their market outlook and risk tolerance, whether looking to capitalize on bullish trends, bearish trends, or a combination of both.
█ Usage
To effectively use the "RMI Trend Sync" strategy, traders should first set their preferred trading direction and adjust the RMI and Super Trend parameters according to their risk appetite and trading goals.
The strategy is designed to adapt to various market conditions, making it suitable for different asset classes and time frames.
█ Default Settings
RMI Settings: Length: 21, Positive Momentum Threshold: 70, Negative Momentum Threshold: 30
Super Trend Settings: Length: 10, Higher Time Frame: 480 minutes, Super Trend Factor: 3.5, MA Source: WMA
Visual Settings: Display Range MA: True, Bullish Color: #00bcd4, Bearish Color: #ff5252
Additional Settings: Band Length: 30, RWMA Length: 20

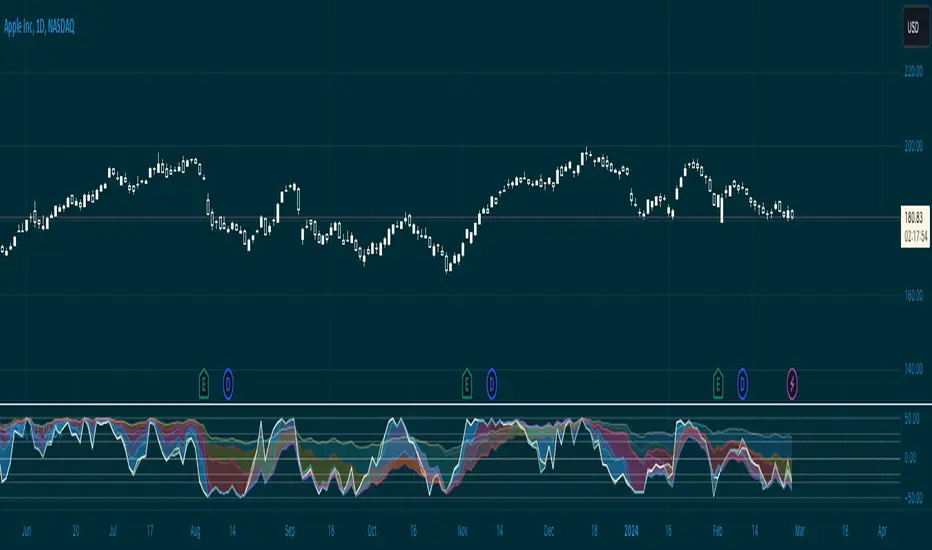
ARSIXARSIX
I have written this indicator after two years of continuous experience in writing and backtesting for several different indicators, and I believe that this indicator with its high capabilities can show you the best point of entry into the market as well as exit from it. arsix should work with any time frame and any instrument used.
This indicator has many points to understand so that you can make the best possible use of it, in the following I will try to bring you some of the most important points:
First, we will have an introduction of the different parts of the indicator:
The above line is a relatively simple but very useful formula to determine the momentum of chart. To understand the exact formula, you can refer to the source of the program itself, and its two colors are used to determine the direction of movement.
At the bottom, we have three opposing elements.
The first is the RSI14 line with dark blue color, the second is the RMA or Relative Momentum Index(RMI20) line with the number 20 for Momentum , which will significantly help us understand the overall momentum of the chart, this part is also made in two colors to increase or It will show the decline of the overall momentum of the chart.
And finally, we have a bar chart that is again created in two colors, and this histogram also calculates the momentum chart with a different formula.
And now let's talk about how to interpret these tools and how to use them for Trading:
At first, you may have the question that all these different indicators are not excessive to determine the momentum chart and are all of them necessary? In response, I must say that yes, each of these parts has been selected and made with great care and with my previous experience, the full explanation of each of these parts is beyond the scope of this article, and I will try to explain it in short words. I will give you a general understanding of each one of them and the rest is up to you to find out their capabilities by working more with these tools.
The main thing is to know that none of these tools alone will bring you success and it is their teamwork together that will help you achieve success.
For the sake of simplicity, I will tell you when to open a buy position with this indicator And you can then use this definition of the main thread to interpret the rest of the capabilities of this indicator.
To open a buy position, first the upper indicator should turn light blue, at the same time, the RMI indicator should also turn light blue, and you should also see that this RMI indicator shows the momentum of the overall chart in order to increase. in this case you will be almost sure that the general trend of the chart is towards the rise of the price. In the next step, to determine the exact point of the Entry, you have to wait until the RSI indicator passes the number 50 in this state and at the same time, make sure that the histogram also turns green and shows the increasing direction of momentum in the market, when the RSI is in This state crossed the number 50, you can enter the buy position, it should be noted that due to a series of restrictions, I have moved the RSI indicator down by 50 numbers, so as a result, the number 50 for RSI here is equivalent to The same number zero.
This was an example of how to work with this indicator, I hope that it helped you to understand how to use this indicator. In the end, I would like to point out again that the main topic is understanding the group and mutual behavior of each of the indicators' tools together. For example, if the RSI indicator crosses the number 50 here, but the histogram does not grow or shows a small growth, this indicates that the movement will be low, or for another example, if the RSI indicator cross over From the RMI indicator, This means that the market is very high, and as a result, it is a great opportunity to hold a buy position. In the same way, other parts of this indicator can also be interpreted in opposition to each other.
I hope this indicator will help you in better trades. I look forward to your constructive comments. Thanks Hamid Moradi.

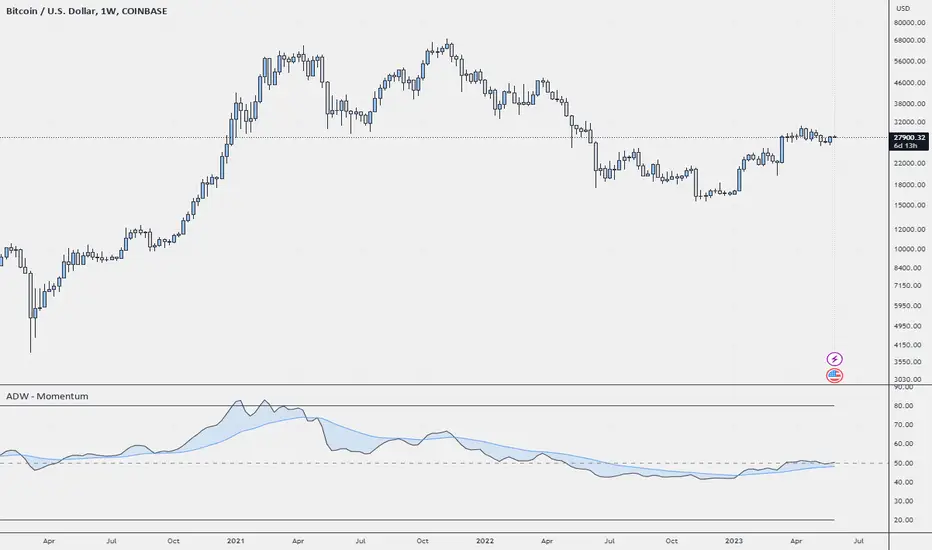
ADW - MomentumADW - Momentum is a trading indicator based on the Relative Momentum Index (RMI) and Exponential Moving Averages (EMAs). This indicator plots the RMI along with its EMAs and highlights regions where RMI crosses its slow EMA. Additionally, it provides alerts when the momentum flips bullish or bearish.
Key Features:
The RMI helps to identify momentum in the market.
Three EMAs (Fast, Standard, and Slow) were calculated on the RMI. These can be utilized to analyze the momentum trend over different periods.
Highlighted regions and colour coding to indicate when RMI crosses its Slow EMA, signalling potential momentum shifts.
Customizable parameters: Users can specify the lengths of the RMI and EMAs, boundaries for RMI, and colours for various components of the plot.
Alerts: The script can alert users when the momentum has flipped bullish or bearish.
The script is organized into several sections:
Inputs: The user can customize several parameters including the RMI averaging length, momentum lookback, RMI boundaries, and the EMA lengths. In addition, users can also specify the colours for the RMI line, Slow EMA line, and the fill colour.
RMI Calculation: The script calculates the RMI based on the user-provided length and momentum lookback. This is done by first calculating two EMAs - one for the positive differences between closing prices (emaInc), and one for the negative differences (emaDec). Then, the RMI is computed using these EMAs.
Plotting: The script plots the RMI line, Slow EMA line, and two horizontal lines indicating the RMI boundaries. In addition, it also fills the region between the RMI and Slow EMA lines.
Conditions: The script computes the conditions for bullish and bearish momentum flips. These are defined as when the RMI crosses above or below the Slow EMA respectively.
Alerts: Finally, the script sets up two alert conditions based on the bullish and bearish conditions. These alert the user when the momentum has flipped bullish or bearish, with a message that includes the current RMI value.
RMI TFM:Chart + 3D + 1W + 1M This indicator defaults to;
Period: 20
Look Back For Momentum :5
OverBought: 80
OverSold :20
of a Relative Momentum Index indicator;
1- RMI value according to the candle duration selected in the chart, (black)
2- RMI value according to pure 3D candles with the security() function, (blue)
3- With the security() function, the RMI value according to pure 1W candles, (orange)
4- With the security() function, the RMI value (Gray) according to 1M candles shows.
It also calculates RMI according to the price value you enter manually and shows or hides it according to your preference.

Williams %R & RSI with Multiple PeriodsDESCRIPTION
1. Calculates %R and RSI with multiple period lengths.
1 period length value is defined by User.
8 period length values follow User's selection of classic number sequences, e.g. Fibonacci, Leonardo, Lucas, Narayana, etc.
2. User selects which indicator and periods to display or hide.
DEFAULTS
%R default custom period: 10.
RSI default custom period: 14.
%R & RSI default number sequence periods: Lucas numbers 11, 18, 29, 47, 76, 123, 199, 322.
CALCULATIONS
%R = (period high - most recent period's close price)/(period high - period low)
RSI = 100 - 1 / (100 + RS), where RS = SMMA(up, period) / SMMA(down, period)
PURPOSE
1. Identify price trends.
CREDITS
1. Williams %R technical analysis momentum oscillator by Larry Williams.
2. Wilder's Relative Strength Index technical analysis momentum oscillator by J. Welles Wilder.
3. "Solarized" color scheme by Ethan Schoonover.
Combo Backtest 123 Reversal & Relative Momentum Index This is combo strategies for get a cumulative signal.
First strategy
This System was created from the Book "How I Tripled My Money In The
Futures Market" by Ulf Jensen, Page 183. This is reverse type of strategies.
The strategy buys at market, if close price is higher than the previous close
during 2 days and the meaning of 9-days Stochastic Slow Oscillator is lower than 50.
The strategy sells at market, if close price is lower than the previous close price
during 2 days and the meaning of 9-days Stochastic Fast Oscillator is higher than 50.
Second strategy
The Relative Momentum Index (RMI) was developed by Roger Altman. Impressed
with the Relative Strength Index's sensitivity to the number of look-back
periods, yet frustrated with it's inconsistent oscillation between defined
overbought and oversold levels, Mr. Altman added a momentum component to the RSI.
As mentioned, the RMI is a variation of the RSI indicator. Instead of counting
up and down days from close to close as the RSI does, the RMI counts up and down
days from the close relative to the close x-days ago where x is not necessarily
1 as required by the RSI). So as the name of the indicator reflects, "momentum" is
substituted for "strength".
WARNING:
- For purpose educate only
- This script to change bars colors.

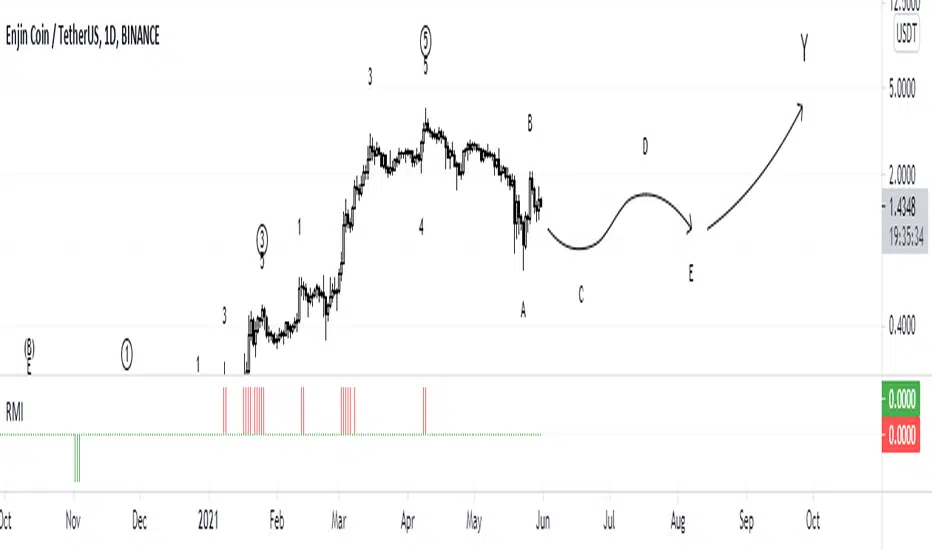
RMIRMI is a combination of RSI and MFI oscillators which considers money flow and strength of supply or demand together.
It estimates that the money of which side is being ran out.
So the power of trends can be predictable approximately.
Where the green columns appear, it means demand is very high and it can fall because buyers may withdraw and sell their assets.
And when red columns appear, it means supply is very high and sellers or new buyers may enter into new deals which may increase the price of a asset.
I would be glad if I hear your feedbacks.
Super Momentum StrategyThis is a strategy utilizing multiple of Evergets RMI (thanks to him for permission to publish) and a Chance Momentum.
It buys when 4 of the RMIs are below their thresholds and sells when they are above. There is a 5th one I added last night that works in Reverse - buy when its above and sell when below, which should work better for pyramiding strats by using it at the right rate to set the overall trend.
Very basic sample below, I could have set it up better as my example but just want to publish.

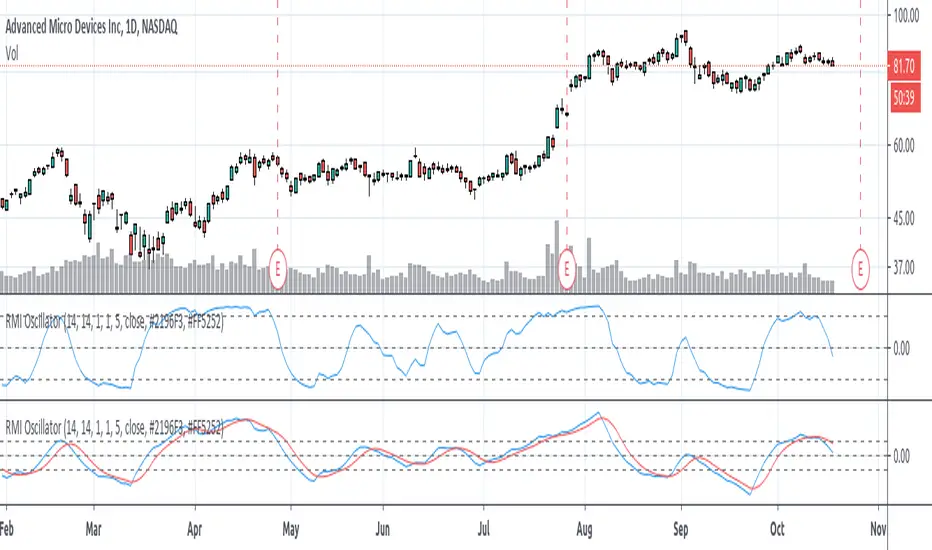
Relative Momentum Index (RMI) OscillatorThe Relative Momentum Index (RMI) is a sibling to the RSI. Where the RSI measures trend based on the average (RMA) of gains and draws over a length of time , the RMI measures based on the SUM of gains and draws . Myself and many others have found that the RMI oscillates better than the RSI does.
I paired the RMI with the oscillation method the Fisher Transformation uses to oscillate the value from -1.0 to 1.0 instead of the Stochastic way of 0 to 100. This way you can enable the Fisher transform, if desired. But I also just prefer the appearance of that.
Some options and features I have coded in-
RMI Length: This is the length of the Relative Momentum Index itself. Like the length of RSI, default 14
Oscillation Length: This is your oscillation length, like a Stochastic. If you put the length at 1 it will turn the indicator into the straight up RMI indicator. (If you select to use the Fisher Transform, the overbought/oversold lines will not show nicely)
Source Pre-Smoothing: The option of smoothing out the source, ie close, before you even run it through the RMI, oscillation, and/or transform
Oscillator Post-Smoothing: The option of smoothing the output of the script
Trailing MA: If desired, you can check the box to Use a Trailing Signal, and enter the length of lookback for a Simple Moving Average (SMA) of the RMI Osc value
Use Fill Colors on MA: If enabled, it will fill the area between the RMI Osc and the trailing MA. I chose to use colors that are similar to some educational ideas I have published, whereby nearing the bottom of the oscillation you get Green to signal Accumulation, and near the top you get Red to signal Distribution. Following red is Black, where you typically get late signal sellers that Capitulate and sell stops trigger. Blue is where traders tend to Chase price up.
The most primitive way of using this indicator would be sell when the value exceeds the overbought/top line and buy when it falls below the oversold/bottom line. You can find ways to use the fill colors, or MA crossovers, rising lows or rising highs, etc. for signals.
Here's a comparison of this indicator to the Stochastic RSI, using similar values-
Here's showing the indicator on intraday values at defaults with some pre- and post-smoothing-
Same thing, but with Fisher Transform enabled-
And an example of the fill bands in action-
Please feel free to use any part of this code as desired.
TS - Momentum OscillatorWhat is it?
RMI & EMA based momentum oscillator to act as a supporting indicator to the rest of the Tradespot indicator suite. Combined trading is made intuitive and accessible to traders of all levels.
Momentum can help you confirm an existing trade, whether to hold position and avoid fakeouts. or it may let you know when the market is losing steam for example and could be a good point to take profit.
Access
This is one of the indicators in our greater trading suite that we offer. Just PM me for access!

🐮 🆚 🐻 [Alerts]It's a remake of the previous script but for use in reverse positions at the same time.
In this script the reality could be even better than the Backtest, because, only close the position with profit, so profitability should be 100%, and Longs and Shorts don't mix because they are independent.
In real trade, you need an exchange that allows you to go in reverse positions at the same time or where you can have two independent sub-accounts: one for long and one for short and with margin trading. Although, if TP is small and does not mix with other inverse positions, it's not necessary. (With this script, you can go long and short at the same time and with independent configurations)
Settings for ETH at 5 minutes. (If you find good settings please comment)
Enjoy!

🐮 🆚 🐻 [Backtest]It's a remake of the previous script but for use in reverse positions at the same time.
In this script the reality could be even better than the Backtest, because, only close the position with profit, so profitability should be 100%, and Longs and Shorts don't mix because they are independent.
In real trade, you need an exchange that allows you to go in reverse positions at the same time or where you can have two independent sub-accounts: one for long and one for short and with margin trading. Although, if TP is small and does not mix with other inverse positions, it's not necessary. (With this script, you can go long and short at the same time and with independent configurations)
Settings for ETH at 5 minutes. (If you find good settings please comment)
Enjoy!

NOT-ONLY-SHORTThis script is the same as NOT-ONLY-LONG but without the security() function.
It use the following indicators: RMI + ADX + RSI + ICHIMOKU cloud only.
The fuchsia dot is the average price of the positions. The Take Profit is calculated from there.
It does not have Stop Loss, instead it makes a re-entry to try to improve the liquidation price.
Enjoy!

NOT-ONLY LONG V4 [Alerts]This Script is the second part of the previous one. In this second part it includes Longs and also Shorts. It is a little conservative, and is mainly used for swing trading. It can be used for everyday trading or if you’re using it for automated trading, you don’t necessarily need to run it as a bot. But you can do so if you want. To set it up without running it as a bot. Create the alerts that will send notifications to your mobile, and then when you receive an alert, you can place the order manually yourself. Maybe it could be a bit boring. But as someone said: "The Exchange is designed to transfer the money of the impatient to the patients." -Warren Buffett.
This script uses RMI + ADX + RSI, and for the main trend the famous Ichimoku, here I thought wasn’t good for anything, but look at how well it works with ETH.
I had to put the security () function only for Ichimoku. It can be used in this way without causing problems with repainting, but you have to know what measures to take to ensure it does not overlap, or so that the backtest is accurate.
indexHighTF = barstate.isrealtime ? 1 : 0
indexCurrTF = barstate.isrealtime ? 0 : 1
a0 = security(syminfo.tickerid, 'D', close , lookahead=barmerge.lookahead_off)
a = a0
The preventive measures can be found in the link below:
www.tradingview.com
This script is like the world upside down. When the price goes up and you see an opportunity, you start creating shorts and the same thing can be done by creating longs when the price goes down. It can be very effective because remember what Warren Buffett said again: "The dumbest reason in the world to buy an action is that it is going up."
It leave the position only when Taking Profits.
It does not have Stop Loss, instead, when it reaches a set % loss, it makes a re-entry by laddering the trades.
I think that the Stops Loss only serves to get you liquidate. With the erratic price movements on the Exchanges, their movements can be between 5-20%, fucking you if you have a SL !! (conspiracy theories) ;-)
This world is invented for you to lose money, it is not easy to get rich and less likely with a script, but neither is it impossible, who knows, maybe this will help or at least give extra tool in your trading.
It's more or less adjusted for my favorite crypto currency: ETH on BITMEX and I'm sure there's a much better setting.
The best Timeframe that seems to be working well: ETH: 1 H
Greetings from Barcelona…
Thanks...
BTC: 3LEUP3WjQctdbFjBavcmRGUVRBje8bptCd
BCH: qrv6j7mpxjzzs9dudfag3glu278suchdhg7c44pa37
ETH: 0x518AAD4746912ae506c82B747488306186c4d546
ETC: 0xa2498D7AcB9303aa10F14ff27C54AAc4cE5d5705
ZRX: 0x29aC9BaC10818C30055b25A8E90dd11488Ae6df8
BAT: 0x115f3F9D1c3fC248e73644a72d77A062D3CB28Ba

NOT-ONLY-LONG V4 [Backtest]Este Script es la segunda parte del anterior. Es para Longs y también para Shorts, es un poco conservador, y es para un trading tipo swing trading y se puede utilizar en modo manual también. No necesitas conectarlo a un bot para trading automático, o sí, como quieras. Pero, solo con crear las alertas que te avisen al móvil, tú mismo podrás poner la orden. Quizá es un poco aburrido. Pero alguien dijo: “La Bolsa está diseñada para transferir el dinero de los impacientes a los pacientes”. -Warren Buffett.
Utiliza RMI+ADX+RSI, y para la tendencia principal el famoso Ichimoku que yo mismo pensaba que no servía para nada, pero míralo que bien funciona con ETH.
Le he tenido que poner la función security() solo para Ichimoku. Se puede utilizar, pero hay que saber tomar algunas medidas para que no repinte o para que el backtest sea real, como por ejemplo:
indexHighTF = barstate.isrealtime ? 1 : 0
indexCurrTF = barstate.isrealtime ? 0 : 1
a0 = security(tickerid, 'D', close , lookahead=barmerge.lookahead_off)
a = a0
www.tradingview.com
Este script es como el mundo al revés, cuando sube el precio y ve la oportunidad empieza a crear shorts y lo mismo creando longs cuando baja el precio. Puede ser muy efectivo ya que recordando a Warren Buffett otra vez: “La razón más tonta del mundo para comprar una acción es que esté subiendo.”
Sale de la posición solo con Take Profit.
No tiene Stop Loss, en su lugar, cuando llega a un % de pérdida establecida, hace una re-entrada.
Pienso que los Stops Loss solo sirven para que te liquiden la posición los propios Exchanges con sus movimientos de 5-20% a la contra así que fuera el puto SL!! 😉.
Este mundo está inventado para que pierdas dinero, no es fácil hacerse rico y menos con un script, pero tampoco es imposible, quien sabe, a lo mejor sí o por lo menos un extra.
Está más o menos ajustado para mi cripto favorita: ETH en BITMEX y seguro que hay un ajuste mucho mejor.
Timeframes que parece que va bien: ETH 1 H
Tenía ganas de desahogarme aquí un poco en mi idioma, el inglés lo tengo un poco verde. 😊
Saludos desde Barcelona…
Gracias...
BTC: 3LEUP3WjQctdbFjBavcmRGUVRBje8bptCd
BCH: qrv6j7mpxjzzs9dudfag3glu278suchdhg7c44pa37
ETH: 0x518AAD4746912ae506c82B747488306186c4d546
ETC: 0xa2498D7AcB9303aa10F14ff27C54AAc4cE5d5705
ZRX: 0x29aC9BaC10818C30055b25A8E90dd11488Ae6df8
BAT: 0x115f3F9D1c3fC248e73644a72d77A062D3CB28Ba

ONLY LONG V4 [Alerts]Let's try the Version 4 ...
This script is only for long positions.
It's based on the conjunction of RMI + ADX + RSI for entries and only with Take Profit to close the position.
It doesn't have security (), nor Heikin Ashi, so the Backtest is Real.
Use always 'Once per bar'.
It doesn't repaint absolutely nothing at all.
Timeframe: 15 minutes
Have fun improving it ...
Enjoy!
Tips ...
BTC: 3LEUP3WjQctdbFjBavcmRGUVRBje8bptCd
ETH: 0x518AAD4746912ae506c82B747488306186c4d546

[ALERTS] CMYK-RMI-SMA
▼ This is the study version of the script, For usage with Autoview
◊ Introduction
This script makes use of three RMI's and SMA's, that indicate Overbought/Oversold on different Periods that correspond with Frequency’s that move the market.
◊ Origin
This is an update on █▓▒░ CMYK ♦ RMI ♦ TRIPLE ░▒▓█
◊ Usage
This script is intended for Automated Trading on the 1-5 minute chart.
◊ Features Summary
Two Part Indicator
Strategy Type Selection
Three RMI's SMA's
Trend adjustment
Pump/Dump Entry Delay
Pyramiding
Ignore first entries
Take Profit
Interval between Entries
Multiring Fix
Alert signal Seperation
◊ Community
Wanna try this script out ? need help resolving a problem ?
CMYK :: discord.gg
AUTOVIEW :: discordapp.com
TRADINGVIEW UNOFFICIAL :: discord.gg
◊ Setting up Autoview Alerts
Use the study version of this script, To set up The Alerts Autoview Picks up on.
Goto the CMYK Discord for support and Settings.
◊ Backtesting
Use the strategy version of this script for backtesting.
◊ Contact
Wanna try this script out ? need help resolving a problem ?
CMYK :: discord.gg
HAPPY TRADES!!!

[BACKTEST] CMYK-RMI-SMA◊ Introduction
This script makes use of three RMI's and SMA's, that indicate Overbought/Oversold on different Periods that correspond with Frequency’s that move the market.
◊ Origin
This is an update on █▓▒░ CMYK ♦ RMI ♦ TRIPLE ░▒▓█
◊ Usage
This script is intended for Automated Trading on the 1-5 minute chart.
◊ Features Summary
Two Part Indicator
Strategy Type Selection
Three RMI's SMA's
Trend adjustment
Pump/Dump Entry Delay
Pyramiding
Ignore first entries
Take Profit
Interval between Entries
Multiring Fix
Alert signal Seperation
◊ Community
Wanna try this script out ? need help resolving a problem ?
CMYK :: discord.gg
AUTOVIEW :: discordapp.com
TRADINGVIEW UNOFFICIAL :: discord.gg
◊ Setting up Autoview Alerts
Use the study version of this script, To set up The Alerts Autoview Picks up on.
Goto the CMYK Discord for support and Settings.
◊ Backtesting
Use the strategy version of this script for backtesting.
◊ Contact
Wanna try this script out ? need help resolving a problem ?
CMYK :: discord.gg
Happy trades!!!

[ALERTS] CMYK-RMI-TRIPLE IIThis is the same previous script but without the Deribit index (for BITMEX users for example) that can give problems due to no connection with any of the 6 exchanges. Now use 'close' as source.
BTCUSD, XBTUSD, ...
Best time frame: 5 minutes
Alerts: 'once per bar'

[BACKTEST] CMYK-RMI-TRIPLE IIThis is the same previous script but without the calculation of the Deribit index (for BITMEX users for example) that can give problems due to no connection with any of the 6 exchanges. Now use 'close' as source.
Settings for BTCUSD or XBTUSD
Best time frame: 5 minutes

[BACKTEST] CMYK-RMI-TRIPLEScript based on 3 RMI and the opening of long / short 'pyramiding' positions.
XBT:USD on BITMEX or BTC:USD on DERIBIT
Includes the calculation of the DERIBIT Index but can be used for any Crypto, the always overloaded BITMEX or even Forex, ...
Best timeframe: 5 minutes. A 5-minutes chart extended to the minimum is equal to a 1H chart.
¡NO REPAINT! : Alerts 'Once per bar'
It has take profit and it's so good that it doesn`t need Stop Loss
Original idea by MVPMC.
