BK AK-Scope🔭 Introducing BK AK-Scope — Target Locked. Signal Acquired. 🔭
After building five precision weapons for traders, I’m proud to unveil the sixth.
BK AK-Scope — the eye of the arsenal.
This is not just an indicator. It’s an intelligence system for volatility, signal clarity, and rate-of-change dynamics — forged for elite vision in any market terrain.
🧠 Why “Scope”? And Why “AK”?
Every shooter knows: you can’t hit what you can’t see.
The Scope brings range, clarity, and target distinction. It filters motion from noise. Purpose from panic.
“AK” continues to honor the man who trained my sight — my mentor, A.K.
His discipline taught me to wait for alignment. To move with reason, not emotion.
His vision lives in every code line here.
🔬 What Is BK AK-Scope?
A Triple-Tier TSI Correlation Engine, fused with adaptive opacity logic, a volatility scoring system, and real-time signal clarity. It’s momentum dissected — by speed, depth, and rate of change.
Built to serve traders who:
Need visual hierarchy between fast, mid, and slow TSI responses.
Want adaptive fills that pulse with volatility — not static zones.
Require a volatility scoring overlay that reads the battlefield in real time.
⚙️ Core Systems: How BK AK-Scope Works
✅ Fast/Mid/Slow TSI →
Three layers of correlation: like scopes with zoom levels.
You track micro moves, mid swings, and macro flow simultaneously.
✅ Rate-of-Change Adaptive Opacity →
Momentum fills fade or flash based on speed — giving you movement density at a glance.
Bull vs. Bear zones adapt to strength. You feel the market’s pulse.
✅ Volatility Score Intelligence →
Custom algorithm measuring:
Range expansion
Rate-of-change differentials
ATR dynamics
Standard deviation pressure
All combined into a score from 0–100 with live icons:
🔥 = Extreme Heat (70+)
🧊 = Cold Zone (<30)
⚠️ = ROC Warning
• = Neutral drift
✅ Auto-Detect Volatility Modes →
Scalp = <15min
Swing = intraday/hourly
Macro = daily/weekly
Or override manually with total control.
🎯 How To Use BK AK-Scope
🔹 Trend Continuation → When all three TSI layers align in direction + volatility score climbs, ride with the trend.
🔹 Early Reversals → Opposing TSI + rapid opacity change + volatility shift = sniper reversal zone.
🔹 Consolidation Filter → Neutral fills + score < 30 = stay out, wait for signal surge.
🔹 Signal Confluence → Pair with:
• Gann fans or angles
• Fib time/price clusters
• Elliott Wave structure
• Harmonics or divergence
To isolate entry perfection.
🛡️ Why This Indicator Changes the Game
It's not just momentum. It’s TSI with depth hierarchy.
It’s not just color. It’s real-time strength visualization.
It’s not just volatility. It’s rate-weighted market intelligence.
This is market optics for the advanced trader — built for vision, clarity, and discipline.
🙏 Final Thoughts
🔹 In honor of A.K., my mentor. The man who taught me to see what others miss.
🔹 Inspired by the power of vision — because execution without clarity is chaos.
🔹 Powered by faith — because Gd alone gives sight beyond the visible.
“He gives sight to the blind and wisdom to the humble.” — Psalms 146
Every tool I build is a prayer in code — that it helps someone trade with clarity, integrity, and precision.
⚡ Zoom In. Focus Deep. Trade Clean.
BK AK-Scope — Lock on the target. See what others don’t.
🔫 Clarity is power. 🔫
Gd bless. 🙏
ROC
New Momentum H/LNew Momentum H/L shows when momentum, defined as the rate of price change over time, exceeds the highest or lowest values observed over a user-defined period. These events shows points where momentum reaches new extremes relative to that period, and the indicator plots a column to mark each occurrence.
Increase in momentum could indicate the start of a trend phase from a low volatile or balanced state. However in developed trends, extreme momentum could also mark potential climaxes which can lead to trend termination. This reflects the dual nature of the component.
This indicator is based on the MACD calculated as the difference between a 3-period and a 10-period simple moving average. New highs are indicated when this value exceeds all previous values within the lookback window; new lows when it drops below all previous values. The default lookback period is set to 40 bars, which corresponds with two months on a daily chart.
The indicator also computes a z-score of the MACD line over the past 100 bars. This standardization helps compare momentum across different periods and normalizes the values of current moves relative to recent history.
In practice, use the indicator to confirm presence of momentum at the start of a move from a balanced state (often following a volatility expansion), track how momentum develops inside of a trend structure and locate potential climactic events.
Momentum should in preference be interpreted from price movement. However, to measure and standardize provides structure and helps build more consistent models. This should be used in context of price structure and broader market conditions; as all other tools.

Rate of Change HistogramExplanation of Modifications
Converting ROC to Histogram:
Original ROC: The ROC is calculated as roc = 100 * (source - source ) / source , plotted as a line oscillating around zero.
Modification: Instead of plotting roc as a line, it’s now plotted as a histogram using style=plot.style_columns. This makes the ROC values visually resemble the MACD histogram, with bars extending above or below the zero line based on momentum.
Applying MACD’s Four-Color Scheme:
Logic: The histogram’s color is determined by:
Above Zero (roc >= 0): Bright green (#26A69A) if ROC is rising (roc > roc ), light green (#B2DFDB) if falling (roc < roc ).
Below Zero (roc < 0): Bright red (#FF5252) if ROC is falling (roc < roc ), light red (#FFCDD2) if rising (roc > roc ).
Implementation: Used the exact color logic and hex codes from the MACD code, applied to the ROC histogram. This highlights momentum ebbs (falling ROC, fading waves) and flows (rising ROC, strengthening waves).
Removing Signal Line:
Unlike the previous attempt, no signal line is added. The histogram is purely the ROC value, ensuring it directly reflects price change momentum without additional smoothing, making it faster and more responsive to pulse waves, as you indicated ROC performs better than other oscillators.
Alert Conditions:
Added alerts to match the MACD’s logic, triggering when the ROC histogram crosses the zero line:
Rising to Falling: When roc >= 0 and roc < 0, signaling a potential wave peak (e.g., end of Wave 3 or C).
Falling to Rising: When roc <= 0 and roc > 0, indicating a potential wave bottom (e.g., start of Wave 1 or rebound).
These alerts help identify transitions in 3-4 wave pulse patterns.
Plotting:
Histogram: Plotted as columns (plot.style_columns) with the four-color scheme, directly representing ROC momentum.
Zero Line: Kept the gray zero line (#787B86) for reference, consistent with the MACD.
Removed ROC Line/Signal Line: Since you want the ROC to act as the histogram itself, no additional lines are plotted.
Inputs:
Retained the original length (default 9) and source (default close) inputs for consistency.
Removed signal-related inputs (e.g., signal_length, sma_signal) as they’re not needed for a pure ROC histogram.
How This ROC Histogram Works for Wave Pulses
Wave Alignment:
Above Zero (Bullish Momentum): Positive ROC bars indicate flows (e.g., impulse Waves 1, 3, or rebounds in Wave B/C). Bright green bars show accelerating momentum (strong pulses), while light green bars suggest fading momentum (potential wave tops).
Below Zero (Bearish Momentum): Negative ROC bars indicate ebbs (e.g., corrective Waves 2, 4, A, or C). Bright red bars show increasing bearish momentum (strong pullbacks), while light red bars suggest slowing declines (potential wave bottoms).
3-4 Wave Pulses:
In a 3-wave A-B-C correction: Wave A (down) shows bright red bars (falling ROC), Wave B (up) shows bright/light green bars (rising ROC), and Wave C (down) shifts back to red bars.
In a 4-wave consolidation: Alternating green/red bars highlight the rhythmic ebbs and flows as momentum oscillates.
Timing:
Zero-line crossovers mark wave transitions (e.g., from Wave 2 to Wave 3).
Color changes (e.g., bright to light green) signal momentum shifts within waves, helping identify pulse peaks/troughs.
Advantages Over MACD:
The ROC histogram is more responsive than the MACD histogram because ROC directly measures price change percentage, while MACD relies on moving average differences, which introduce lag. This makes the ROC histogram better for capturing rapid 3-4 wave pulses, as you noted.
Example Usage
For a stock with 3-4 wave pulses on a 5-minute chart:
Wave 1 (Flow): ROC rises above zero, histogram turns bright green (rising momentum), indicating a strong bullish pulse.
Wave 2 (Ebb): ROC falls below zero, histogram shifts to bright red (falling momentum), signaling a corrective pullback.
Wave 3 (Flow): ROC crosses back above zero, histogram becomes bright green again, confirming a powerful pulse.
Wave 4 (Ebb): ROC dips slightly, histogram turns light green (falling momentum above zero) or light red (rising momentum below zero), indicating consolidation.
Alerts trigger on zero-line crosses (e.g., from Wave 2 to Wave 3), helping time trades.
Settings Recommendations
Default (length=9): Works well for most time frames, balancing sensitivity and smoothness.
Intraday Pulses: Use length=5 or length=7 for faster signals on 5-minute or 15-minute charts.
Daily Charts: Try length=12 or length=14 for broader wave cycles.
Testing: Apply to a stock with clear wave patterns (e.g., tech stocks like AAPL or TSLA) and adjust length to match the pulse frequency you observe.
Notes
Confirmation: Pair the ROC histogram with price action (e.g., Fibonacci retracements, support/resistance) to validate wave counts, as momentum oscillators can be noisy in choppy markets.
Divergences: Watch for divergences (e.g., price makes a higher high, but ROC histogram bars are lower) to spot wave reversals, especially at Wave 3 or C ends.
Comparison to MACD: The ROC histogram is faster and more direct, making it ideal for short-term pulse waves, but it may be more volatile, so use with technical levels for precision.

rate_of_changeLibrary "rate_of_change"
// @description: Applies ROC algorithm to any pair of values.
// This library function is used to scale change of value (price, volume) to a percentage value, just as the ROC indicator would do. It is good practice to scale arbitrary ranges to set boundaries when you try to train statistical model.
rateOfChange(value, base, hardlimit)
This function is a helper to scale a value change to its percentage value.
Parameters:
value (float)
base (float)
hardlimit (int)
Returns: per: A float comprised between 0 and 100

ROC + SMI Auto Adjust
This indicator combines the Rate of Change (ROC) and the Stochastic Momentum Index (SMI) with automatically adjusted parameters for different time frames (short, medium, long). It normalizes the ROC to match the SMI levels, displays the ROC as a histogram and the SMI as lines, highlights overbought/oversold zones and includes a settings table. Ideal for analyzing momentum on different time frames.
Key Features:
Automatic Parameter Adjustment:
The script detects the current chart time frame (e.g. 1-minute, 1-hour, daily) and adjusts the parameters for the ROC and SMI accordingly.
Parameters such as ROC length, SMI length and smoothing periods are optimized for short, medium and long term time frames.
Rate of Change (ROC):
ROC measures the percentage change in price over a specified period.
The script normalizes the ROC values to match the SMI range, making it easier to compare the two indicators on the same scale.
The ROC is displayed as a histogram, where positive values are colored green and negative values are colored red.
Stochastic Momentum Index (SMI):
SMI is a momentum oscillator that identifies overbought and oversold conditions.
The script calculates the SMI and its signal line, plotting them on the chart.
Overbought and oversold levels are displayed as dotted lines for convenience.
SMI and SMI Signal Crossover:
When the main SMI crosses the signal line from below upwards, it may be a buy signal (bullish signal).
When the SMI crosses the signal line from above downwards, it may be a sell signal (bearish signal).
Configurable Inputs:
Users can use the automatically adjusted settings or manually override the parameters (e.g. ROC length, SMI length, smoothing periods).
Overbought and oversold levels for SMI are also configurable.
Parameter Table:
A table is displayed on the chart showing the current parameters (e.g. timeframe, ROC length, SMI length) for transparency and debugging.
The position of the table is configurable (e.g. top left, bottom right).
How it works:
The script first detects the chart timeframe and classifies it as short-term (e.g. 1M, 5M), medium-term (e.g. 1H, 4H) or long-term (e.g. D1, W1).
Based on the timeframe, it sets default values for the ROC and SMI parameters.
ROC and SMI are calculated and normalized so that they can be compared on the same scale.
ROC is displayed as a histogram, while SMI and its signal line are displayed as lines.
Overbought and oversold levels are displayed as horizontal lines.
Use cases:
Trend identification: ROC helps to identify the strength of the trend, while SMI indicates overbought/oversold conditions.
Momentum analysis: The combination of ROC and SMI provides insight into both price momentum and potential reversals.
Time frame flexibility: The auto-adjustment feature makes the script suitable for scalping (short-term), swing trading (medium-term) and long-term investing.

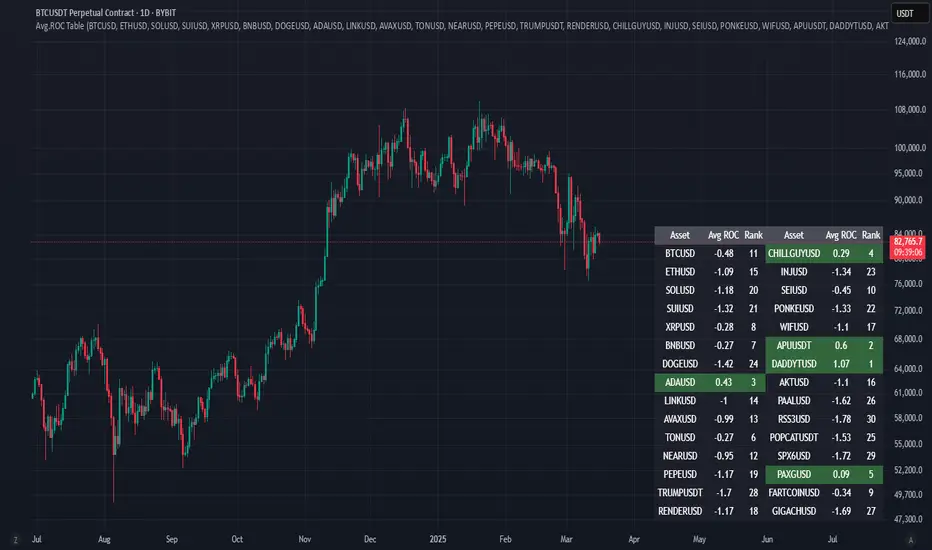
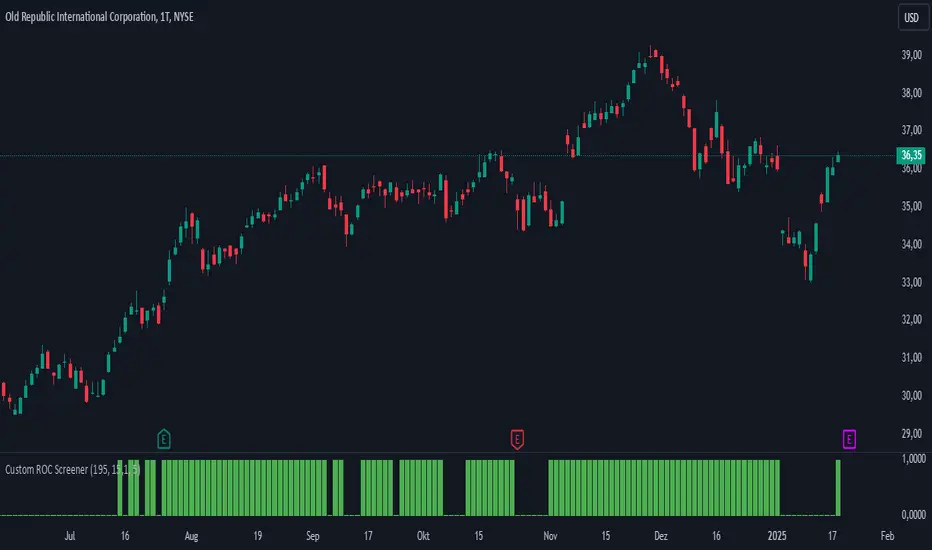
Avg.ROC TableThis indicator calculates the average Rate of Change (ROC) for up to 30 user-selected assets over a specified number of candles. It then ranks the assets—assigning rank 1 to the asset with the highest average ROC (strongest momentum) and rank 30 to the asset with the lowest. The results are displayed in a clean, easy-to-read table split into two stacks of 15 assets each, allowing you to quickly see which assets are performing best.
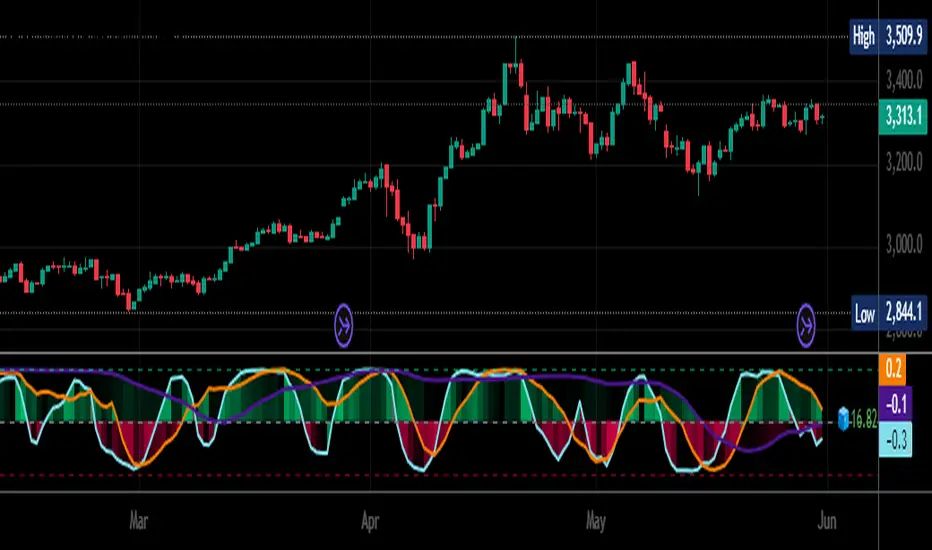
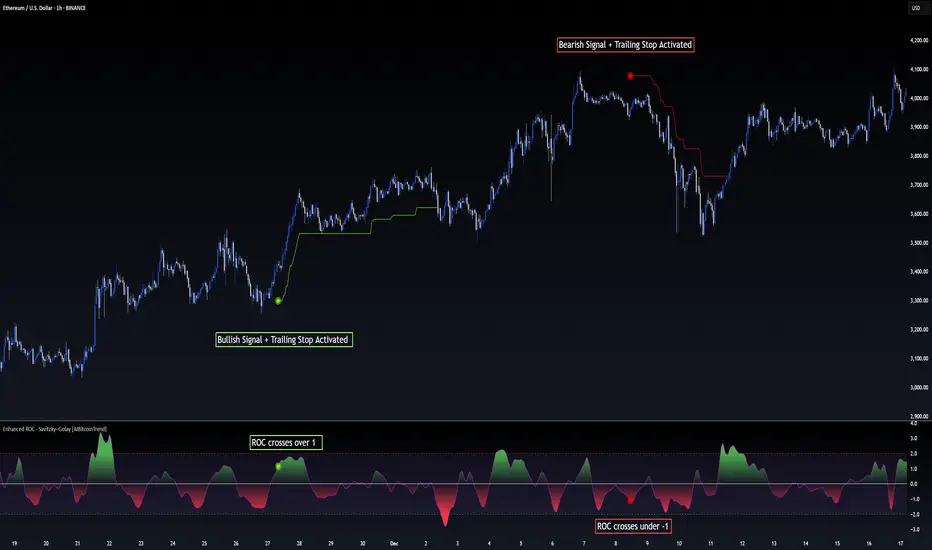
Enhanced ROC - Savitzky–Golay [AIBitcoinTrend]👽 Adaptive ROC - Savitzky–Golay (AIBitcoinTrend)
The Adaptive ROC - Savitzky–Golay redefines traditional Rate of Change (ROC) analysis by integrating Savitzky–Golay smoothing with volatility-adaptive normalization, allowing it to dynamically adjust across different market conditions. Unlike the standard ROC, which reacts rigidly to price changes, this advanced version refines trend signals while maintaining responsiveness to volatility.
Additionally, this indicator features real-time divergence detection and an ATR-based trailing stop system, equipping traders with a powerful toolset for momentum analysis, reversals, and trend-following strategies.
👽 What Makes the Adaptive ROC - Savitzky–Golay Unique?
Unlike conventional ROC indicators, this enhanced version leverages volatility-adjusted scaling and Z-score normalization to improve signal consistency across different timeframes and assets.
✅ Savitzky–Golay Smoothing – Reduces noise while preserving trend structure for clearer signals.
✅ Volatility-Adaptive Normalization – Ensures that overbought and oversold thresholds remain consistent across different markets.
✅ Real-Time Divergence Detection – Identifies early bullish and bearish divergence signals for potential reversals.
✅ Crossovers & ATR-Based Trailing Stops – Implements intelligent trade management with dynamic stop levels.
👽 The Math Behind the Indicator
👾 Savitzky–Golay Smoothing
The indicator applies a Savitzky–Golay filter to the raw ROC data, creating a smoother curve while preserving key inflection points. This technique prevents excessive lag while maintaining the integrity of price movements.
sg_roc = (roc_raw + 3*roc_raw + 5*roc_raw + 7*roc_raw + 5*roc_raw + 3*roc_raw + roc_raw ) / 25
👾 Volatility-Adaptive Scaling
By dynamically adjusting the smoothed ROC using standard deviation, the indicator ensures that momentum readings remain relative to the market’s current volatility.
volatility = ta.stdev(close, rocLength)
dynamicFactor = 1 / (1 + volatility / 100)
advanced_sg_roc = sg_roc * dynamicFactor
👾 Z-Score Normalization
To maintain a stable Overbought/Oversold structure across different markets, the ROC is normalized using a Z-score transformation, ensuring its values remain statistically relevant.
rocMean = ta.wma(advanced_sg_roc, lenZ)
rocStdev = ta.stdev(advanced_sg_roc, lenZ)
zRoc = (advanced_sg_roc - rocMean) / rocStdev
👽 How Traders Can Use This Indicator
👾 Divergence Trading Strategy
Bullish Divergence Setup:
Price makes a lower low, while the ROC forms a higher low.
A buy signal is confirmed when the ROC starts rising.
Bearish Divergence Setup:
Price makes a higher high, while the ROC forms a lower high.
A sell signal is confirmed when the ROC starts declining.
👾 Buy & Sell Signals with Trailing Stop
Bullish Setup:
✅ ROC crosses above the bullish trigger level → Buy Signal.
✅ A bullish trailing stop is placed at Low - (ATR × Multiplier).
✅ Exit if price crosses below the stop.
Bearish Setup:
✅ ROC crosses below the bearish trigger level → Sell Signal.
✅ A bearish trailing stop is placed at High + (ATR × Multiplier).
✅ Exit if price crosses above the stop.
👽 Why It’s Useful for Traders
Savitzky–Golay Filtering – Retains essential trend details while eliminating excessive noise.
Volatility-Adjusted Normalization – Makes overbought/oversold levels universally reliable across markets.
Real-Time Divergence Alerts – Identifies early reversal signals for optimal entries and exits.
ATR-Based Risk Management – Ensures stops dynamically adapt to market conditions.
Works Across Markets & Timeframes - Suitable for stocks, forex, crypto, and futures trading.
👽 Indicator Settings
ROC Period – Defines the number of bars used for ROC calculation.
Smoothing Strength – Adjusts the degree of Savitzky–Golay filtering.
Volatility Scaling – Enables or disables the adaptive volatility factor.
Enable Divergence Analysis – Turns on real-time divergence detection.
Lookback Period – Specifies the pivot detection period for divergences.
Enable Crosses Signals – Activates trade signals based on ROC crossovers.
ATR Multiplier – Controls the sensitivity of the trailing stop.
Disclaimer: This indicator is designed for educational purposes and does not constitute financial advice. Please consult a qualified financial advisor before making investment decisions.
Johnny's Volatility-Driven Trend Identifier w/ Reversal SignalsJohnny's Volatility-Driven Trend Identifier w/ Reversal Signals is designed to identify high-probability trend shifts and reversals by incorporating volatility, momentum, and impulse-based filtering. It is specifically built for traders who want to capture strong trend movements while minimizing false signals caused by low volatility noise.
By leveraging Rate of Change (ROC), Relative Strength Index (RSI), and Average True Range (ATR)-based volatility detection, the indicator dynamically adapts to market conditions. It highlights breakout trends, reversals, and early signs of momentum shifts using strategically placed labels and color-coded trend visualization.
Inspiration taken from Top G indicator .
What This Indicator Does
The Volatility-Driven Trend Identifier works by:
Measuring Market Extremes & Momentum:
Uses ROC normalization with standard deviation to identify impulse moves in price action.
Implements RSI filtering to determine overbought/oversold conditions that validate trend strength.
Utilizes ATR-based volatility tracking to ensure signals only appear when meaningful market movements are occurring.
Identifying Key Trend Events:
Power Peak (🔥): Marks a confirmed strong downtrend, ideal for shorting opportunities.
Surge (🚀): Indicates a confirmed strong uptrend, signaling a potential long entry.
Soft Surge (↗): Highlights a mild bullish reentry or early uptrend formation.
Soft Peak (↘): Shows a mild bearish reentry or early downtrend formation.
Providing Adaptive Filtering for Reliable Signals:
Filters out weak trends with a volatility check, ensuring signals appear only in strong market conditions.
Implements multi-level confirmation by combining trend strength metrics, preventing false breakouts.
Uses gradient-based visualization to color-code market sentiment for quick interpretation.
What This Indicator Signals
Breakouts & Impulse Moves: 🚀🔥
The Surge (🚀) and Power Peak (🔥) labels indicate confirmed momentum breakouts, where the trend has been validated by a combination of ROC impulse, RSI confirmation, and ATR volatility filtering.
These signals suggest that the market is entering a strong trend, and traders can align their entries accordingly.
Early Trend Formation & Reentries: ↗ ↘
The Soft Surge (↗) and Soft Peak (↘) labels indicate areas where a trend might be forming, but is not yet fully confirmed.
These signals help traders anticipate potential entries before the trend gains full strength.
Volatility-Adaptive Trend Filtering: 📊
Since the indicator only activates in volatile conditions, it avoids the pitfalls of low-range choppy markets where false signals frequently occur.
ATR-driven adaptive windowing allows the indicator to dynamically adjust its sensitivity based on real-time volatility conditions.
How to Use This Indicator
1. Identifying High-Probability Entries
Bullish Entries (Long Trades)
Look for 🚀 Surge signals in an uptrend.
Confirm with RSI (should be above 50 for momentum).
Ensure volatility is increasing to validate the breakout.
Use ↗ Soft Surge signals for early entries before the trend fully confirms.
Bearish Entries (Short Trades)
Look for 🔥 Power Peak signals in a downtrend.
RSI should be below 50, indicating downward momentum.
Volatility should be rising, ensuring market momentum is strong.
Use ↘ Soft Peak signals for early entries before a full bearish confirmation.
2. Avoiding False Signals
Ignore signals when the market is ranging (low ATR).
Check RSI and ROC alignment to ensure trend confirmation.
Use additional confluences (e.g., price action, support/resistance levels, moving averages) for enhanced accuracy.
3. Trend Confirmation & Filtering
The stronger the trend, the higher the likelihood that Surge (🚀) and Power Peak (🔥) signals will continue in their direction.
Soft Surge (↗) and Soft Peak (↘) act as early warning signals before major breakouts occur.
What Makes This a Machine Learning-Inspired Moving Average?
While this indicator is not a direct implementation of machine learning (as Pine Script lacks AI/ML capabilities), it mimics machine learning principles by adapting dynamically to market conditions using the following techniques:
Adaptive Trend Selection:
It does not rely on fixed moving averages but instead adapts dynamically based on volatility expansion and momentum detection.
ATR-based filtering adjusts the indicator’s sensitivity to real-time conditions.
Multi-Factor Confirmation (Feature Engineering Equivalent in ML):
Combines ROC, RSI, and ATR in a structured way, similar to how ML models use multiple inputs to filter and classify data.
Implements conditional trend recognition, ensuring that only valid signals pass through the filter.
Noise Reduction with Data Smoothing:
The algorithm avoids false signals by incorporating trend intensity thresholds, much like how ML models remove outliers to refine predictions.
Adaptive filtering ensures that low-volatility environments do not produce misleading signals.
Why Use This Indicator?
✔ Reduces False Signals: Multi-factor validation ensures only high-confidence signals are triggered.
✔ Works in All Market Conditions: Volatility-adaptive nature allows the indicator to perform well in both trending and ranging markets.
✔ Great for Swing & Intraday Trading: It helps spot momentum shifts early and allows traders to catch major market moves before they fully develop.
✔ Visually Intuitive: Color-coded trends and clear signal markers make it easy to interpret.

Custom ROCThe Custom ROC allows you to set the length of the ROC. You can also set a reference value and an upward deviation. The sum of the reference value and deviation is shown as a green line.
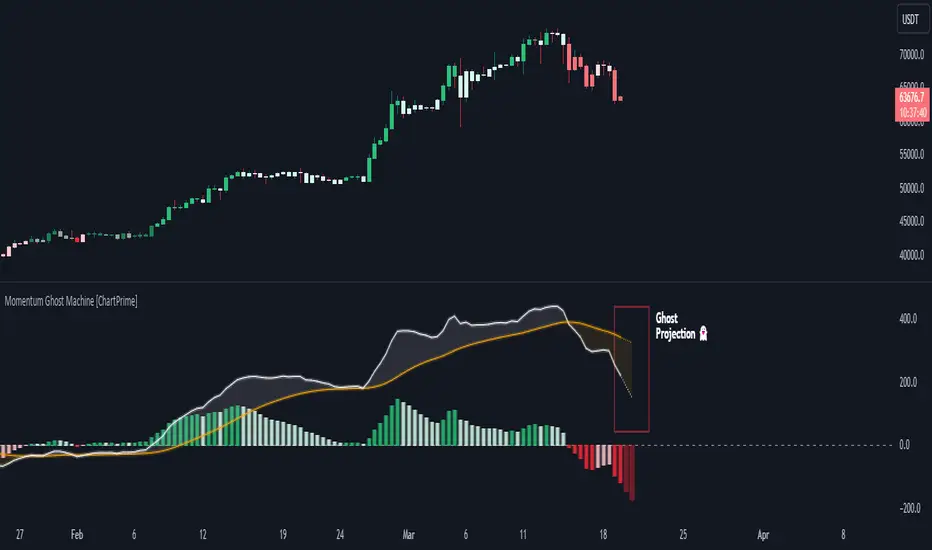
Momentum Ghost Machine [ChartPrime]Momentum Ghost Machine (ChartPrime) is designed to be the next generation in momentum/rate of change analysis. This indicator utilizes the properties of one of our favorite filters to create a more accurate and stable momentum oscillator by using a high quality filtered delayed signal to do the momentum comparison.
Traditional momentum/roc uses the raw price data to compare current price to previous price to generate a directional oscillator. This leaves the oscillator prone to false readings and noisy outputs that leave traders unsure of the real likelihood of a future movement. One way to mitigate this issue would be to use some sort of moving average. Unfortunately, this can only go so far because simple moving average algorithms result in a poor reconstruction of the actual shape of the underlying signal.
The windowed sinc low pass filter is a linear phase filter, meaning that it doesn't change the shape or size of the original signal when applied. This results in a faithful reconstruction of the original signal, but without the "high frequency noise". Just like any filter, the process of applying it requires that we have "future" samples resulting in a time delay for real time applications. Fortunately this is a great thing in the context of a momentum oscillator because we need some representation of past price data to compare the current price data to. By using an ideal low pass filter to generate this delayed signal we can super charge the momentum oscillator and fix the majority of issues its predecessors had.
This indicator has a few extra features that other momentum/roc indicators dont have. One major yet simple improvement is the inclusion of a moving average to help gauge the rate of change of this indicator. Since we included a moving average, we thought it would only be appropriate to add a histogram to help visualize the relationship between the signal and its average. To go further with this we have also included linear extrapolation to further help you predict the momentum and direction of this oscillator. Included with this extrapolation we have also added the histogram in the extrapolation to further enhance its visual interpretation. Finally, the inclusion of a candle coloring feature really drives how the utility of the Momentum Machine .
There are three distinct options when using the candle coloring feature: Direct, MA, and Both. With direct the candles will be colored based on the indicators direction and polarity. When it is above zero and moving up, it displays a green color. When it is above zero and moving down it will display a light green color. Conversely, when the indicator is below zero and moving down it displays a red color, and when it it moving up and below zero it will display a light red color. MA coloring will color the candles just like a MACD. If the signal is above its MA and moving up it will display a green color, and when it is above its MA and moving down it will display a light green color.
When the signal is below its MA and moving down it will display a red color, and when its below its ma and moving up it will display a light red color. Both combines the two into a single color scheme providing you with the best of both worlds. If the indicator is above zero it will display the MA colors with a slight twist. When the indicator is moving down and is below its MA it will display a lighter color than before, and when it is below zero and is above its MA it will display a darker color color.
Length of 50 with a smoothing of 100
Length of 50 with a smoothing of 25
By default, the indicator is set to a momentum length of 50, with a post smoothing of 2. We have chosen the longer period for the momentum length to highlight the performance of this indicator compared to its ancestors. A major point to consider with this indicator is that you can only achieve so much smoothing for a chosen delay. This is because more data is required to produce a smoother signal at a specified length. Once you have selected your desired momentum length you can then select your desired momentum smoothing . This is made possible by the use of the windowed sinc low pass algorithm because it includes a frequency cutoff argument. This means that you can have as little or as much smoothing as you please without impacting the period of the indicator. In the provided examples above this paragraph is a visual representation of what is going on under the hood of this indicator. The blue line is the filtered signal being compared to the current closing price. As you can see, the filtered signal is very smooth and accurately represents the underlying price action without noise.
We hope that users can find the same utility as we did in this indicator and that it levels up your analysis utilizing the momentum oscillator or rate of change.
Enjoy
Exponentially Weighted Moving Average Oscillator [BackQuant]Exponentially Weighted Moving Average (EWMA)
The Exponentially Weighted Moving Average (EWMA) is a quantitative or statistical measure used to model or describe a time series. The EWMA is widely used in finance, the main applications being technical analysis and volatility modeling.
The moving average is designed as such that older observations are given lower weights. The weights fall exponentially as the data point gets older – hence the name exponentially weighted.
Applications of the EWMA
The EWMA is widely used in technical analysis. It may not be used directly, but it is used in conjunction with other indicators to generate trading signals. A well-known example is the Negative Volume Index (NVI), which is used in conjunction with its EWMA.
Why is it different from the In-Built TradingView EWMA
Adaptive Algorithms: If your strategy requires the alpha parameter to change adaptively based on certain conditions (for example, based on market volatility), a for loop can be used to adjust the weights dynamically within the loop as opposed to the fixed decay rate in the standard EWMA.
Customization: A for loop allows for more complex and nuanced calculations that may not be directly supported by built-in functions. For example, you might want to adjust the weights in a non-standard way that the typical EWMA calculation doesn't allow for.
Use of the Oscillator
This mainly comes from 3 main premises, this is something I like to do personally since it is easier to work with them in the context of my system. E.g. Using them to spot clear trends without noise on longer timeframes.
Clarity: Plotting the EWMA as an oscillator provides a clear visual representation of the momentum or trend strength. It allows traders to see overbought or oversold conditions relative to a normalized range.
Comparison: An oscillator can make it easier to compare different securities or timeframes on a similar scale, especially when normalized. This is because the oscillator values are typically bounded within a range (like -1 to 1 or 0 to 100), whereas the actual price series can vary significantly.
Focus on Change: When plotted as an oscillator, the focus is on the rate of change or the relative movement of the EWMA, not on the absolute price levels. This can help traders spot divergences or convergences that may not be as apparent when the EWMA is plotted directly on the price chart. This is also one reason there is a conditional plotting on the chart.
Trend Strength: When normalized, the distance of the oscillator from its midpoint can be interpreted as the strength of the trend, providing a quantitative measure that can be used to make systematic trading decisions.
Here are the backtests on the 1D Timeframe for
BITSTAMP:BTCUSD
BITSTAMP:ETHUSD
COINBASE:SOLUSD
When using this script the user is able to define a source and period, which by extension calculates the alpha. An option to colour the bars accord to trend.
This makes it super easy to use in a system.
I recommend using this as above the midline (0) for a positive trend and below the midline for negative trend.
Hence why I put a label on the last bar to ensure it is easier for traders to read.
Lastly, The decreasing colour relative to RoC, this also helps traders to understand the strength of the indicator and gain insight into when to potentially reduce position size.
This indicator is best used in the medium timeframe.

DIY Custom Strategy Builder [ZP] - v1DISCLAIMER:
This indicator as my first ever Tradingview indicator, has been developed for my personal trading analysis, consolidating various powerful indicators that I frequently use. A number of the embedded indicators within this tool are the creations of esteemed Pine Script developers from the TradingView community. In recognition of their contributions, the names of these developers will be prominently displayed alongside the respective indicator names. My selection of these indicators is rooted in my own experience and reflects those that have proven most effective for me. Please note that the past performance of any trading system or methodology is not necessarily indicative of future results. Always conduct your own research and due diligence before using any indicator or tool.
===========================================================================
Introducing the ultimate all-in-one DIY strategy builder indicator, With over 30+ famous indicators (some with custom configuration/settings) indicators included, you now have the power to mix and match to create your own custom strategy for shorter time or longer time frames depending on your trading style. Say goodbye to cluttered charts and manual/visual confirmation of multiple indicators and hello to endless possibilities with this indicator.
What it does
==================
This indicator basically help users to do 2 things:
1) Strategy Builder
With more than 30 indicators available, you can select any combination you prefer and the indicator will generate buy and sell signals accordingly. Alternative to the time-consuming process of manually confirming signals from multiple indicators! This indicator streamlines the process by automatically printing buy and sell signals based on your chosen combination of indicators. No more staring at the screen for hours on end, simply set up alerts and let the indicator do the work for you.
Available indicators that you can choose to build your strategy, are coded to seamlessly print the BUY and SELL signal upon confirmation of all selected indicators:
EMA Filter
2 EMA Cross
3 EMA Cross
Range Filter (Guikroth)
SuperTrend
Ichimoku Cloud
SuperIchi (LuxAlgo)
B-Xtrender (QuantTherapy)
Bull Bear Power Trend (Dreadblitz)
VWAP
BB Oscillator (Veryfid)
Trend Meter (Lij_MC)
Chandelier Exit (Everget)
CCI
Awesome Oscillator
DMI ( Adx )
Parabolic SAR
Waddah Attar Explosion (Shayankm)
Volatility Oscillator (Veryfid)
Damiani Volatility ( DV ) (RichardoSantos)
Stochastic
RSI
MACD
SSL Channel (ErwinBeckers)
Schaff Trend Cycle ( STC ) (LazyBear)
Chaikin Money Flow
Volume
Wolfpack Id (Darrellfischer1)
QQE Mod (Mihkhel00)
Hull Suite (Insilico)
Vortex Indicator
2) Overlay Indicators
Access the full potential of this indicator using the SWITCH BOARD section! Here, you have the ability to turn on and plot up to 14 of the included indicators on your chart. Simply select from the following options:
EMA
Support/Resistance (HeWhoMustNotBeNamed)
Supply/ Demand Zone ( SMC ) (Pmgjiv)
Parabolic SAR
Ichimoku Cloud
Superichi (LuxAlgo)
SuperTrend
Range Filter (Guikroth)
Average True Range (ATR)
VWAP
Schaff Trend Cycle ( STC ) (LazyBear)
PVSRA (TradersReality)
Liquidity Zone/Vector Candle Zone (TradersReality)
Market Sessions (Aurocks_AIF)
How it does it
==================
To explain how this indictor generate signal or does what it does, its best to put in points.
I have coded the strategy for each of the indicator, for some of the indicator you will see the option to choose strategy variation, these variants are either famous among the traders or its the ones I found more accurate based on my usage. By coding the strategy I will have the BUY and SELL signal generated by each indicator in the backend.
Next, the indicator will identify your selected LEADING INDICATOR and the CONFIRMATION INDICATOR(s).
On each candle close, the indicator will check if the selected LEADING INDICATOR generates signal (long or short).
Once the leading indicator generates the signal, then the indicator will scan each of the selected CONFIRMATION INDICATORS on candle close to check if any of the CONFIRMATION INDICATOR generated signal (long or short).
Until this point, all the process is happening in the backend, the indicator will print LONG or SHORT signal on the chart ONLY if LEADING INDICATOR and all the selected CONFIRMATION INDICATORS generates signal on candle close. example for long signal, the LEADING INDICATOR and all selected CONFIRMATION INDICATORS must print long signal.
The dashboard table will show your selected LEADING and CONFIRMATION INDICATORS and if LEADING or the CONFIRMATION INDICATORS have generated signal. Signal generated by LEADING and CONFIRMATION indicator whether long or short, is indicated by tick icon ✔. and if any of the selected CONFIRMATION or LEADING indicator does not generate signal on candle close, it will be indicated with cross symbol ✖.
how to use this indicator
==============================
Using the indicator is pretty simple, but it depends on your goal, whether you want to use it for overlaying the available indicators or using it to build your strategy or for both.
To use for Building your strategy: Select your LEADING INDICATOR, and then select your CONFIRMATION INDICATOR(s). if on candle close all the indicators generate signal, then this indicator will print SHORT or LONG signal on the chart for your entry. There are plenty of indicators you can use to build your strategy, some indicators are best for longer time frame setups while others are responsive indicators that are best for short time frame.
To use for overlaying the indicators: Open the setting of this indicator and scroll to the SWITCHBOARD section, from there you can select which indicator you want to plot on the chart.
For each of the listed indicators, you have the flexibility to customize the settings and configurations to suit your preferences. simply open indicator setting and scroll down, you will find configuration for each of the indicators used.
I will also release the Strategy Backtester for this indicator soon.

How To Input CSV List Of Symbol Data Used For ScreenerExample of how to input multiple symbols at once using a CSV list of ticker IDs. The input list is extracted into individual ticker IDs which are then each used within an example screener function that calculates their rate of change. The results for each of the rate of changes are then plotted.
For code brevity this example only demonstrates using up to 4 symbols, but the logic is annotated to show how it can easily be expanded for use with up to 40 ticker IDs.
The CSV list used for input may contain spaces or no spaces after each comma separator, but whichever format (space or no space) is used must be used consistently throughout the list. If the list contains any invalid symbols the script will display a red exclamation mark that when clicked will display those invalid symbols.
If more than 4 ticker IDs are input then only the first 4 are used. If less than 4 ticker IDs are used then the unused screener calls will return `float(na)`. In the published chart the input list is using only 3 ticker IDs so there are only 3 plots shown instead of 4.
NOTICE: This is an example script and not meant to be used as an actual strategy. By using this script or any portion thereof, you acknowledge that you have read and understood that this is for research purposes only and I am not responsible for any financial losses you may incur by using this script!

Coppock Curve w/ Early Turns [QuantVue]The Coppock Curve is a momentum oscillator developed by Edwin Coppock in 1962. The curve is calculated using a combination of the rate of change (ROC) for two distinct periods, which are then subjected to a weighted moving average (WMA).
History of the Coppock Curve:
The Coppock Curve was originally designed for use on a monthly time frame to identify buying opportunities in stock market indices, primarily after significant declines or bear markets.
Historically, the monthly time frame has been the most popular for the Coppock Curve, especially for long-term trend analysis and spotting the beginnings of potential bull markets after bearish periods.
The signal wasn't initially designed for finding sell signals, however it can be used to look for tops as well.
When the indicator is above zero it indicates a hold. When the indicator drops below zero it indicates a sell, and when the indicator moves above zero it signals a buy.
While this indicator was originally designed to be used on monthly charts of the indices, many traders now use this on individual equities and etfs on all different time frames.
About this Indicator:
The Coppock Curve is plotted with colors changing based on its position relative to the zero line. When above zero, it's green, and when below, it's red. (default settings)
An absolute zero line is also plotted in black to serve as a reference.
In addition to the classic Coppock Curve, this indicator looks to identify "early turns" or potential reversals of the Coppock Curve rather than waiting for the indicator to cross above or below the zero line.
Give this indicator a BOOST and COMMENT your thoughts!
We hope you enjoy.
Cheers!

Kalman Filtered ROC & Stochastic with MA SmoothingThe "Smooth ROC & Stochastic with Kalman Filter" indicator is a trend following tool designed to identify trends in the price movement. It combines the Rate of Change (ROC) and Stochastic indicators into a single oscillator, the combination of ROC and Stochastic indicators aims to offer complementary information: ROC measures the speed of price change, while Stochastic identifies overbought and oversold conditions, allowing for a more robust assessment of market trends and potential reversals. The indicator plots green "B" labels to indicate buy signals and blue "S" labels to represent sell signals. Additionally, it displays a white line that reflects the overall trend for buy signals and a blue line for sell signals. The aim of the indicator is to incorporate Kalman and Moving Average (MA) smoothing techniques to reduce noise and enhance the clarity of the signals.
Rationale for using Kalman Filter:
The Kalman Filter is chosen as a smoothing tool in the indicator because it effectively reduces noise and fluctuations. The Kalman Filter is a mathematical algorithm used for estimating and predicting the state of a system based on noisy and incomplete measurements. It combines information from previous states and current measurements to generate an optimal estimate of the true state, while simultaneously minimizing the effects of noise and uncertainty. In the context of the indicator, the Kalman Filter is applied to smooth the input data, which is the source for the Rate of Change (ROC) calculation. By considering the previous smoothed state and the difference between the current measurement and the predicted value, the Kalman Filter dynamically adjusts its estimation to reduce the impact of outliers.
Calculation:
The indicator utilizes a combination of the ROC and the Stochastic indicator. The ROC is smoothed using a Kalman Filter (credit to © Loxx: ), which helps eliminate unwanted fluctuations and improve the signal quality. The Stochastic indicator is calculated with customizable parameters for %K length, %K smoothing, and %D smoothing. The smoothed ROC and Stochastic values are then averaged using the formula ((roc + d) / 2) to create the blended oscillator. MA smoothing is applied to the combined oscillator aiming to further reduce fluctuations and enhance trend visibility. Traders are free to choose their own preferred MA type from 'EMA', 'DEMA', 'TEMA', 'WMA', 'VWMA', 'SMA', 'SMMA', 'HMA', 'LSMA', and 'PEMA' (credit to: © traderharikrishna for this code: ).
Application:
The indicator's buy signals (represented by green "B" labels) indicate potential entry points for buying assets, suggesting a bullish trend. The white line visually represents the trend, helping traders identify and follow the upward momentum. Conversely, the sell signals (blue "S" labels) highlight possible exit points or opportunities for short selling, indicating a bearish trend. The blue line illustrates the bearish movement, aiding in the identification of downward momentum.
The "Smoothed ROC & Stochastic" indicator offers traders a comprehensive view of market trends by combining two powerful oscillators. By incorporating the ROC and Stochastic indicators into a single oscillator, it provides a more holistic perspective on the market's momentum. The use of a Kalman Filter for smoothing helps reduce noise and enhance the accuracy of the signals. Additionally, the indicator allows customization of the smoothing technique through various moving average types. Traders can also utilize the overbought and oversold zones for additional analysis, providing insights into potential market reversals or extreme price conditions. Please note that future performance of any trading strategy is fundamentally unknowable, and past results do not guarantee future performance.

Normalized Volume Rate of ChangeThis indicator is designed to help traders gauge changes in volume dynamics and identify potential shifts in buying or selling pressure. By normalizing the volume rate of change and comparing it to moving averages of itself, it offers valuable insights into market trends and can assist in making informed trading decisions.
Calculation:
The indicator calculates the Volume Rate of Change (VROC) by measuring the percentage change in volume over a specified length. This calculation provides a relative measure of how quickly the volume is increasing or decreasing. It then normalizes the VROC to a range of -1 to +1 by scaling it based on the highest and lowest values observed within the specified length. This normalization allows for easy comparison of the current VROC value with historical levels, enabling traders to assess the intensity of volume fluctuations.
Interpretation:
The main plot of the indicator displays the normalized VROC values as columns. The color of each column provides valuable information about the relationship between the VROC and the moving averages. Lime-colored columns indicate that the VROC is above both moving averages, suggesting increased buying pressure and potential bullish sentiment. Conversely, fuchsia-colored columns indicate that the VROC is below both moving averages, suggesting increased selling pressure and potential bearish sentiment. Yellow-colored columns indicate that the VROC is between the two moving averages, reflecting a period of consolidation or indecision in the market.
To further enhance interpretation, the indicator includes two moving averages. The Aqua line represents the faster moving average (MA1), and the Orange line represents the slower moving average (MA2). These moving averages provide additional context by smoothing out the VROC values and highlighting the overall trend. Traders can observe the interaction between the moving averages and the VROC to identify potential crossovers and assess the strength of trend reversals or continuations.
Colors:
-- Lime : The lime color is used to represent high volume rate of change above both moving averages. This color indicates a potentially bullish market sentiment, suggesting that buyers are dominant.
-- Fuchsia : The fuchsia color is used to represent low volume rate of change below both moving averages. This color indicates a potentially bearish market sentiment, suggesting that sellers are dominant.
-- Yellow : The yellow color is used to represent the volume rate of change between the two moving averages. This color reflects a transitional phase where neither buyers nor sellers have a clear advantage, signaling a period of consolidation or indecision in the market.
To provide additional visual cues for potential trade signals, the indicator includes lime-colored arrows below the price chart when there is a crossover upwards (MA1 crossing above MA2). This lime arrow indicates a potential bullish signal, suggesting a favorable time to consider long positions. Similarly, fuchsia-colored arrows are displayed above the price chart when there is a crossover downwards (MA1 crossing below MA2), signaling a potential bearish signal and suggesting a favorable time to consider short positions.
Applications:
This indicator offers various applications in trading strategies, including:
-- Trend Identification : By observing the relationship between the normalized VROC and the moving averages, traders can identify potential shifts in market trends. Lime-colored columns above both moving averages indicate a strong bullish trend, suggesting an opportunity to capitalize on upward price movements. Conversely, fuchsia-colored columns below both moving averages indicate a strong bearish trend, suggesting an opportunity to profit from downward price movements. Yellow-colored columns between the moving averages indicate a period of consolidation or uncertainty, signaling a potential trend reversal or continuation.
-- Confirmation of Price Moves : The indicator's ability to reflect volume dynamics in relation to the moving averages can help traders validate price moves. When significant price movements are accompanied by lime-colored columns (indicating high volume rate of change above both moving averages), it adds confirmation to the bullish sentiment. Similarly, fuchsia-colored columns accompanying downward price movements validate the bearish sentiment. This confirmation can enhance traders' confidence in the reliability of price moves.
-- Trade Timing : The indicator's moving average crossovers and the presence of arrows provide timing signals for trade entries and exits. Lime arrows appearing below the price chart signal potential long entry opportunities, indicating a bullish market sentiment. Conversely, fuchsia arrows appearing above the price chart suggest potential short entry opportunities, indicating a bearish market sentiment. These signals can be used in conjunction with other technical analysis tools to improve trade timing and increase the probability of successful trades.
Parameter Adjustments:
Traders can adjust the length of the VROC and the moving averages according to their trading preferences and timeframes. Longer VROC lengths provide a broader view of volume dynamics over an extended period, making it suitable for assessing long-term trends. Shorter VROC lengths offer a more sensitive measure of recent volume changes, making it suitable for shorter-term analysis. Similarly, adjusting the lengths of the moving averages can help adapt the indicator to different market conditions and trading styles.
Limitations:
While the indicator provides valuable insights, it has some limitations that traders should be aware of:
-- False Signals : Like any technical indicator, false signals can occur. During periods of low liquidity or in choppy markets, the indicator may generate misleading signals. It is essential to consider other indicators, price action, and fundamental analysis to confirm the signals before taking any trading actions.
-- Lagging Nature : Moving averages inherently lag behind the price action and volume changes. As a result, there may be a delay in the generation of signals and capturing trend reversals. Traders should exercise patience and avoid solely relying on this indicator for immediate trade decisions. Combining it with other indicators and tools can provide a more comprehensive picture of market conditions.
In conclusion, this indicator offers valuable insights into volume dynamics and trend analysis. By comparing the normalized VROC with moving averages, traders can identify shifts in buying or selling pressure, validate price moves, and improve trade timing. However, it is important to consider its limitations and use it in conjunction with other technical analysis tools to form a well-rounded trading strategy. Additionally, thorough testing, experimentation, and customization of the indicator's parameters are recommended to align it with individual trading preferences and market conditions.

Ultimate Balance StrategyThe Ultimate Balance Oscillator Strategy harnesses the power of the Ultimate Balance Oscillator to deliver a comprehensive and disciplined approach to trading. By combining the insights of the Rate of Change (ROC), Relative Strength Index (RSI), Commodity Channel Index (CCI), Williams Percent Range, and Average Directional Index (ADX) from TradingView, this strategy offers traders a systematic way to navigate the markets with precision.
The core principle of this strategy lies in its ability to identify optimal entry and exit points based on the movement of the Ultimate Balance Oscillator. When the oscillator line crosses below the 0.75 level, a buy signal is generated, indicating a potential opportunity for a bullish trend reversal. Conversely, when the oscillator line crosses above the 0.25 level, it triggers an exit signal, suggesting a possible end to a bullish trend.
Key Features:
1. Objective Market Analysis: The Ultimate Balance Oscillator Strategy provides a disciplined and objective approach to market analysis. By relying on the quantified insights of multiple indicators, it helps traders cut through market noise and focus on key signals, improving decision-making and reducing emotional biases.
2. Enhanced Timing and Precision: This strategy's entry and exit signals are based on the specific thresholds of the Ultimate Balance Oscillator. By waiting for confirmation through the crossing of these levels, traders can potentially enter trades at opportune moments and exit with greater precision, maximizing profit potential and minimizing risk exposure.
3. Customizability and Adaptability: The strategy offers flexibility, allowing traders to customize the parameters to fit their preferred trading style and timeframes. Whether you're a short-term trader or a long-term investor, the Ultimate Balance Oscillator Strategy can be adjusted to suit your specific needs, making it adaptable to various market conditions.
4. Real-time Alerts: Stay informed and never miss a potential trade opportunity with the strategy's built-in alert system. Set personalized alerts for buy and exit signals to receive timely notifications, ensuring you're always aware of the latest developments in the market.
5. Backtesting and Optimization: Before applying the strategy to live trading, it's recommended to conduct thorough backtesting and optimization. By testing the strategy's performance over historical data and fine-tuning the parameters, you can gain insights into its strengths and weaknesses, enabling you to make informed adjustments and increase its effectiveness.
Trading involves risk. Use the Ultimate Balance Oscillator Strategy at your own discretion. Past performance is not indicative of future results.

Ultimate Balance OscillatorIntroducing the Ultimate Balance Oscillator: A Powerful Trading Indicator
Built upon the renowned Rate of Change (ROC), Relative Strength Index (RSI), Commodity Channel Index (CCI), Williams Percent Range, and Average Directional Index (ADX) from TradingView, this indicator equips traders with an unparalleled understanding of market dynamics.
What sets the Ultimate Balance Oscillator apart is its meticulous approach to weighting. Each component is assigned a weight that reflects its individual significance, while carefully mitigating the influence of highly correlated signals. This strategic weighting methodology ensures an unbiased and comprehensive representation of market sentiment, eliminating dominance by any single indicator.
Key Features and Benefits:
1. Comprehensive Market Analysis: The Ultimate Balance Oscillator provides a comprehensive view of market conditions, enabling traders to discern price trends, evaluate momentum shifts, identify overbought or oversold levels, and gauge the strength of prevailing trends. This holistic perspective empowers traders to make well-informed decisions based on a thorough understanding of the market.
2. Enhanced Signal Accuracy: With its refined weighting approach, the Ultimate Balance Oscillator filters out noise and emphasizes the most relevant information. This results in heightened signal accuracy, providing traders with a distinct advantage in identifying optimal entry and exit points. Say goodbye to unreliable signals and welcome a more precise and dependable trading experience.
3. Adaptability to Various Trading Scenarios: The Ultimate Balance Oscillator transcends the constraints of specific markets or timeframes. It seamlessly adapts to diverse trading scenarios, accommodating both short-term trades and long-term investments. Traders can customize this indicator to suit their preferred trading style and effortlessly navigate ever-changing market conditions.
4. Simplicity and Ease of Use: The Ultimate Balance Oscillator simplifies trading analysis by providing a single line on the chart. Its straightforward interpretation and seamless integration into trading strategies make decision-making effortless. By observing bullish or bearish crossovers with the moving average, recognizing overbought or oversold levels, and tracking the overall trend of the oscillator, traders can make well-informed decisions with confidence.
5. Real-time Alerts: Stay ahead of the game with the Ultimate Balance Oscillator's customizable alert system. Traders can set up personalized alerts for bullish or bearish crossovers, breaches of overbought or oversold thresholds, or any specific events that align with their trading strategy. Real-time notifications enable timely action, ensuring traders never miss lucrative trading opportunities.
The Ultimate Balance Oscillator is a robust trading companion, empowering traders to make shrewd and calculated decisions. Embrace its power and elevate your trading endeavors to new heights of precision and success. Discover the potential of the Ultimate Balance Oscillator and unlock a world of trading possibilities.

[TTI] NDR 63-Day QQQ-QQEW ROC% SpreadWelcome to the NDR 63-Day QQQ-QQEW ROC% Spread script! This script is a powerful tool that calculates and visualizes the 63-day Rate of Change (ROC%) spread between the QQQ and QQEW tickers. This script is based on the research conducted by Ned Davis Research (NDR), a renowned name in the field of investment strategy.
⚙️ Key Features:
👉Rate of Change Calculation: The script calculates the 63-day Rate of Change (ROC%) for both QQQ and QQEW tickers. The ROC% is a momentum oscillator that measures the percentage price change over a given time period.
👉Spread Calculation: The script calculates the spread between the ROC% of QQQ and QQEW. This spread can be used to identify potential trading opportunities.
👉Visual Representation: The script plots the spread on the chart, providing a visual representation of the ROC% spread. This can help traders to easily identify trends and patterns.
👉Warning Lines: The script includes warning lines at +600 and -600 levels. These lines can be used as potential thresholds for trading decisions.
Usage:
To use this script, simply add it to your TradingView chart. The script will automatically calculate the ROC% for QQQ and QQEW and plot the spread on the chart. You can use this information to inform your trading decisions.
🚨 Disclaimer:
This script is provided for educational purposes only and is not intended as investment advice. Trading involves risk and is not suitable for all investors. Please consult with a financial advisor before making any investment decisions.
🎖️ Credits:
This script is based on the research conducted by Ned Davis Research (NDR). All credit for the underlying methodology and concept goes to NDR.

Yesterday’s High Breakout - Trend Following StrategyYesterday’s High Breakout it is a trading system based on the analysis of yesterday's highs, it works in trend-following mode therefore it opens a long position at the breakout of yesterday's highs even if they occur several times in one day.
There are several methods for exiting a trade, each with its own unique strategy. The first method involves setting Take-Profit and Stop-Loss percentages, while the second utilizes a trailing-stop with a specified offset value. The third method calls for a conditional exit when the candle closes below a reference EMA.
Additionally, operational filters can be applied based on the volatility of the currency pair, such as calculating the percentage change from the opening or incorporating a gap to the previous day's high levels. These filters help to anticipate or delay entry into the market, mitigating the risk of false breakouts.
In the specific case of NULS, a 9% Take-Profit and a 3% Stop-Loss were set, with an activated trailing-stop percentage. To postpone entry and avoid false breakouts, a 1% gap was added to the price of yesterday's highs.
Name : Yesterday's High Breakout - Trend Follower Strategy
Author : @tumiza999
Category : Trend Follower, Breakout of Yesterday's High.
Operating mode : Spot or Futures (only long).
Trade duration : Intraday.
Timeframe : 30M, 1H, 2H, 4H
Market : Crypto
Suggested usage : Short-term trading, when the market is in trend and it is showing high volatility.
Entry : When there is a breakout of Yesterday's High.
Exit : Profit target or Trailing stop, Stop loss or Crossunder EMA.
Configuration :
- Gap to anticipate or postpone the entry before or after the identified level
- Rate of Change for Entry Condition
- Take Profit, Stop Loss and Trailing Stop
- EMA length
Backtesting :
⁃ Exchange: BINANCE
⁃ Pair: NULSUSDT
⁃ Timeframe: 2H
⁃ Fee: 0.075%
⁃ Slippage: 1
- Initial Capital: 10000 USDT
- Position sizing: 10% of Equity
- Start : 2018-07-26 (Out Of Sample from 2022-12-23)
- Bar magnifier: on
Credits : LucF for Pine Coders (f_security function to avoid repainting using security)
Disclaimer : Risk Management is crucial, so adjust stop loss to your comfort level. A tight stop loss can help minimise potential losses. Use at your own risk.
How you or we can improve? Source code is open so share your ideas!
Leave a comment and smash the boost button!
Thanks for your attention, happy to support the TradingView community.

RSI-ROC Momentum AlertThis is the RSI-ROC Momentum Alert trading indicator, designed to help traders identify potential buy and sell signals based on the momentum of price movements.
The indicator is based on two technical indicators: the Rate of Change (ROC) and the Relative Strength Index (RSI). The ROC measures the speed of price changes over a given period, while the RSI measures the strength of price movements. By combining these two indicators, this trading indicator aims to provide a comprehensive view of the market momentum.
An RSI below its oversold level, which shows as a green background, in addition to a ROC crossing above its moving average (turns green) signals a buying opportunity.
An RSI above its overbought level, which shows as a red background, in addition to a ROC crossing below its moving average (turns red) signals a selling opportunity.
Traders can use this indicator to identify potential momentum shifts and adjust their trading strategies accordingly.
The ROC component of the indicator uses a user-defined length parameter to calculate the ROC and a simple moving average (SMA) of the ROC. The color of the ROC line changes to green when it is above the ROC SMA and to red when it is below the ROC SMA. The ROC SMA color changes whether it's above or below a value of 0.
The RSI component of the indicator uses a user-defined length parameter to calculate the RSI, and user-defined RSI Low and RSI High values to identify potential buy and sell signals. When the RSI falls below the RSI Low value, a green background color is applied to the chart to indicate a potential buy signal. Conversely, when the RSI rises above the RSI High value, a red background color is applied to the chart to indicate a potential sell signal.
This indicator is intended to be used on any time frame and any asset, and can be customized at will.

Typical Price Difference - TPD © with reversal zones and signalsv1.0 NOTE: The maths have been tested only for BTC and weekly time frame.
This is a concept that I came through after long long hours of VWAP trading and scalping.
The idea is pretty simple:
1) Typical Price is calculated by (h+l+c) / 3. If we take this price and adjust it to volume we get the VWAP value. The difference between this value and the close value, i call it " Typical Price Difference - TPD ".
2) We get the Historical Volatility as calculated by TradingView script and we add it up to TPD and divide it by two (average). This is what I call " The Source - TS ".
3) We apply the CCI formula to TS .
4) We calculate the Rate of Change (roc) of the CCI formula.
5) We apply the VIX FIX of Larry Williams (script used is from ChrisMoody - CM_Williams_Vix_Fix Finds Market Bottoms) *brilliant script!!!
How to use it:
a) When the (3) is over the TPD we have a bullish bias (green area). When it's under we have a bearish bias (red area).
b) If the (1) value goes over or under a certain value (CAUTION!!! it varies in different assets or timeframes) we get a Reversal Zone (RZ). Red/Green background.
c) If we are in a RZ and the VIX FIX gives a strong value (look for green bars in histogram) and roc (4) goes in the opposite direction, we get a reversal signal that works for the next week(s).
I applied this to BTC on a weekly time frame and after some corrections, it gives pretty good reversal zones and signals. Especially bottoms. Also look for divergences in the zones/signals.
As I said I have tested and confirmed it only on BTC/weekly. I need more time with the maths and pine to automatically adjust it to other time frames. You can play with it in different assets or time frames to find best settings by hand.
Feel free to share your thoughts or ideas on this.
P.S. I realy realy realy try to remember when or how or why I came up with the idea to combine typical price with historical volatility and CCI. I can't! It doesn't make any sense LOL

ROC (Rate of Change) Refurbished▮ Introduction
The Rate of Change indicator (ROC) is a momentum oscillator.
It was first introduced in the early 1970s by the American technical analyst Welles Wilder.
It calculates the percentage change in price between periods.
ROC takes the current price and compares it to a price 'n' periods (user defined) ago.
The calculated value is then plotted and fluctuates above and below a Zero Line.
A technical analyst may use ROC for:
- trend identification;
- identifying overbought and oversold conditions.
Even though ROC is an oscillator, it is not bounded to a set range.
The reason for this is that there is no limit to how far a security can advance in price but of course there is a limit to how far it can decline.
If price goes to $0, then it obviously will not decline any further.
Because of this, ROC can sometimes appear to be unbalanced.
(TradingView)
▮ Improvements
The following features were added:
1. Eight moving averages for the indicator;
2. Dynamic Zones;
3. Rules for coloring bars/candles.
▮ Motivation
Averages have been added to improve trend identification.
For finer tuning, you can choose the type of averages.
You can hide them if you don't need them.
The Dynamic Zones has been added to make it easier to identify overbought/oversold regions.
Unlike other oscillators like the RSI for example, the ROC does not have a predetermined range of oscillations.
Therefore, a fixed line that defines an overbought/oversold range becomes unfeasible.
It is in this matter that the Dynamic Zone helps.
It dynamically adjusts as the indicator oscillates.
▮ About Dynamic Zones
'Most indicators use a fixed zone for buy and sell signals.
Here's a concept based on zones that are responsive to the past levels of the indicator.'
The concept of Dynamic Zones was described by Leo Zamansky (Ph.D.) and David Stendahl, in the magazine of Stocks & Commodities V15:7 (306-310).
Basically, a statistical calculation is made to define the extreme levels, delimiting a possible overbought/oversold region.
Given user-defined probabilities, the percentile is calculated using the method of Nearest Rank.
It is calculated by taking the difference between the data point and the number of data points below it, then dividing by the total number of data points in the set.
The result is expressed as a percentage.
This provides a measure of how a particular value compares to other values in a data set, identifying outliers or values that are significantly higher or lower than the rest of the data.
▮ Thanks and Credits
- TradingView: for ROC and Moving Averages
- allanster: for Dynamic Zones
