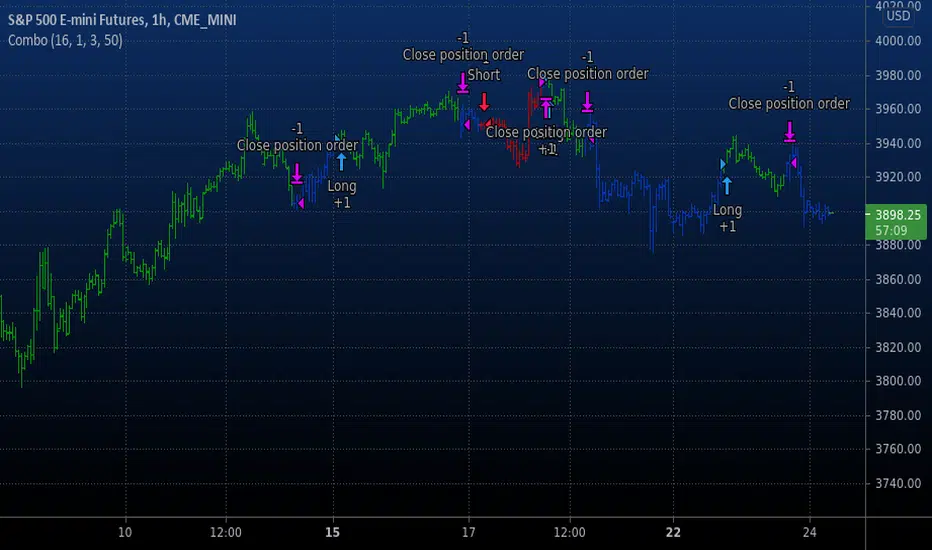
Combo Backtest 123 Reversal & MovROC (KST indicator) This is combo strategies for get a cumulative signal.
First strategy
This System was created from the Book "How I Tripled My Money In The
Futures Market" by Ulf Jensen, Page 183. This is reverse type of strategies.
The strategy buys at market, if close price is higher than the previous close
during 2 days and the meaning of 9-days Stochastic Slow Oscillator is lower than 50.
The strategy sells at market, if close price is lower than the previous close price
during 2 days and the meaning of 9-days Stochastic Fast Oscillator is higher than 50.
Second strategy
This indicator really is the KST indicator presented by Martin Pring.
the KST indicator is a weighted summed rate of change oscillator that
is designed to identify meaningful turns. Various smoothed rate of change
indicators can be combined to form different measurements of cycles.
WARNING:
- For purpose educate only
- This script to change bars colors.
ROC
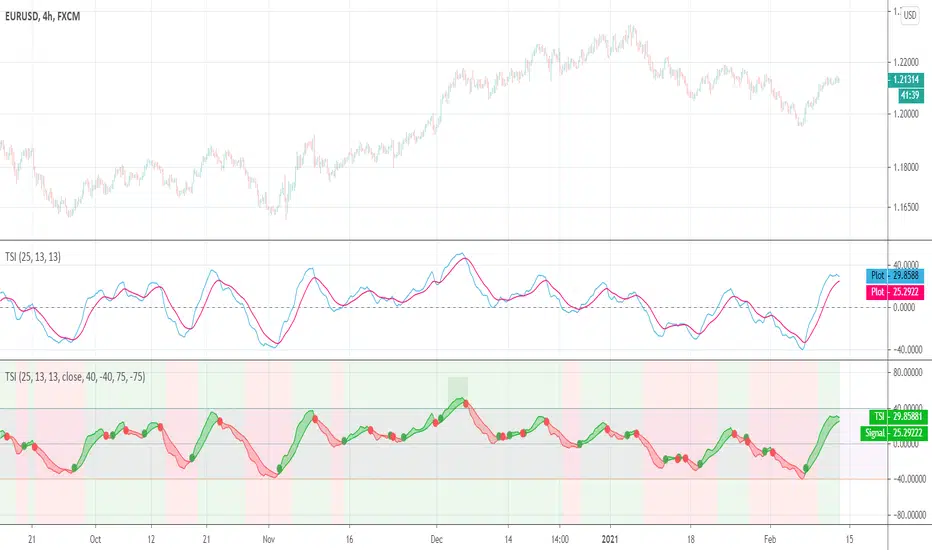
True Strength Index (TSI)User request. A tuned version of the built-in True Strength Index (TSI) indicator with the following options included:
TSI - Signal Histogram
TSI/Signal Crossovers
TSI/Signal Ribbon
Bands breakouts highlighting
Zero line crossovers background
RS.ROC | Relative Strength - Rate of Changes - 4CR CUPFor completeness of Relative Strength studies, the Relative Strength based on rate of changes (ROC) with weighting is coded and presented as well.
The RS.ROC is similar to the formulation of RS by IBD before rank among all the stocks in the market.
The lookback period is relaxed for customizing. Once you set the total lookback period, representing the 4Q, in the indicator, the other shorter lookback periods will be auto-calculated, namely, 1Q, 2Q, 3Q.
A simple moving average of the RS.ROC is also added for your easier analysis on the trend development of the strength.
To use it later at your charting later,
1. Favorite it;
2. Select from your favorite list.

MA Streak Change ChannelChange Channel is like KC unless it uses percentage changes in price to set channel distance. Midline is zero-lag smoothed ROC with dynamic period based on MA Streak indicator, if MA Streak shows an ongoing trend, midline going strong and break out the channel.
Consider using ▲ green areas as a signal to buy and ▼ red areas as a sell signal. It works best in a flat market. Use in combination with other indicators.

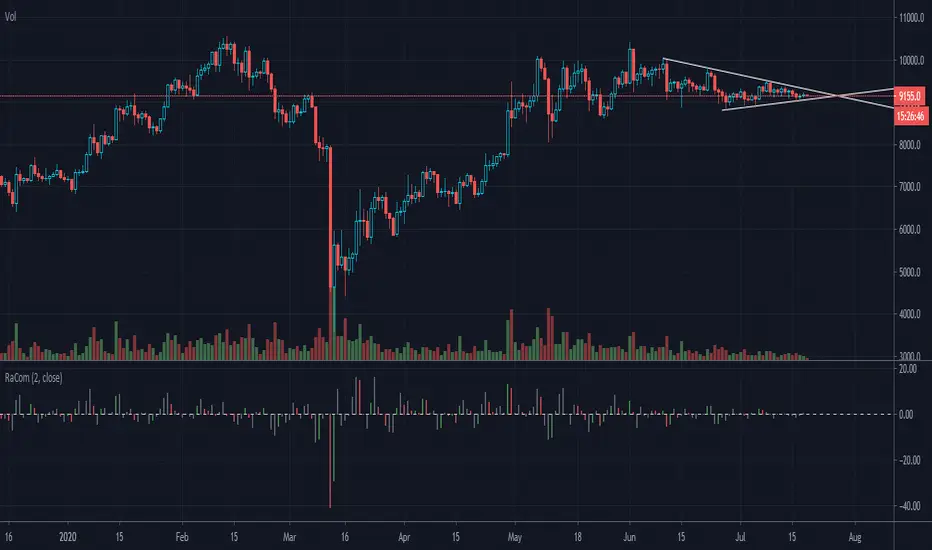
Indicator: Raschke Compase [xQT5]This is an indicator from a book "Street Smarts—High Probability Short Term Trading Strategies" by L. Raschke & L.Connors.
I made it in histogram style for more comfortable reading chart:
- green histogram is buy signal or buy opportunity;
- red histogram is sell signal or sell opportunity;
- gray histogram is forward moving from last signal.
Enjoy it!
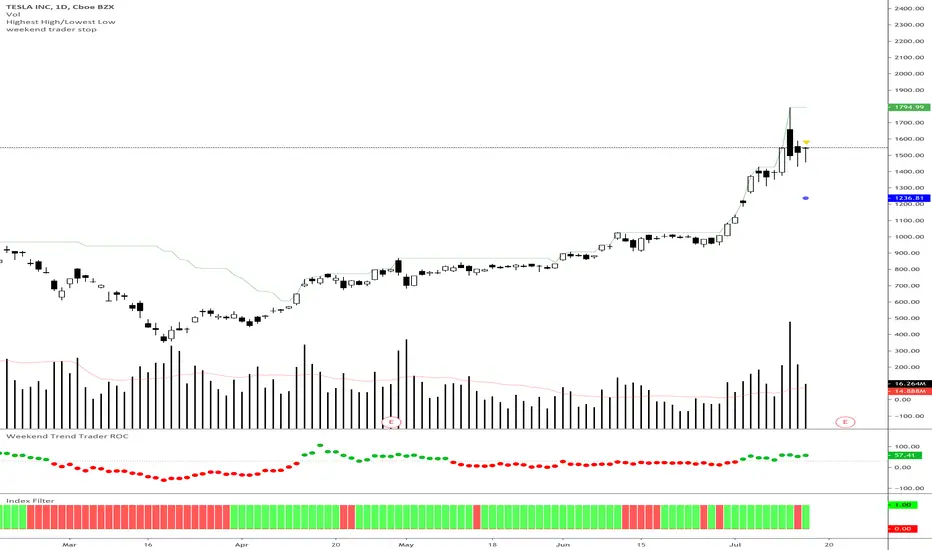
Weekend Trader Smoothed Rate of Change
Rate of change indicator based on Nick Radge's Weekend Trend Trader Strategy, with an added extra of EMA smoothing if you want it.
This indicator simply turns green when the rate of change is above a certain level (value is set in threshold)
Threshold is defaulted to 30 as outlined in the strategy rules
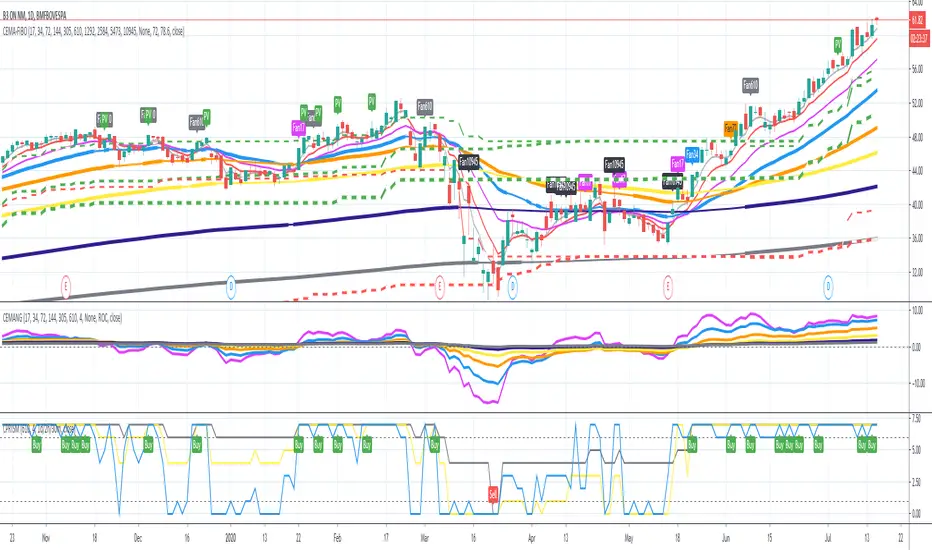
Super EMA PrismThis script implements the Binary Trade Logic (BTL) algorithm to calculate two distinct scores that range from 0 to 7. One score is calculated assigning a power of 2 weight to the positive sign of 3 Phi^3 distant Moving Average (MA) slopes. The other score is calculated assigning a power of 2 weight to the sign of the difference between the price and the value of 3 Phi^3 distant Moving Average (MA).
For the first score, hereafter called as the angle score (AS), the largest MA slope positive sign receives weight 4, the middle length MA slope positive sign receives weight 2 and the shortest MA slope positive sign receives weight 1. The positive sign of an MA is defined as 1 if the slope of the MA is positive and 0, otherwise. Therefore, for MAs 305, 72 and 17, if slope(MA305) > 0, slope(MA72) < 0 and slope(MA17) > 0, then score will be 4*1 + 2*0 + 1*1 = 5. Up to my knowledge, this score was first proposed by Bo Williams and named by him as Prisma.
For the second score, hereafter called as the value score (VS), if the price > largest MA, it receives weight 4. If the price > the middle length MA, it receives weight 2 and if the price > the the shortest MA, it receives weight 1. Therefore, for MAs 305, 72 and 17, if price < MA305, price > MA72 and price > MA17, then score will be 4*0 + 2*1 + 1*1 = 3. Up to my knowledge, this score was first proposed by Bo Williams and named by him as Prisma.
Both AS and VS are calculated for Phi^3 lengths (610, 144, 34) and for Phi^3/2 lengths (305, 72, 17). The scores of the same kind calculated for each set of length are combined multiplying the Phi^3 length score by 10 and adding with with the Phi^3/2 score, therefore providing a 2 digit score ranging from 0 to 77. For instance, if we have AS(610, 144, 34) = 7 and AS(305, 72, 17) = 5, we have AS=75. At the same time, if we have VS(610, 144, 34) = 6 and VS(305, 72, 17) = 4, we have VS=64.
VS score is plotted by default in black, but it can be on white for dark themes. AS is plotted with the color of the longest MA used.
Chart background is colored according to the range of values for AS and VS, checked in the following order:
if AS >= 13 and VS <= 13 then back color = red
if AS >= 13 or VS <= 13 then back color = orange
if AS >= 64 and VS >= 64 then back color = green
if AS >= 64 or VS >= 64 then back color = blue
otherwise back color = none (white o black)

Custom EMA PrismThis script implements the Binary Logic Trading (BLT) algorithm to calculate a score from 0 to 7. This score is calculated assigning a power of 2 weight to the positive sign of 3 Phi^3 distant EMAs' slopes. The largest EMA slope positive sign receives weight 4, the middle length EMA slope positive sign receives weight 2 and the shortest EMA slope positive sign receives weight 1. The positive sign of an EMA is defined as 1 if the slope of the EMA is positive and 0, otherwise. Therefore, for EMAs 305, 72 and 17, if slope(EMA305) > 0, slope(EMA72) < 0 and slope(EMA17) > 0, then score will be 4*1 + 2*0 + 1*1 = 5. Up to my knowledge, this score was first proposed by Bo Williams and named by him as Prisma.
Due too sampling issues, this script ONLY WORKS with graphic time of 1d. I would like to thanks to MrBitmanBob for showing me how to get quotations from a graphic time distinct from the current one.
This script also gets sampling data from graphic times 2h and 30m to calculate their score. As, even for smaller graphic times, price data is sampled at the current time frequency, the EMA lengths for those smaller graphic times needed to be proportionally decreased, meaning that when calculating the score for 1d with lengths 305, 72 and 17, the score for 2h must be calculated with lengths 72, 17 and 4, and the score for 30m must be calculated with lengths 17, 4 an 1. I understand that some precision may be lost but it is the best that is possible.
There is an optional setting for Crypto Currencies that instead of calculating the score for 1d, 2h and 30m, it calculates the score for 1d, 4h and 60m. This is due to the fact that Crypto Currencies are traded 24x7. Despite of this setting, the labels at the Style tab of the settings window remains 2h and 30m, because they must be constants.
This script with the corresponding EMAs chart and the EMAs Angle chart provides a broader view of the trading scenario.
Custom EMA AngleThis script shows the angle of 6 EMAs to perform trade analysis. The EMA angle is also known as its Rate Of Change ( ROC ). The 6 EMAs (I, II, III , IV, V and VI ) default lengthes come from one of the Fibonacci Phi^3 and Phi^3/2 sub series (17, 34, 72, 144, 305 and 610), but can be changed to any values, particularly to the traditionally used 20, 40, 50, 100, 200 and 300. Up to my knowledge, Fibonacci Phi^3 and Phi^3/2 sub series lengthes were first proposed by Bo Williams.
Angle calculation is performed by calculating the tangent over a delta interval. Normalization is required to make the angle independent of the price range.
This script is meant to be used together with the corresponding EMAs on the candle pane. Non normalized view shows a more realistic angle condition but, if intended to be used with the CEMAS indicator, normalized view should be used.

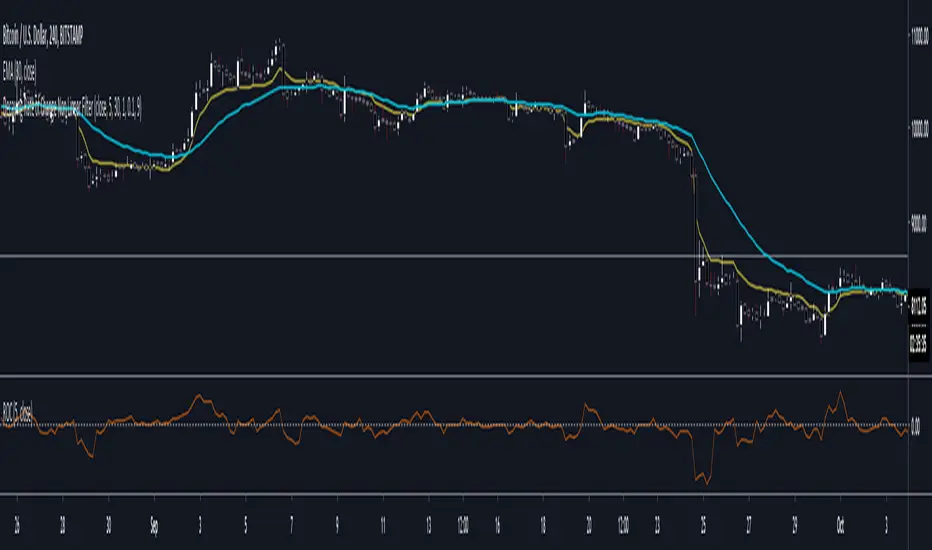
GMS: TSI Indicator (ROC)This is based on the original TSI Indicator that's already built in.
The PC is originally taken as the change between the current price - the previous price. I substituted that with Rate of Change. Using a 1 period ROC it's quite similar to the TSI Indicator and increasing the length results in a smoother TSI.
I hope it helps,
Andre
Percent Change MtFThis plots the selected resolution's percent change from open to close. Easy way to check the previous period's range with less noise. Note the latest period is calculating on a bar that hasn't closed so it won't update unless you refresh/change timeframes to prevent incorrect reporting.

BlueswimmerdoespineSharing to learn and to help others.
Any feedback on layout/structure/shortcuts will always be appreciated.
Simple indicator for close of candle above or below EMA with ROC and CO acting as a filter.

Rate Of Change Earnings Move - ROCEMRate Of Change Earnings Move
What is it and how does it work?
The Rate of Change Earnings Move indicator or ROCEM is an indicator designed for giving the user an idea of how much a stock has moved up or down in past earnings reports. This is ideal for options traders who can use ROCEM to calculate whether or not their long straddles are actually probable of happening.
How it works
The indicator measures the absolute value rate of change and then calculates the average rate of change for the day of the earnings report for the past 8 earnings reports (2 years). It then takes the current stock price and finds the upper and lower price based on the average rate of change for past earnings.
I have also included a moving average (purple line), use this to see if the current rate of change is higher than usual.
Additionally, earnings reports are marked with a red x on the indicator.
How to trade ROCEM
This is primarily made for options trading so I will be explaining how it can be used for that. It is not suited for traditional stock trading as it does not determine a market direction.
Select a stock with an upcoming earnings
Enter your per leg commissions in the indicator if you want it to calculate new upper and lower prices (makes it easier to determine if the options trade will pass the breakeven when commissions are factored in)
Compare your long straddle breakevens with the upper and lower prices of the indicator. If the upper breakeven is smaller than the upper price in ROCEM and the lower breakeven is larger than the lower price in ROCEM, then a long straddle position could be considered a reasonable trade based on past earnings performance.

Decaying Rate of Change Non Linear FilterThis is a potential solution to dealing with the inherent lag in most filters especially with instruments such as BTC and the effects of long periods of low volatility followed by massive volatility spikes as well as whipsaws/barts etc.
We can try and solve these issues in a number of ways, adaptive lengths, dynamic weighting etc. This filter uses a non linear weighting combined with an exponential decay rate.
With the non linear weighting the filter can become very responsive to sudden volatility spikes. We can use a short length absolute rate of change as a method to improve weighting of relative high volatility.
c1 = abs(close - close ) / close
Which gives us a fairly simple filter :
filter = sum(c1 * close,periods) / sum(c1,periods)
At this point if we want to control the relative magnitude of the ROC coefficients we can do so by raising it to a power.
c2 = pow(c1, x)
Where x approaches zero the coefficient approaches 1 or a linear filter. At x = 1 we have an unmodified coefficient and higher values increase the relative magnitude of the response. As an extreme example with x = 10 we effectively isolate the highest ROC candle within the window (which has some novel support resistance horizontals as those closes are often important). This controls the degree of responsiveness, so we can magnify the responsiveness, but with the trade off of overshoot/persistence.
So now we have the problem whereby that a highly weighted data point from a high volatility event persists within the filter window. And to a possibly extreme degree, if a reversal occurs we get a potentially large "overshoot" and in a way actually induced a large amount of lag for future price action.
This filter compensates for this effect by exponentially decaying the abs(ROC) coefficient over time, so as a high volatility event passes through the filter window it receives exponentially less weighting allowing more recent prices to receive a higher relative weighting than they would have.
c3 = c2 * pow(1 - percent_decay, periods_back)
This is somewhat similar to an EMA, however with an EMA being recursive that event will persist forever (to some degree) in the calculation. Here we are using a fixed window, so once the event is behind the window it's completely removed from the calculation
I've added Ehler's Super Smoother as an optional smoothing function as some highly non linear settings benefit from smoothing. I can't remember where I got the original SS code snippet, so if you recognize it as yours msg me and I'll link you here.
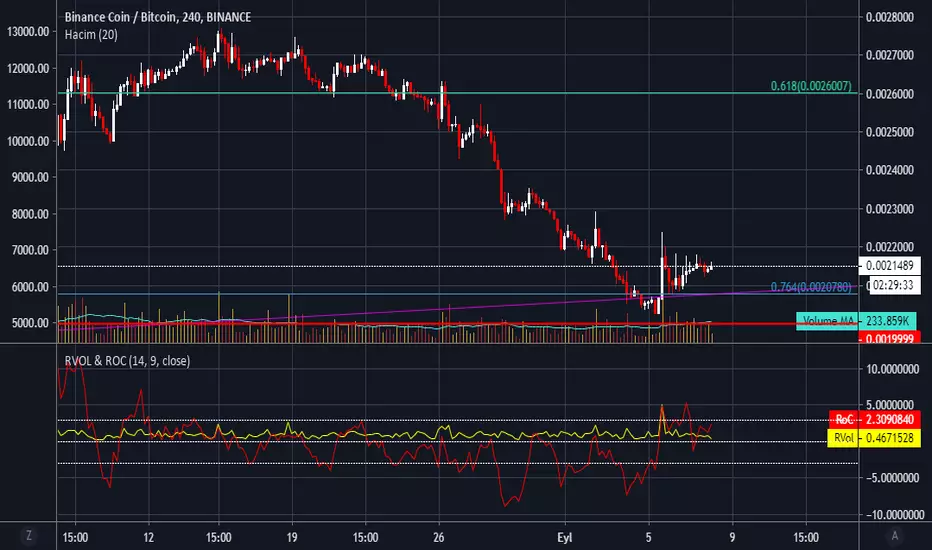
RVol & RoC - Relative Volume & Rate of Change by haciyatmazRelative Volume ( RVol ) is a critical measure of volume flows. It measures current volume in relation to the "usual" volume for this time of the day.
Rate of Change ( RoC ) is a momentum-based technical indicator that measures the percentage change in price between the current price and the price a certain number of periods ago.

Function To Candles - Another way to see indicatorsIntroduction
There are different and better way's to see price data, a candlestick chart is one of the best way to see the price since you have access to the open/high/low/close information, this is really efficient and can allow for naked non parametric trading strategies (candlesticks patterns) . But what about making candles out of indicators ? There are tons of studies about candlesticks patterns in price data but none (?) about candlestick patterns using indicator data, therefore i made this script in order to show candles from various indicators, i also made an heikin-ashi mode.
Rsi To Candles
All the indicators are use the open/high/low/close price as input in order to return candles. length control the indicator period.
Stochastic To Candles
The stochastic oscillator is restrained in a range of 0/100, therefore when equal to 0 or 100 the candles can be flat.
Rate Of Change To Candles
The rate of change don't distort price as heavily as other indicators since its based on differencing.
Center Of Gravity To Candles
The center of gravity (cog) is defined from tradingview as "an indicator based on statistics and the Fibonacci golden ratio", its not an indicator i'am familiar with and i don't know if its the same proposed by Elhers. The candles are smooth, high length can flatten the candles heavily making them hard to see.
Correlation Oscillator
In a range of -1/1 this indicator is quite smooth and can also flatten candles.
Patterns And Heikin-Ashi
There are tons of patterns that can be generated from candlesticks, they can be applied to this indicator as well.
The indicator can show an heikin-ashi mode, heikin-ashi candlestick use averaging to plot candles, this is why they appear smoother, some signals generated from heikin-ashi candles are :
Bullish body with no lower shadows = Strong Uptrend
Bearish body with no higher shadows = Strong Downtrend
High range and small body = Indecision/Risk of reversal
Conclusion
I made an indicator able to draw candles from other indicators, those candles contain various information that can generate decision from patterns. I hope you find a use to it, if its the case share your findings with me, maybe that you will even be able find a new candlestick pattern :)
Thanks for reading !

ROC Divergence — SharkCIAThis script helps to identify ROC pivot points and aims to show you when the trend has changed direction.

Positive Volume IndexHello traders!
This indicator was originally developed by Paul L. Dysart in the 1930s and then described and popularized by Norman G. Fosback in his book "Stock Market Logic: A Sophisticated Approach to Profits on Wall Street"
Like and follow for more cool indicators!
Happy Trading!

[RESEARCH] Rate of ChangeHello traders and developers!
I was wondering how built-in "roc" function in Pine is defined and calculated so I made a little research.
I examined 4 samples:
1) "roc" function itself
2) "roc" according to its description
3) price change ratio
4) price percent change ratio
The results of the first and fourth samples are identical.
So, TV built-in roc(source, length) = 100 * change(source, length) / source .
And it's description is incorrect.
If you didnt know it - now you know it.
Good luck!

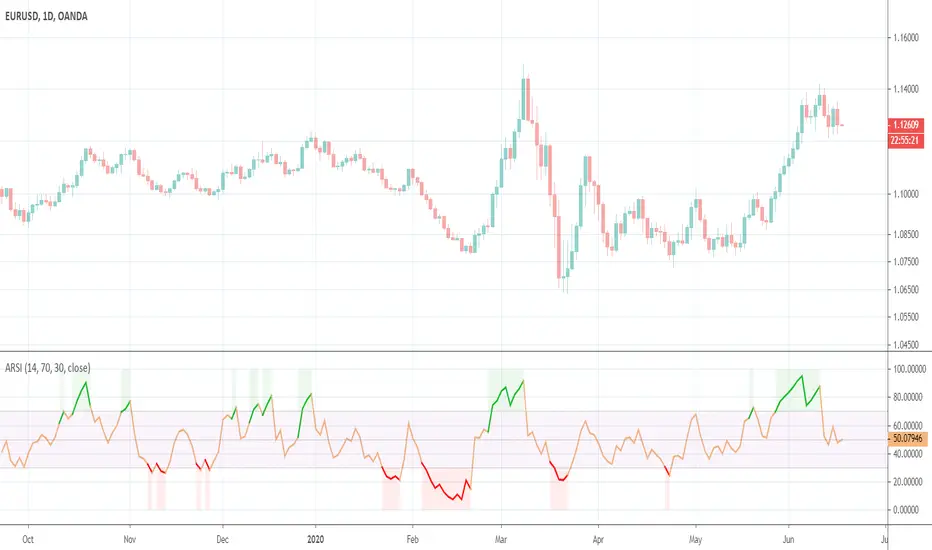
Asymmetrical RSIThis indicator was originally developed by Sylvain Vervoort (Stocks & Commodities, V.26:11 (October, 2008): "ARSI, The Asymmetrical RSI").
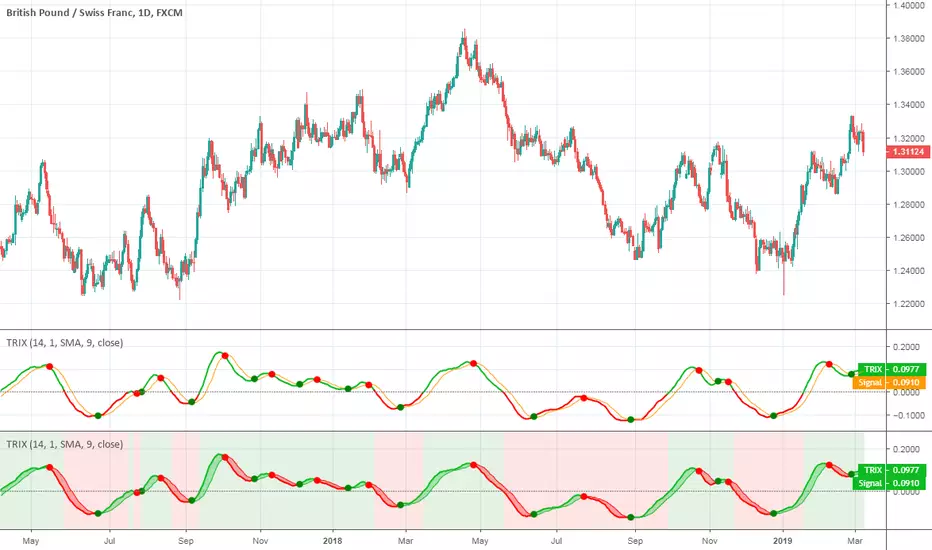
TRIXThis indicator was originally developed by Jack K. Hutson (Stocks & Commodities (July 1983): "Good TRIX").
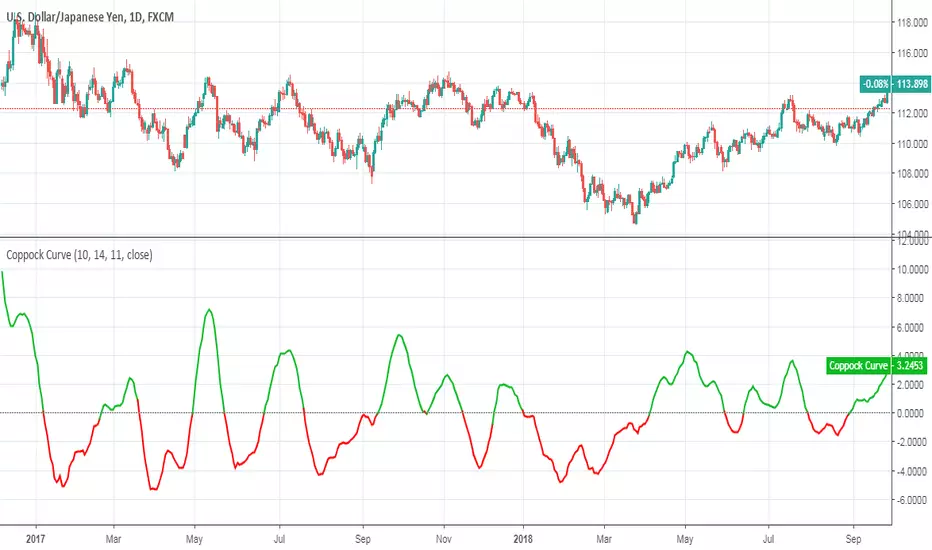
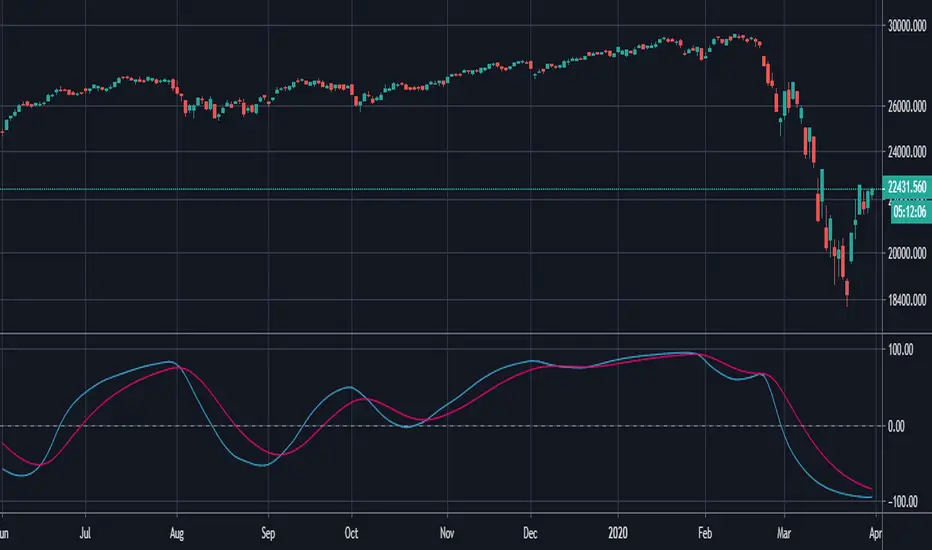
Coppock CurveThis indicator was originally developed by Edwin "Sedge" Coppock (Barron's Magazine, October 1962).
Specially for @AlexMayorov :
1) Buy when indicator crosses the zero line upside
2) Sell when indicator crosses the zero line downside