Relative Strength Index - Divergences - LibertusHello all,
To ease everyone's trading experience I made this script which colors RSI overbought and oversold conditions and as a bonus displays bullish or bearish divergences in last 50 candles (by default, you can change it).
Script is open source, part of code is from Trading View examples. If you have suggestions or you already made some improvements, please report in comment.
Happy trading and good luck!
Rsi_divergence

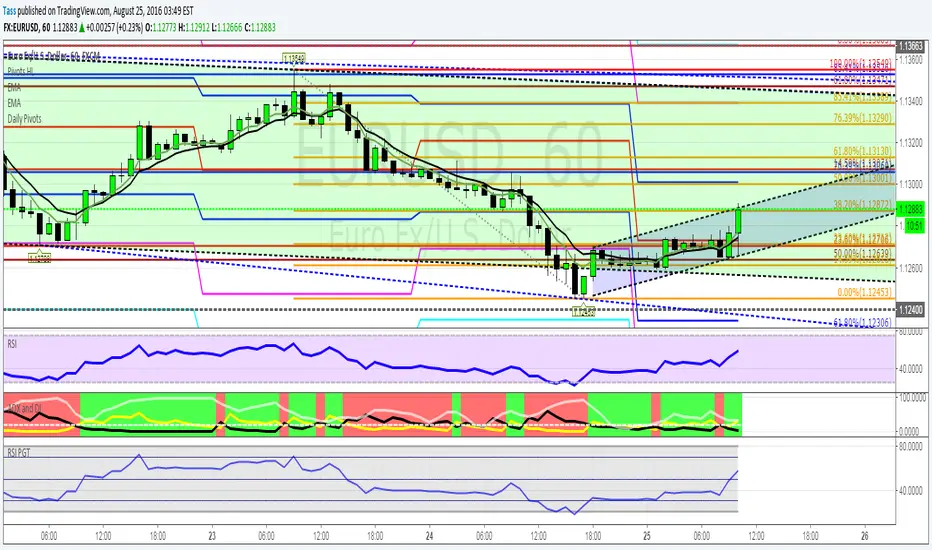
RSI/MFI - MTF - Entry signals/Trend colored bars - JD@version=2
This indicator is designed to give early entry signals as well as to follow trend moves, according to different settings.
The indicator shows a histogram of the RSI ro MFI in relation to an ema of the RSI or MFI.
The histogram is then smoothed to give early reversal/entry signals.
The actual RSI/MFI line with oversold/overbought indication can be displayed or omitted, as preferred.
in addition to the RSI/MFI line or as an alternative to it, the background colour can be set to change folowing the RSI/MFI signals.
The timeframe can be chosen. Higher timeframes (eg. 3h) tend to give less false signals.
version 5.
added support for custom Multiple Time Frame selection.
added option for choice of RSI or MFI as base indicator.
added option for price bar coloring according to the indicator. (deselecting "borders" in the "style" tab is recommended)
price bar coloring can be adjusted for different strategies:
1. following the slope of the histogram (for faster entry/exit signals)
2. according to positive or negative histogram (for longer moves)
3. according to pos. or neg. RSI/MFI (for longer term trend holds)
4. uptrend: biased towards faster buy signals and slower sell signals to stay in the uptrend
5. downtrend: biased towards faster sell signals and slower buy signals to stay in the downtrend
A longer timeframe (eg. 3x) is recommended for following trend moves.
try different strategies to see what works better for RSI or MFI.
JD.

RSI Swing SignalThis indicator is a tool designed to be used with Steven Hart's RSI Exhaustion strategy. For more information google TheTradingChannel or look him up on YouTube :)
The default RSI settings for this strategy are:
RSI Overbought: 80
RSI Oversold: 20
Length: 7
When the RSI gets above 80, the line will turn red and the script will begin looking for a specific type of engulfing candle to go short. The same is true when the RSI gets below 20, but the line will turn green and look for longs. It is best used as a back-testing aid, but it can also be used to send emails or SMS alerts whenever the conditions are met. It can also be used as an alternative colored RSI indicator by removing the signals in the settings menu and changing the RSI parameters to whatever you normally use. This can aid in RSI divergence and overbought/sold strategies.
Entries:
The bright green and bright red lines represent the first type of engulfing candle.
The dark green and red lines represent the second type of engulfing candle.
Some pairs perform best with only one of these entries, while others work fine with both.
This is a counter-trend or consolidation strategy, and is best used in combination with trend-continuation or trend-following strategies. As always, make sure you back-test it before you use it to trade as it works better on some pairs than others.


RSI-Histo-Entry_JDThis indicator shows a histogram of the RSI in relation to an ema of the RSI.
The histogram is then smoothed to give early reversal/entry signals.
The actual RSI line with oversold/overbought indication can be displayed or omitted, as preferred.
In addiction to the RSI line or as an alternative to it, the background colour can be set to change folowing the RSI signals.
JD.

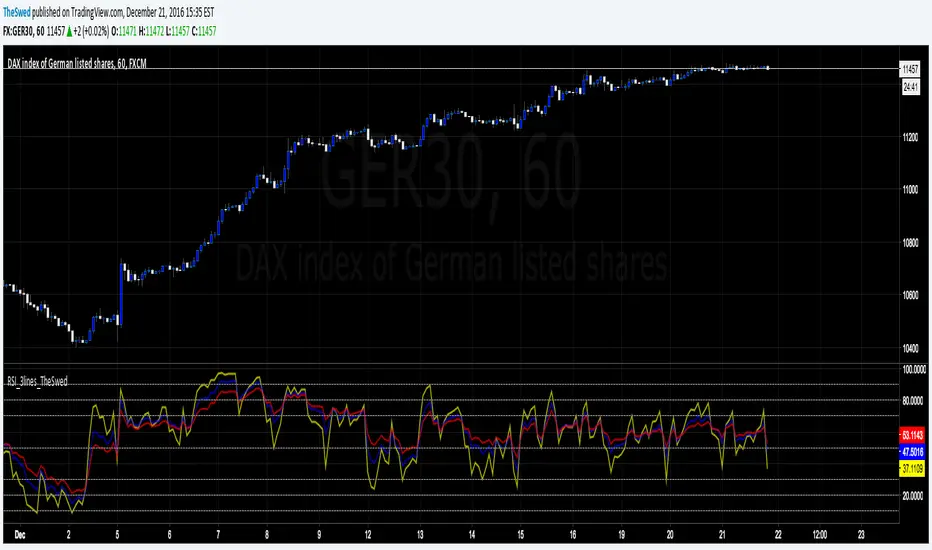
RSI_3lines_TheSwedRSI script with 3 lines. Also added lines: 90, 80, 20 and 10 to the script as I use this for trading.
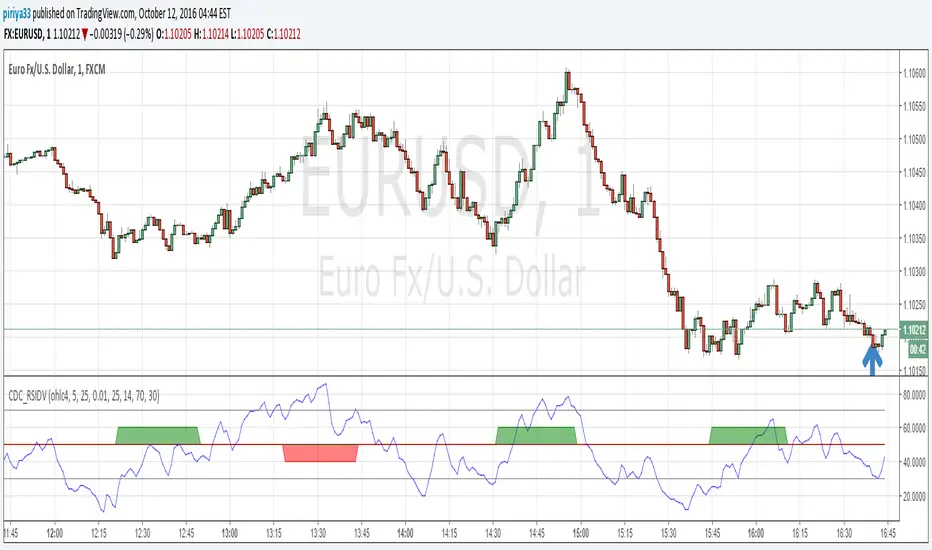
CDC RSI Divergence 15-10-2016An updated version of CDC RSI Divergence
The last version have fixed reversal amount to weed out false signal.
The reversal amount, however, needs to be calibrated to different chart.
The new one uses ATR instead, user can customize the ATR multiplier.
THIS IS NOT A TRADING SIGNAL SYSTEM
though it can be used in such a way it is not designed to.
The system helps identify Bullish and Bearish Divergence to help trader change their bias accordingly and should be used in conjunction with a trend following signal.
BULLISH DIVERGENCE is displayed with a green fill over 50 line.
BEARISH DIVERGENCE is displayed with a red fill under 50 line.
The indicator start on the bar where divergence is detected and persists for another 25 bars for easy regcognition.

CDC RSI DivergenceThis script alerts when a bullish or bearish divergence occurs.
The alert have minor repainting so do not use this as an entry / exit signal
but rather a guideline to be considered with other indicators. (MACD for example)
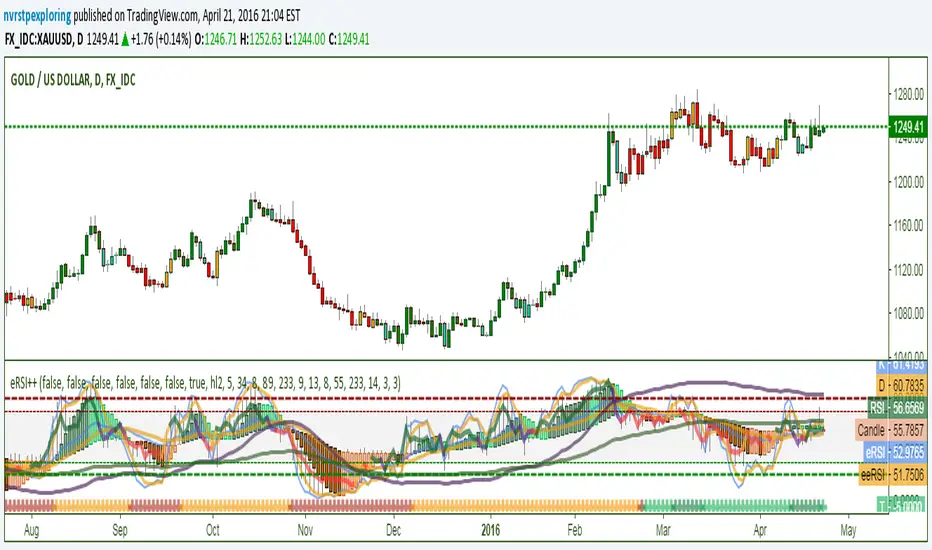
eRSI++Contains RSI; EMA of RSI; EMA of EMA of RSI; Stochastic Oscillator; 2 Inverse Fisher Transforms on RSI - IFRSI89 and IFRSI233 XOVER on higher timeframes from oversold/overbought is useful signal; RSI Trend/Divergence Candles with color variation based on multiple RSI length detection of trend decay; Chart candle overlay coloring based on RSI, eRSI, and eeRSI EMA55 & EMA233 Xover indicator on bottom for trend direction with color variations for counter trend movements.