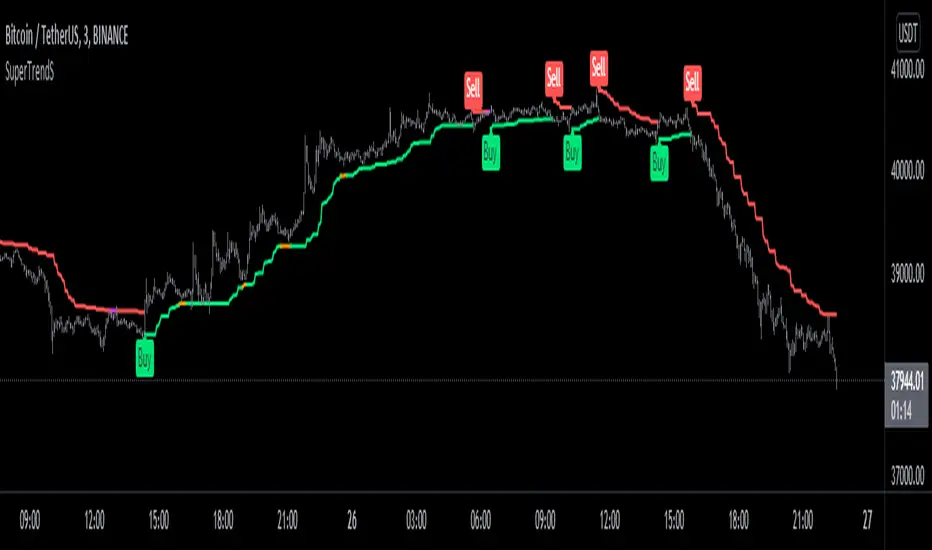
SuperTrendSHey! By using this script you can choose between the Regular SuperTrend and Pivot Point SuperTrend.
Pivot Point SuperTrend differs in calculation from the regular SuperTrend and as the name suggests, Pivot Points are used instead of ATR.
I made this script to make it easier to switch and compare between one another.
Also included Jurik RSX as a Momentum Indicator. SuperTrend changes color to purple when it's a bear trend and RSX is in an overbought state. And orange when it's a bull trend and RSX is in an oversold state. A reversal might be expected when color changes to purple & orange occur.
Special thanks to;
Kivanc Ozbilgic for SuperTrend
LonesomeTheBlue for Pivot Point SuperTrend
& everget for Jurik RSX
Enjoy!
RSX
KINSKI Multi RSI DivergenceThis extremely useful indicator combines several RSI variants (can be displayed simultaneously or alone) with many setting options. The RSI variants can also be displayed as an extra histogram, which provides additional valuable information. Furthermore, it is possible to set smoothing types, volume and stochastic based calculations for each variant.
Relative Strength Index (RSI)
The Relative Strength Index ( RSI ) is a momentum indicator that measures the extent of recent price changes to analyse overbought or oversold conditions. RSI values range from 0 to 100. In general, RSI divergence means that the RSI indicator is moving in the opposite direction compared to the price. So while the price is moving, the RSI is telling us in advance that we can expect a change in direction.
RSX Indicator
The RSX is the noise-free version of the more familiar RSI oscillator. Normally, any indicator can be smoothed by applying a moving average. However, a major disadvantage of such a method is that there is a time lag between the indicator and the price. The RSX indicator tries to do this without signal delay.
Money Flow Indicator (MFI)
The MFI is essentially the RSI with the added aspect of volume . Because of its close similarity to the RSI , the MFI can be used in very similar ways.
RSI Laguerre
The RSI Laguerre works in the same way as the classic RSI , but is more sensitive to recent prices. When it crosses the signal line at the value of 0.15 from the bottom to the top, a buy signal is created, while overbought markets have values of 0.75 or higher
Detection of divergences
The detection of divergences in the RSI is one of the most important functions of this indicator. The reason is that an divergence is a more reliable signal than the overbought and oversold indicators themselves. You get overbought and oversold signals all the time. However, the divergence is a rare event.
In general, divergence means that the RSI indicator is moving in the opposite direction compared to the price. So while the price is moving, the RSI is telling us in advance that we can expect a change in direction.
Positive divergence
A positive divergence is when the price trend has lower lows and lower highs, while the indicator does the opposite - higher highs and higher lows. The price continues to fall while the RSI indicator begins to rise.
Negative divergence
Negative divergence is the opposite of positive divergence. It applies to uptrends where the price reaches higher highs and higher lows. However, the RSI shows lower highs and lower lows - the price goes up but the RSI goes down. The price closes with higher highs and higher lows, while the indicator shows the opposite - lower lows and lower highs, confirming a negative divergence. As a result, there is a sharp decline in the price.
Have fun using and trying out this flexible indicator!

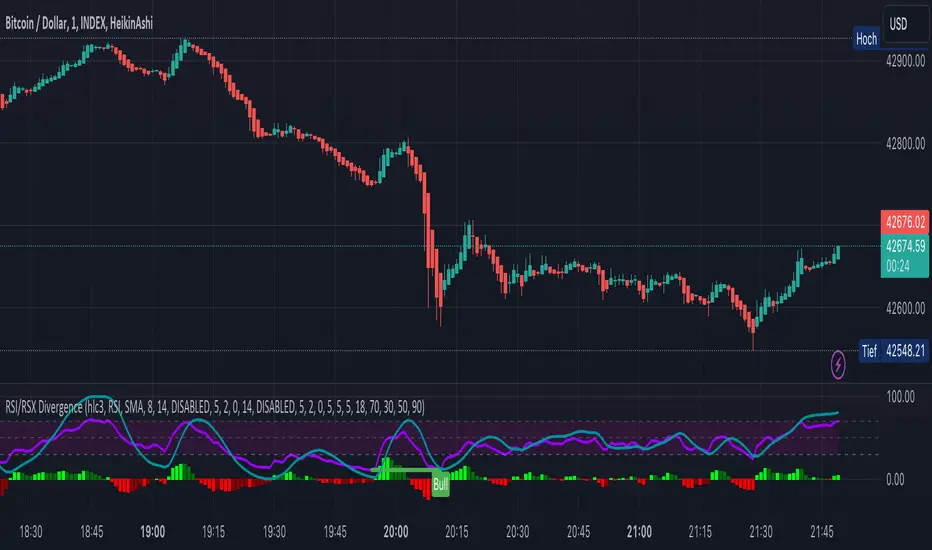
KINSKI RSI/RSX DivergenceThe Relative Strength Index (RSI) is a momentum indicator that measures the magnitude of recent price changes to analyse overbought or oversold conditions. RSI values range from 0 to 100.
The Relative Strength Index (RSI) is calculated using the following formula: RSI = 100 - 100 / (1 + RS) Where RS = average gain of upward phases during the specified time frame / average loss of downward phases during the specified time frame.
An asset price is considered overbought (due for a correction) if the RSI is above 70 and oversold (due for a recovery) if it is below 30. More extreme values (80/20) are also used to avoid false readings.
In a strong uptrend, the RSI often reaches 70 and above for long periods, and downtrends can remain at 30 or below for long periods.
Divergence detection in RSI is one of the important functions of this indicator. The reason is that an RSI divergence is a more reliable signal than the overbought and oversold indicators themselves. You will get overbought and oversold signals all the time. However, the divergence is a rare event.
In general, RSI divergence means that the RSI indicator is moving in the opposite direction compared to the price. So while the price is moving, the RSI is telling us in advance to expect a change in direction.
Positive RSI divergence
A positive RSI divergence is when the price trend has lower lows and lower highs, while the RSI indicator does the opposite - higher highs and higher lows. The price continues to fall while the RSI indicator begins to rise.
Negative RSI divergence
Negative RSI divergence is the opposite of positive divergence. It applies to uptrends where the price reaches higher highs and higher lows. However, the RSI shows lower highs and lower lows - the price goes up but the RSI goes down. The price closes with higher highs and higher lows, while the RSI indicator does the opposite - lower lows and lower highs, confirming a negative divergence. As a result, there is a sharp decline in the price.
RSX Indicator - Base script: SharkCIA by Jaggedsoft (Linked in the source code)
The RSX is the noise-free variant of the more popular RSI oscillator. Typically, any indicator can be smoothed by applying a moving average. However, a major disadvantage of such a method is that there is a time lag between the indicator and the price. RSX Indicator attempts to do this without signal delay.
What distinguishes this indicator from others of this type?
Display of RSI indicator together/alone with RSX and RSI smoothed
display of the RSI indicator (option: "RSI: On/Off")
display of the RSX indicator (option: "RSX: On/Off")
display of the RSI indicator as smoothed version (option: "RSI Smoothed: On/Off")
offers the possibility to choose between different view variants
many settings for additional information, layout and divergence identification
enables completely new comparison possibilities and insights with the additional RSI variants
Williams %R & RSI with Multiple PeriodsDESCRIPTION
1. Calculates %R and RSI with multiple period lengths.
1 period length value is defined by User.
8 period length values follow User's selection of classic number sequences, e.g. Fibonacci, Leonardo, Lucas, Narayana, etc.
2. User selects which indicator and periods to display or hide.
DEFAULTS
%R default custom period: 10.
RSI default custom period: 14.
%R & RSI default number sequence periods: Lucas numbers 11, 18, 29, 47, 76, 123, 199, 322.
CALCULATIONS
%R = (period high - most recent period's close price)/(period high - period low)
RSI = 100 - 1 / (100 + RS), where RS = SMMA(up, period) / SMMA(down, period)
PURPOSE
1. Identify price trends.
CREDITS
1. Williams %R technical analysis momentum oscillator by Larry Williams.
2. Wilder's Relative Strength Index technical analysis momentum oscillator by J. Welles Wilder.
3. "Solarized" color scheme by Ethan Schoonover.
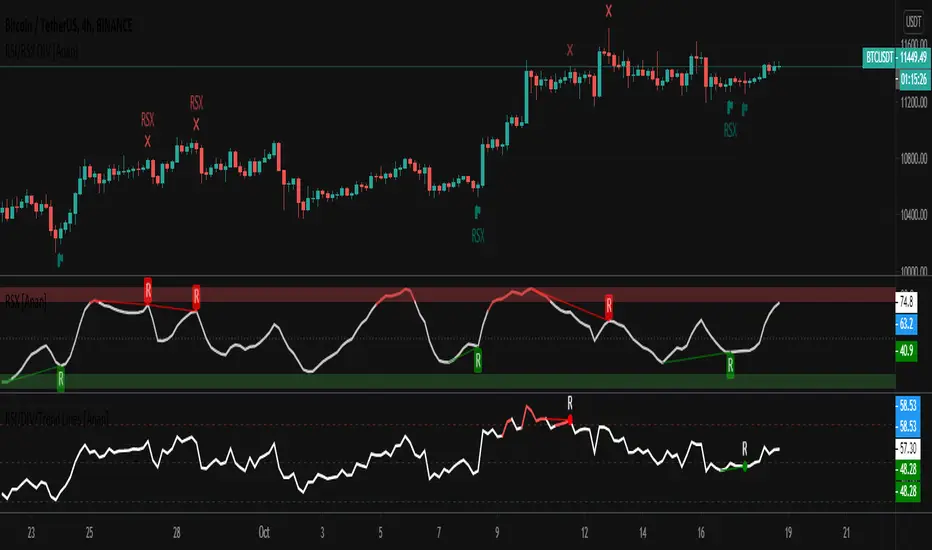
MTF Oscillators [Anan]Hello friends,
This is my own MTF oscillator framework verion.
You can control in everything from indicator settings suck as (Source, Length, OB/OS Zones, Show/Hide Timeframes and all Timeframes are supported).
List of supported oscillators:
RSX
RSI
MFI
CCI

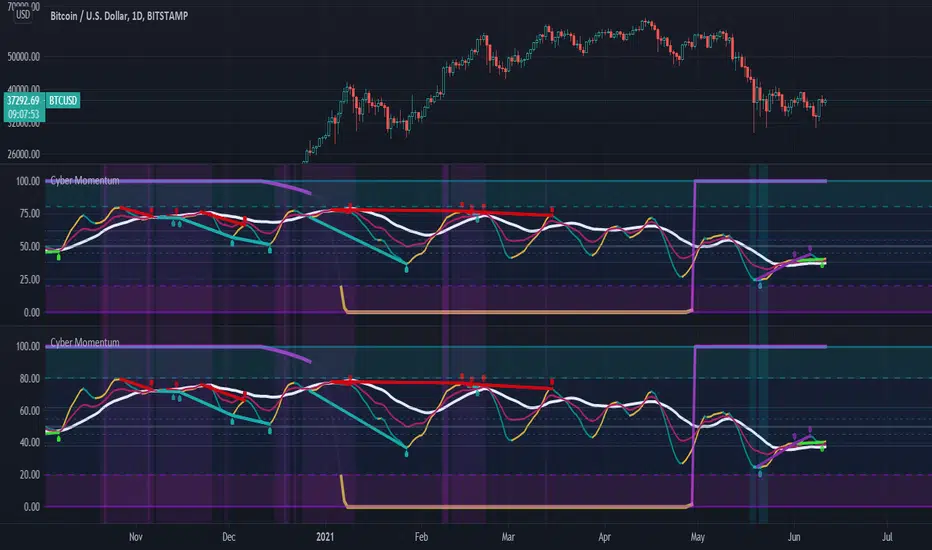
Cyber Momentum V2This Oscillator is another version of my previous Oscillator Cyber Momentum … in this version the CCI formula added to the core calculation therefore there is small differential behavior rather than Cyber Momentum because of different calculation methods …
But both of them are in the same concept; the most optimized signals are those that are in confluence of Cyber Momentum and Cyber Momentum V2 ...

Cyber MomentumThis oscillator is the combination of different settings RSI , RSX , STOCHRSI , MSI ,... in a Stochastic function that can help traders to understand the weakness and strength of momentum in candle sticks in different time frames.
This oscillator organized by three Line , control zone and Divergence Line
1:) Fast Line
2:) Slow Line
3:) Heavy Line
4:) Neutral Zone between Fibo 38.2% & 61.8%
5:) Bullish Control Zone
6:) Bearish Control Zone
7:) Divergence Line
And there are two theories of finding tradable signals behind those parts .
The first and the most simplest theory is the situation that the Fast Line has the possibility to be supported by Slow or Heavy Lines and basically reverse its slope !!
But there are some rules and notes for this theory ... First of all the accuracy and rate of that is variable in three main categories of situation
1:) with or without price action reversal structure like reversal pattern (Head&Shoulder , Quasimodo , .... )
2:) with or without regular divergence
3:) in which control zone ?
So basically the most powerful setup occurs when price action is already in the reversal structure and the potential to have at least one drive of regular divergence exist and also the Fast Line is in the opposite control zone of the current time frame trend .... so obviously if one of those rules will not be satisfied so the signal will be the less value
The second theory is the signals that occur after the reversal, obviously a sign of trend continuation. there are two type of that you can use with this oscillator
The first one happens when price reverses its trend and this oscillator is moving to the neutral zone ... so if at least one drive of hidden divergence exist the neutral zone will have good possibility to reverse the slope of the oscillator obviously this would happen usually after hidden divergence confirmed .
and the second one is basically the first type but after the reversal Subsequently in the outside of the bullish/bearish control zone ... those kinds of signals are NOT the reversal potency signal at all !! they designed for trend continuation... be careful of them and try trade with your old friend trend ! .... also The existence of hidden divergences will be better for trade in this kind of signals .
The idea of this oscillator was inspired by @mrhashem Borjas Tarh Momentum.
[NLX-L2] Oscillator Divergences MTF- Oscillator Divergences -
This indicator give you signals on various oscillator divergences (Regular/Hidden Bull/Bear) you can choose from:
CCI
Donchian
Fisher Transform
MACD
MFI
Momentum
OBV
QQE
RSI
RSX
TSI
- How to Use -
1. Add a Trend Indicator like Trend Index MTF to your chart
2. Add this Oscillator Divergences Indicator to your Chart and select the Trend Index MTF with Type L1 in the Settings as Signal Source
3. Add the Backtest Module to your Chart and select the Signal with Type L2 as Source
The Hurst Exponent Signal Filter can be used as well to filter some of the noise (release coming soon)!
- Alerts for Automated Trading -
See my signature below. Contact me for the Alert module.

RSI/RSX Divergance on chart [Anan]This script points Regular/Hidden Bull/Bear RSI/RSX divergences on the chart.
Options:
-RSI/RSX source
-RSI/RSX length
-Show/hide Regular/hidden Bull/Bear divergences
FTSXFisher transform & RSX for reversal points in price.
Potential price reversals are regular divergences and potential trend continuations are hidden divergences, OB/OS levels are shown with red and green lines.
Rsx Divergence Candle OverlayRSX Divergences on candles instead of in an oscillator to save space.
Divergences do not repaint and have instant confirmation.
RSX source used: Lazybear's

Divergency and convergency indicatorShows convergency and divergency on graphic according to RSX calculations

DivergencyIndicator shows divergency using calculation of RSX indicator. Helps to open trades using time when RSX is weakening

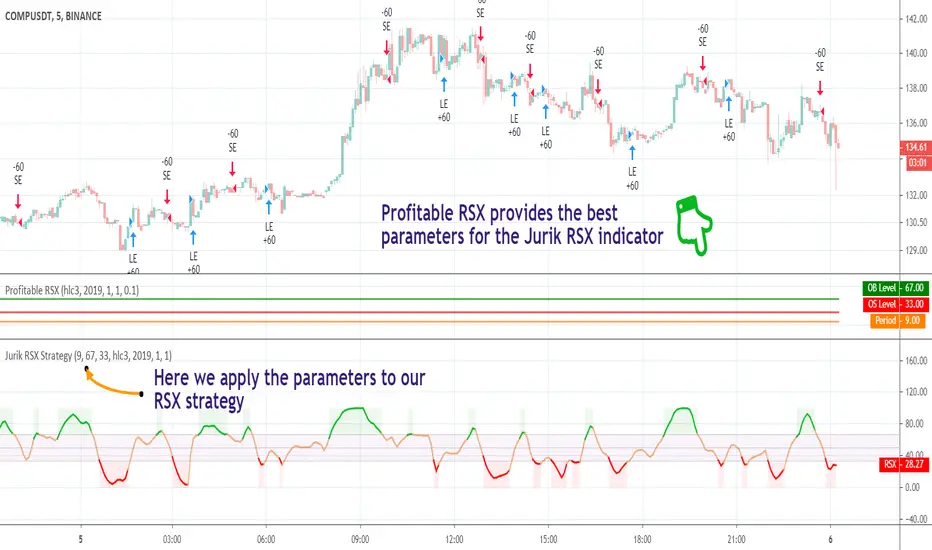
[STRATEGY] Jurik RSXA private strategy from the Profitable Jurik RSX preview for backtesting purposes.

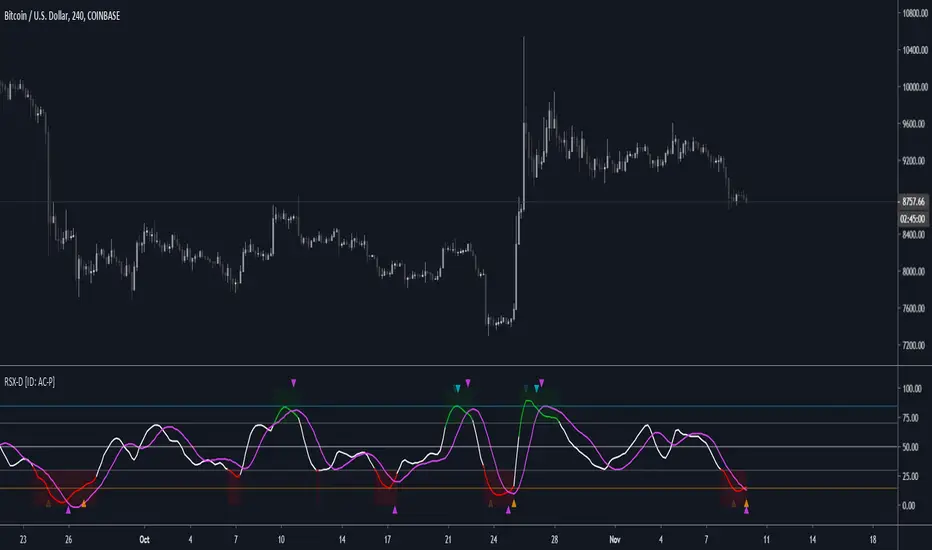
RSX-D [ID: AC-P]The "AC-P" version of Jaggedsoft's RSX Divergence and Everget's RSX script is my personal customized version of RSX with the following additions and modifications:
LSMA-D line that averages in three LSMA components to form a composite, the LSMA-D line. Offset for the LSMA-D line is set to -2 to offset latency from averaging togther the LSMA components to form a composite - recommended to adjust to your timeframe and asset/pair accordingly.
Divergence component from JustUncle, RicardoSantos, and Neobutane divergence scripts
Crossover indication and alerts for Midline, and custom M1 and M2 levels for both RSX and the LSMA-D line from Daveatt's CCI Stochastic Script
EMA21/55 zone cross highlighting option
SMA9/EMA45 MA option from my RSI sma/ema Cu script
Libertus Divergences and Pivot labels from Jaggedsoft's RSX Divergence script are hidden/off by default
Designed for darkmode by default. Minor visual changes from Jaggedsoft's and Everget's script(s) for darkmode and visual aesthetic.
Please Note:
Divergences that use fractal-based detection logic, offset, or a combination of both generally have a 1-2 bar/candle lag. This is an INHERENT limitation of divergence detection with fractals and offsets. Divergences generally will have a higher strikerate on HTF than LTF due to the 1-2 bar lag. While I'm not going to rule out a programming solution or math construct/formula that attempts to alleivates the 1-2 bar lag for divergences, this script is not it - please keep that in mind when using divergence components with a fractal base and offset.
LSMA-D is a composite of three LSMA lines, all with offset options. Different lengths and Offset values can compensate/adjust for the smoothing/latency from RSX, but only up to a certain point. For each LSMA, the least square regression line is calculated for the previous time periods, so the idea is that with finely tuned adjustments, you can get crossover/crossunder signals from the RSX with the LSMA-D line that you simply can't get with the SMA9/EMA45 due to the already smoothed RSX.
The defaults for the RSX and various components for the LSMA-D here will MOSTLY LIKELY NOT WORK OR BE APPLICABLE to every timeframe and asset that you trade - adjust, backtest, and test accordingly. The defaults are here are MEANT to be adjusted to the asset class and timeframe that you are trading.
If you're not familiar with the LSMA, tradingview author Alexgrover has a few great scripts that go into detail how the LSMA works, in addition to different interpretations and implementations of the LSMA.
References/Acknowledgements:
//@version=4
// Copyright (c) 2019-present, Alex Orekhov (everget)
// Jurik RSX script may be freely distributed under the MIT license.
//
//-------------------------------------------------------------------
// Acknowledgements:
//---- Base script:
// RSX Divergence — SharkCIA by Jaggedsoft
//
// Jurik Moving Average by Everget
//
//---- Divergences/Signals:
// Libertus RSI Divergences
//
// Price Divergence Dectector V3 by JustUncle
//
// Price Divergence Detector V2 by RicardoSantos
//
// Stochastic RSI with Divergences by Neobutane
//
// CCI Stochastic by Daveatt
//
//---- Misc. Reference:
// RSI SMA/EMA Cu by Auroagwei
//
// CBCI Cu by Auroagwei
//
// Chop and explode by fhenry0331
//
// T-Step LSMA by RafaelZioni
//
// Scripts by Jaggedsoft for structure and formatting
// Scripts by Everget for structure and formatting
//-------------------------------------------------------------------
// RSX-D v08
// Author: Auroagwei
// www.tradingview.com
//-------------------------------------------------------------------
Jurik RSX+Hello friends,
Meet Jurik RSX+, a powerful standalone oscillator that also integrates perfectly with Profitable Jurik RSX optimizer.
It enhances Jurik's original RSX by introducing a Values Distribution Profile , Point of Control (POC) , and Value Area visualization — transforming a traditional oscillator into a statistically guided market sentiment tool.
These additions help identify where true equilibrium, overbought, and oversold zones occur based on the actual behavior of RSX values rather than fixed numeric levels.
🛠 How It Works
Jurik RSX+ applies advanced smoothing and statistical profiling to analyze how RSX values are distributed over time.
The Values Distribution Profile builds a frequency map of RSX activity, allowing traders to see:
The Point of Control (POC) — the statistically dominant RSX level.
The Value Area — the range where RSX values cluster most frequently.
By studying this distribution, the indicator reveals true overbought, oversold, and midline zones , adapting dynamically to different instruments and market conditions.
On top of that, traders can construct fully customized Buy/Sell signals using crossover conditions between RSX, Signal Line, Midline, or POC — creating a flexible signal generation framework.
🔥 Key Features
Jurik RSX foundation with enhanced smoothing and adaptive distribution modeling
Values Distribution Profile identifying statistically balanced and extreme zones
Point of Control (POC) and Value Area visualization for precision analysis
Customizable Buy/Sell logic — up to 4 Buy and 4 Sell slots using flexible crossover conditions
Strategy Mode preventing overlapping Buy/Sell signals
Multiple visualization styles — Labels , Dots , Stripes , or combined modes
Integrated alerts for RSX, POC, and OB/OS conditions
If you'd like access or have any questions, feel free to reach out to me directly via DM.
👋 Good luck and happy trading!
Script a pagamento

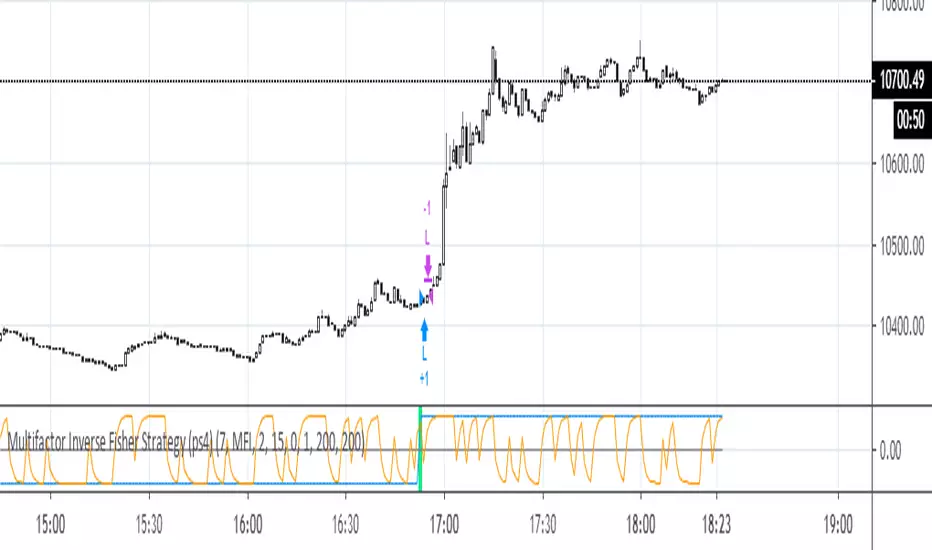
Multifactor Inverse Fisher Strategy (ps4)Best for higher time frames - 30m, 1H, 2H, 3H, 4H, D this strategy uses several factors that are pushed through an Inverse Fisher Transform (IFT). The higher the TF, the better the performance, up to 98%, but the number of deals tends to drop). Middle time frames (5m, 15m) look viable with Scaled Price (Scaled %P) and MFI factors. The factor list can be extended to include cci, stoch, rsi_stoch, emo, macd, cog, dpo, roc, accdist, cctbb, mom, awesome, tva, etc. Some of them need to be rescaled to a 0..100 interval. The IFT produces a value in the -1..1 interval (see: www.mesasoftware.com). This indicator does NOT repaint.


Profitable Jurik RSXIntroduction
As you know the Jurik RSX is a "noise free" smoothed version of RSI (Relative Strength Index), with no added lag.
It was originally developed by Mark Jurik and is used the same way as RSI. To learn more about this indicator see www.jurikres.com
The most basic and common strategy is to use the crossovers between Jurik RSX and its overbought/oversold levels as trade signals:
when RSX crosses above 30, go Long
when RSX crosses below 70, go Short
exit when a crossover occurs in the opposite direction
What is this tool?
This tool is a performance scanner that uses a decision tree-based algorithm under the hood to find the most profitable settings for Jurik RSX. It analyzes the range of periods between 2 to 100 and backtests the Jurik RSX for each period (using the strategy mentioned above) across the entire history of an instrument. If the more profitable parameter was found, the indicator will switch its value to the found one immediately.
So, instead of manually selecting parameters just apply it to your chart and relax - the algorithm will do it for you, everywhere you want.
The algorithm can work in two modes: Basic and Early Switch. The Early Switch algorithm makes some assumptions and activates a set of optimizations to find a better setting DURING the trades, not after they were actually closed.
The difference is illustrated on the screenshot below
But two modes can show identical values depending on timeframe
Additionally you can set up a backtest window through indicator's settings (the optimizers which were published before will get this feature soon).
Alerts
It has a special alert that notifies when a more profitable period was detected.
NOTE: It does not change what has already been plotted.
NOTE 2: This is not a strategy, but an algorithmic optimizer.
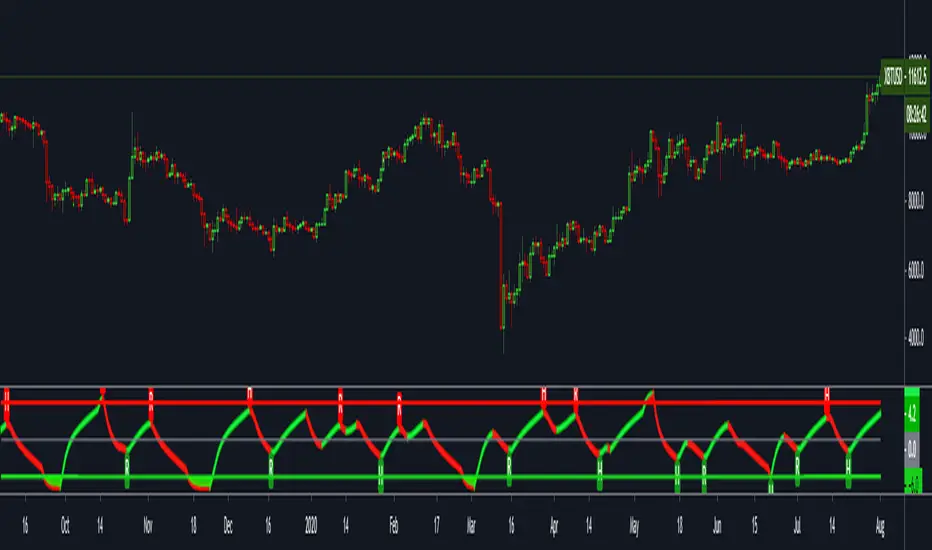
DC of RSX CloneDuring trending periods every trader would like to have the source of signals to close positions and re-entry if trend continues. The Donchian channel formed by "lag-free" RSI (RSX which is, basically, RSI calculated with using Jurik's Moving Average) could be such indicator. Simplest usage is to keep position while RSX sticks to the channel's bound, and close position when RSX detaches. Crossings with Oversold/overbought levels and with center line also can provide valuable signals. Don't forget to adjust parameters for your instrument and timeframe.

TDI RSX JMATDI based on RSX and JMA from Jurik.
Green dot = Rsx cross JMA below 50--> Long
Blue dot = JMA cross Mid Band --> Long
Red dot = Rsx cross JMA above 50 -->Short
Orange dot =JMA cross Mid Band --> Short

