Adaptive Fractal Grid Scalping StrategyThis Pine Script v6 component implements an "Adaptive Fractal Grid Scalping Strategy" with an added volatility threshold feature.
Here's how it works:
Fractal Break Detection: Uses ta.pivothigh and ta.pivotlow to identify local highs and lows.
Volatility Clustering: Measures volatility using the Average True Range (ATR).
Adaptive Grid Levels: Dynamically adjusts grid levels based on ATR and user-defined multipliers.
Directional Bias Filter: Uses a Simple Moving Average (SMA) to determine trend direction.
Volatility Threshold: Introduces a new input to specify a minimum ATR value required to activate the strategy.
Trade Execution Logic: Places limit orders at grid levels based on trend direction and fractal levels, but only when ATR exceeds the volatility threshold.
Profit-Taking and Stop-Loss: Implements profit-taking at grid levels and a trailing stop-loss based on ATR.
How to Use
Inputs: Customize the ATR length, SMA length, grid multipliers, trailing stop multiplier, and volatility threshold through the input settings.
Visuals: The script plots fractal points and grid levels on the chart for easy visualization.
Trade Signals: The strategy automatically places buy/sell orders based on the detected fractals, trend direction, and volatility threshold.
Profit and Risk Management: The script includes logic for taking profits and setting stop-loss levels to manage trades effectively.
This strategy is designed to capitalize on micro-movements during high volatility and avoid overtrading during low-volatility trends. Adjust the input parameters to suit your trading style and market conditions.
Scalping

Scalping long-shortThe Scalping long-short indicator is a comprehensive system for analyzing candle patterns and trading volume, designed for use in a scalping strategy. The main purpose of the indicator is to identify the key points of changing market sentiment and provide the trader with accurate signals for entering a trade.
The main components of the indicator:
1. Candle Pattern Analysis:
The indicator analyzes four main candle patterns:
-A Bullish Hammer is a candle with a small body and a long lower tail, which indicates the possible completion of a downward movement and the beginning of an uptrend.
-Bearish Hanging Man is a candle similar to a bullish hammer, but it appears after an upward movement, signaling the possible beginning of a downtrend.
-Bullish Engulfing is a candle with a large body that completely covers the body of the previous candle, showing strong buyer interest.
-Bearish Engulfing is the reverse situation, when a large bearish candle absorbs the previous bullish candle, indicating the predominance of sellers.
-Doji is a candle with almost identical opening and closing prices, indicating market indecision.
For each of these patterns, the indicator sets certain threshold values that the user can adjust to their preferences and features of the trading instrument.
2. Volume analysis:
The volume is an important confirmation of the strength of the signal. The indicator compares the current volume with the average value for the user-selected period (length parameter) multiplied by the volumeMultiplier coefficient. If the current volume exceeds this indicator, the signal is considered confirmed.
3. Visual indication:
Graphical elements corresponding to each type of signal are displayed on the price chart.:
-The green triangle down is a buy signal (bullish hammer or bullish takeover).
-The red triangle up is a sell signal (bearish hanging or bearish engulfing).
-The yellow diamond is a neutral state (doji).
These visual cues help you quickly assess the current market situation without having to analyze each candle manually in depth.
4. Alerts:
The indicator supports setting alerts that can be sent via the TradingView platform or other supporting systems. This allows the trader to receive notifications about the occurrence of new signals even outside the workplace.
Settings:
The user can change the following settings:
-Length is the period for calculating the average volume.
-Multiplier is a multiplier for the thresholds of candle patterns.
-HammerThreshold, HangingManThreshold, EngulfingThreshold, DojiThreshold are Thresholds for recognizing specific candlestick patterns.
-VolumeMultiplier is a coefficient for comparing the current volume with the average value.
These parameters allow you to adapt the indicator to various trading instruments and time intervals, making it a universal tool for a wide range of traders.
Conclusion:
The Scalping long-short indicator combines powerful analytical tools to identify key points in the market, providing the trader with clear and timely signals for making trading decisions. Its flexibility and fine-tuning capability make it useful for both beginners and experienced market participants.

Bondar Drive v2.1Title: Bondar Drive v2.1 — Real-time print and delta tick volume visualization
Description:
Bondar Drive v2.1 is a tool for visualizing real-time order flow data. It highlights price movements and volume deltas in an intuitive, easy-to-read format. Indicator can be used in conjunction with the Anchored Volume Profile and Volume Footprint (Type: Total).
Features:
Real-Time Print Visualization:
Displays order flow prints with delta colors for buy/sell dominance.
Adjustable size and transparency for varying order thresholds.
Volume Delta Analysis:
Categorizes orders into Tiny, Small, Session, Large, and Huge based on user-defined thresholds.
Provides a tooltip showing order time and price.
Customizable Time Range:
Keeps prints visible for a specified duration (in seconds).
Flexible User Inputs:
Adjustable time zones, print sizes, starting bar index, and volume thresholds.
Visual Enhancements:
Line connections between prints show progression of orders and market direction.
How It Works:
The indicator gathers volume delta and price data in real time.
It dynamically displays circular labels with varying sizes and colors, reflecting the size and type of orders. Labels and lines are automatically removed after the specified time range, ensuring a clean and uncluttered chart.
Customization Options:
Number of Prints: Control how many prints are displayed.
Order Size Filters: Exclude small trades to highlight significant orders.
Color Options: Customize print colors, text, and connecting lines.
Time Offset: Adjust for your local time zone.
Use Cases:
Identify order flow imbalances and price levels dominated by buyers or sellers.
Track the progression of large orders for better trade execution.
Spot market reversals and momentum shifts using real-time prints and delta.

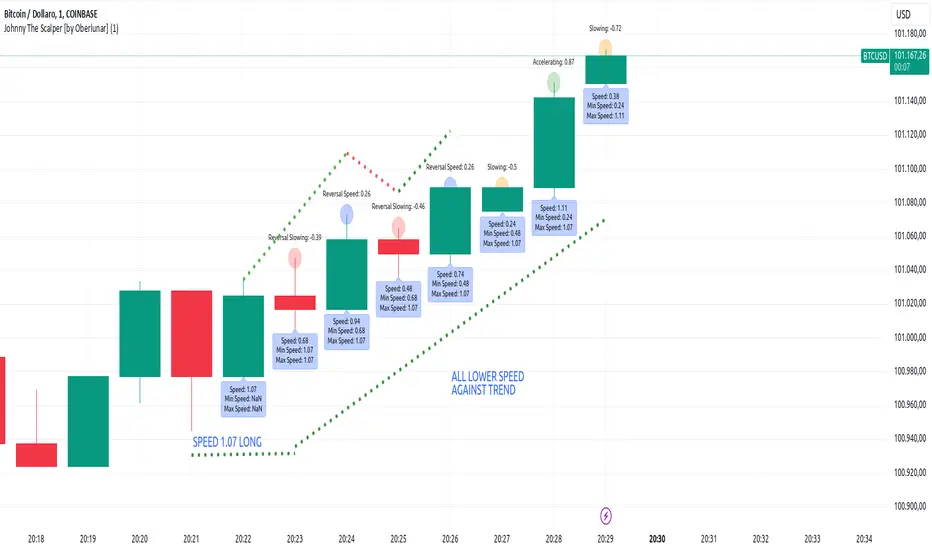
Johnny The Scalper - Momentum/Speed [by Oberlunar]The Johnny The Scalper indicator is designed to provide scalpers with insights into market momentum and speed dynamics by analyzing the price movement within candles. It calculates the "candle speed," defined as the range of a candle (high minus low) divided by the elapsed time in seconds since the candle opened. Users can customize the distance for comparison by specifying how many candles back the indicator should look when calculating the speed difference (`Diff`).
The script retrieves the speed of the specified candle from the past (`candle_speed_x`) and compares it to the speed of the current candle, calculating the difference (`speed_difference`). The indicator also identifies whether the current candle and the candle from the past are bullish (green) or bearish (red), using this information to interpret the dynamics of the difference.
If the difference is negative, it means the current candle's speed is slower than the reference candle's speed. A negative difference combined with candles of the same direction suggests a slowdown, while candles of opposite directions indicate a slowing reversal. A positive difference suggests that the current candle is faster. If the candles have the same direction, it signifies an acceleration in the current trend; if their directions differ, it indicates a faster reversal.
The results are displayed graphically as labels on the chart. Labels above the candles show the difference Diff with color-coded backgrounds based on the calculated dynamics:
orange for a slowdown in the same direction,
red for a slowing reversal,
green for acceleration in the same direction,
and blue for a faster reversal.
An additional label below the candle optionally displays the current candle's speed in real time. This indicator helps scalpers identify momentum shifts and potential reversals in a highly customizable manner, adapting to different trading strategies and timeframes.
EMA SCALPING SUITE v1.0 [1M-5M]EMA SCALPING SUITE v1.0
A scalping indicator designed for quick entries on lower timeframes, combining EMA
stacks with volume confirmation and automatic risk management levels.
CORE FEATURES:
1. EMA Stack System:
- 50 EMA (Blue): Fastest trend
- 100 EMA (Yellow): Entry trigger line
- 150 EMA (Orange): Stop loss reference
- 200 EMA (Red): Base trend
2. Entry System:
- LONG: When price dips to 100 EMA during bullish fan
- SHORT: When price rises to 100 EMA during bearish fan
- Signals shown as triangles at entry points
3. Risk Management:
- Auto Stop Loss: 150 EMA (red line)
- Auto Take Profit: Based on RR ratio (green line)
- Entry Price Marker: Current close (blue line)
4. Volume Confirmation:
- High volume dots (>1.5x average)
- Filters out weak signals
- Adjustable sensitivity
HOW IT WORKS:
1. Wait for EMAs to fan out (trend alignment)
2. Look for price to touch 100 EMA
3. Check for volume confirmation
4. Enter when signal appears
5. Use auto-generated SL and TP levels
BEST TIMEFRAMES:
- Primary: 1 minute
- Secondary: 3-5 minutes
- Not recommended: >15 minutes
RECOMMENDED SETTINGS:
- Volume Filter: ON
- Volume Multiplier: 1.5
- Risk:Reward: 1.5

Precision Trading Strategy: Golden EdgeThe PTS: Golden Edge strategy is designed for scalping Gold (XAU/USD) on lower timeframes, such as the 1-minute chart. It captures high-probability trade setups by aligning with strong trends and momentum, while filtering out low-quality trades during consolidation or low-volatility periods.
The strategy uses a combination of technical indicators to identify optimal entry points:
1. Exponential Moving Averages (EMAs): A fast EMA (3-period) and a slow EMA (33-period) are used to detect short-term trend reversals via crossover signals.
2. Hull Moving Average (HMA): A 66-period HMA acts as a higher-timeframe trend filter to ensure trades align with the overall market direction.
3. Relative Strength Index (RSI): A 12-period RSI identifies momentum. The strategy requires RSI > 55 for long trades and RSI < 45 for short trades, ensuring entries are backed by strong buying or selling pressure.
4. Average True Range (ATR): A 14-period ATR ensures trades occur only during volatile conditions, avoiding choppy or low-movement markets.
By combining these tools, the PTS: Golden Edge strategy creates a precise framework for scalping and offers a systematic approach to capitalize on Gold’s price movements efficiently.

TechniTrendMasterIntroducing "TechniTrendMaster"
The TechniTrendMaster indicator is designed to bring clarity and depth to your trading strategy. This indicator combines robust trend analysis with volume insights, giving you a comprehensive view of the market’s pulse. Let's break down the features.
🔵 Analysis Mode
TechniTrendMaster's Analysis Mode provides various configurations tailored to specific market behaviors. Here are the options you can utilize:
🔹Strong Movements: Focuses on powerful market shifts, ideal for capturing major trend changes and high-momentum moves. Perfect for identifying strong breakout opportunities.
🔹Reversal: Detects potential turning points in the market, signaling when a trend might be about to change direction, allowing for well-timed entries and exits.
🔹Consolidations: Spots periods of low volatility where the market moves sideways, helping you avoid trading traps and anticipate breakout scenarios.
🔹Momentum-Driven: Prioritizes momentum in the market, identifying when the force behind price movement is accelerating or decelerating.
🔹Balanced: Offers a well-rounded view of the market by weighing both trend direction and volume equally, making it suitable for stable market conditions.
🔹Volatility Adapted: Adjusts to periods of increased or decreased volatility, providing accurate signals regardless of market conditions.
🔹Trend Confirmation: Confirms the strength and sustainability of a trend, allowing traders to enter trades with higher confidence.
🔹Short-Term Scalping: Tailored for traders who focus on Short-Term and Scalp trades, offering rapid insights for intraday or short-term trading strategies.
🔵 Trend Analysis Mode
The Trend Analysis Mode allows you to customize how trends are detected and analyzed:
🔹Default: A balanced mode for general use, offering reliable trend identification across different market conditions.
🔹Aggressive: A more sensitive setting that reacts quickly to market changes, ideal for traders looking to capitalize on smaller, quicker movements.
🔹Conservative: Takes a cautious approach, favoring long-term stability over short-term fluctuations, perfect for risk-averse traders.
🔹Volatility Aware: Focuses on adapting to volatility shifts, giving accurate trend signals even in erratic markets.
🔹Range Bound: Targets horizontal price movements and channel trades, helping traders take advantage of well-defined ranges.
🔵 Divergence
Divergence is a powerful tool within TechniTrendMaster, highlighting discrepancies between price movement and underlying volume. These differences can indicate potential reversals or trend continuations before they are visible on price charts alone.
🔵 Hidden Divergence
Hidden divergence is a subtle yet crucial signal that reveals when an existing trend might resume after a temporary correction. This mode provides early detection of trend continuity opportunities, giving traders a significant advantage in timing.
🔵 Divergence Mode
TechniTrendMaster includes different divergence detection settings to suit your analysis style:
🔹Standard: Captures typical divergence patterns for general analysis.
🔹Short-Term Focused: Concentrates on short-lived divergences, offering rapid detection of shifts for active traders.
🔹Long-Term Analysis: Highlights divergence in a broader context, which is better for understanding the overall market direction.
🔹High Sensitivity: Prioritizes capturing even the smallest shifts in the market, making it excellent for high-frequency trading or volatile environments.
🔹Low Sensitivity: Reduces market noise, only reacting to more significant changes in trend or volume. It’s perfect for traders who seek higher accuracy with fewer false signals.
🔵 Dynamic Channel
TechniTrendMaster features a Dynamic Channel, that automatically adapts to market conditions. This channel provides a visual guide to price action, adjusting in real-time based on current trends and volatility. It identifies key support and resistance zones, making it easier to spot breakouts, trend continuations, or potential reversals.
🔵 Volume Integration
Volume is a critical part of TechniTrendMaster, offering deeper insights beyond just price movement. By analyzing volume patterns alongside trends, the indicator highlights the strength and reliability of market shifts. This integration ensures that traders can distinguish between genuine movements backed by solid volume and weak trends that might not hold.
🔵 A Solution for All Trading Styles
TechniTrendMaster’s strength lies in its versatility. No matter your trading approach—be it scalping, swing trading, trend following, or range trading—this indicator adapts to your needs. Here's how it caters to different trader profiles:
🔹Scalpers get precise, quick-response insights through the Short-Term Scalping and High Sensitivity settings, helping them capture minute price movements.
🔹Swing Traders benefit from modes like Reversal, Balanced, and Momentum-Driven, which focus on identifying trends and shifts that occur over several days.
🔹Long-Term Investors will find the Conservative, Low Sensitivity, and Long-Term Analysis modes ideal for filtering noise and sticking to broader market trends.
🔹Volatility Traders can rely on the Volatility Adapted and Volatility Aware options to get accurate signals even during unpredictable periods.
🔓 Unlock Access :
Check out the Author's Instructions or Dm me to Unlock the Access.

Dynamic Buy/Sell VisualizationDynamic Trend Visualization Indicator
Description:
This simple and easy to use indicator has helped me stay in trades longer.
This indicator is designed to visually represent potential buy and sell signals based on the crossover of two Simple Moving Averages (SMA). It's crafted to assist traders in identifying trend directions in a straightforward manner, making it an excellent tool for both beginners and experienced traders.
Features:
Customizable Moving Averages: Users can adjust the period length for both short-term (default: 10) and long-term (default: 50) SMAs to suit their trading strategy.
Visual Signals: Dynamic lines appear at the points of SMA crossover, with labels to indicate 'BUY' or 'SELL' opportunities.
Color and Style Customization: Customize the appearance of the buy and sell lines for better chart readability.
Alert Functionality: Alerts are set up to notify users when a crossover indicating a buy or sell condition occurs.
How It Works:
A 'BUY' signal is generated when the short-term SMA crosses above the long-term SMA, suggesting an upward trend.
A 'SELL' signal is indicated when the short-term SMA crosses below the long-term SMA, pointing to a potential downward trend.
Use Cases:
Trend Following: Ideal for markets with clear trends. For example, if trading EUR/USD on a daily chart, setting the short SMA to 10 days and the long SMA to 50 days might help in capturing longer-term trends.
Scalping: In a volatile market, setting shorter periods (e.g., 5 for short SMA and 20 for long SMA) might catch quicker trend changes, suitable for scalping.
Examples of how to use
* Short-term for Quick Trades:
SMA 5 and SMA 21:
Purpose: This combination is tailored for day traders or those looking to engage in scalping. The 5 SMA will react rapidly to price changes, providing early signals for buy or sell opportunities. The 21 SMA, being a Fibonacci number, offers a slightly longer-term view to confirm the short-term trend, helping to filter out minor fluctuations that might lead to false signals.
* Middle-term for Swing Trading:
SMA 10 and SMA 50:
Purpose: Suited for swing traders who aim to capitalize on medium-term trends. The 10 SMA picks up on immediate market movements, while the 50 SMA gives insight into the medium-term direction. This setup helps in identifying when a short-term trend aligns with a longer-term trend, providing a good balance for trades that might last several days to a couple of weeks.
* Long-term Trading:
SMA 50 and SMA 200:
Purpose: Investors focusing on long-term trends would benefit from this pair. The crossover of the 50 SMA over the 200 SMA can indicate the beginning or end of major market trends, ideal for making decisions about long-term holdings that might span months or years.
Example Strategy if not using the Buy / Sell Label Alerts:
Entry Signal: Enter a long position when the shorter SMA crosses above the longer SMA. For example:
SMA 10 crosses above SMA 50 for a medium-term bullish signal.
Exit Signal: Consider exiting or initiating a short position when:
SMA 10 crosses below SMA 50, suggesting a bearish turn in the medium-term trend.
Confirmation: Use these crossovers in conjunction with other indicators like volume or momentum indicators for better confirmation. For instance, if you're using the 5/21 combination, look for volume spikes on crossovers to confirm the move's strength.
When Not to Use:
Sideways or Range-Bound Markets: The indicator might generate many false signals in a non-trending market, leading to potential losses.
High Volatility Without Clear Trends: Rapid price movements without a consistent direction can result in misleading crossovers.
As a Standalone Tool: It should not be used in isolation. Combining with other indicators like RSI or MACD for confirmation can enhance trading decisions.
Practical Example:
Buy Signal: If you're watching Apple Inc. (AAPL) on a weekly chart, a crossover where the 10-week SMA moves above the 50-week SMA could suggest a buying opportunity, especially if confirmed by volume increase or other technical indicators.
Sell Signal: Conversely, if the 10-week SMA dips below the 50-week SMA, it might be time to consider selling, particularly if other bearish signals are present.
Conclusion:
The "Dynamic Trend Visualization" indicator provides a visual aid for trend-following strategies, offering customization and alert features to streamline the trading process. However, it's crucial to use this in conjunction with other analysis methods to mitigate the risks of false signals or market anomalies.
Legal Disclaimer:
This indicator is for educational purposes only. It does not guarantee profits or provide investment advice. Trading involves risk; please conduct thorough or consult with a financial advisor. The creator is not responsible for any losses incurred. By using this indicator, you agree to these terms.

FibLevel Size CalculatorThis skript calculates position sizes and new take profits for sizing into an long or short position with 3 entrys defined at custom fibonacci retracement levels.
TP: -0,272
Entry1: 0.382
Entry2: 0.618
Entry3: 0.83
SL: 1.05
Expected RR per trade is 0.2 with a High Win rate definitly profitable.
Search for an established trend on the higher timeframe, drop to the smaller ones and look for correction waves. Once they break to the trenddirection of the higher timeframe take the fib from lowest to highes point. Draw a fib level on the chart and use the Indicator to define these Levels above. The calculator gives you the Margin to use in each position, and will check that you will not get liquidated an that you have enough margin. It tells you the new TP for Limit2 and Limit3 if they get hit so you can get out of the trade full TP with a small bounce.
Inputs:
Account Balance, Risk Percentage, and Leverage: These inputs are used to calculate the position size and risk.
Entry 1, Entry 2, Entry 3, Take Profit (TP), and Stop Loss (SL): These prices are used for calculating position sizes, risk, and profit for up to three entry points.
Calculations:
Risk Amount: Calculated based on the account balance and risk percentage.
Position Sizes (Qty): For each entry point, the position size is determined. The second and third entries have a multiplier (3x for Entry 2, 5x for Entry 3) compared to the first.
Stop Loss and Profit Calculation: The script calculates the potential profit and adjusts the TP levels based on the average entries for Limit 2 and Limit 3.
Margin Calculation: Margin requirements for each position are calculated based on leverage.
Output:
Table Display: A table shows key values like entry prices, position sizes, TP levels, potential profit, and margin requirements for each limit.
Warnings: It includes a liquidation warning and a check for whether the account is at risk of liquidation based on leverage.
Position Type: It automatically detects if the trade is a long or short based on the relationship between TP and SL.
Visualization:
Lines: It draws horizontal lines on the chart to visually represent the entry, TP, and SL levels.
Overall, this script is designed to help traders manage risk and calculate position sizes for multi-level entries using leverage.
Pls drop feedback in the comments.

[BRAIN] Absolute Volatility of Price
Hello traders!
Today I want to share with you a series of scripts and strategies that I developed a few years ago. This is one of my first works, born from the curiosity of seeing a candlestick representation in a different way, without considering the price movement along the y-axis.
Imagine observing the price movement in dollars and percentages, always starting from the same reference point: the 0 axis. This approach can offer new insights and ideas on how and how much prices move.
To explain it better, the open of each candle does not start from the previous close negotiations but always starts from the 0 axis . In this way, it is possible to clearly compare the bodies of the candles with each other.
Script Visualization Methods and Input
- Study Normal: Simply reports the prices, including the negative ones of the red candles, on the same scale in absolute terms (ABS), as shown in the first indicator above.
- Study Normal Neg: In this version, the red candles vary negatively below zero, instead of in absolute terms above zero, as shown in the second indicator above.
- Study Perc: Similar to "Study Normal" but uses percentage values instead of dollars, useful for very low timeframes and low variations with many decimals, such as 1 minute on EUR/USD.
- Study Perc Neg: Similar to "Study Normal Neg" but uses percentage values.
Additionally, I have added the possibility to display or not, through two buttons, an average of the candle bodies adjustable in length via input and the range of each candle, always correlated in dollars or percentages, as per the main study setting.
I hope this work can be useful to many of you. I invite you to like if you appreciate my scripts and want to see more like these. Do not hesitate to comment or contact me for any doubts or questions.
PS: If you notice that in the script the sum of the percentage values between the shadow and the body of the candle does not correspond to the range, it is only a rounding issue. Change the precision setting to a lower value and you will see that the rounding disappears.
PS: In the script, to better visualize the percentage growth and decline of the instrument on very high timeframes, I decided to represent it as follows:
- If close ≥ open: (high - low) / low * 100
- If close < open: (high - low) / high * 100
The same method is also applied for calculating the percentage variations of the shadows relative to themselves.
I hope you like this version! If you need any further modifications or adjustments, let me know. Good luck with your project!
(In the photos below I show 3 versions of the indicator open on 3 different tickers as an example: from top to bottom in the 3 indicators are set these Study: Study Normal, Study Perc and Study Perc Neg)

Nifty scalping 3 minutes options on Dhan
Strategy Description for Publishing: Nifty Scalping 3 Minutes Options on Dhan
Overview:
The Nifty Scalping 3 Minutes Options on Dhan strategy is an enhanced version tailored for trading Nifty Options, building on the core logic used in the previously published Nifty Scalping 3 Minutes Strategy. This strategy provides automated order execution via JSON alerts for seamless integration with the Dhan platform, enabling hands-free options trading.
This system is designed to capture short-term market moves using a combination of technical indicators like the Jurik Moving Average (JMA), Exponential Moving Average (EMA), and Bollinger Bands, while also allowing traders to manage risk effectively with custom inputs for maximum loss per lot and partial profit booking.
For more details on the core logic and performance of the strategy, please refer to our earlier published strategy:
Nifty Scalping 3 Minutes Strategy
Key Features:
JMA and EMA Crossovers: Trades are executed when the Jurik Moving Average (JMA) crosses over (for long trades) or under (for short trades) the Exponential Moving Average (EMA), signaling trend direction.
Price-Volume Spike Detection: Ensures that trades are executed only when significant market activity is detected, avoiding low-momentum conditions. Price-volume relationships are monitored to confirm the strength of market movements.
Bollinger Band Noise Filter: Filters out low-volatility periods by executing trades only when prices break through the upper or lower Bollinger Bands, confirming high volatility.
Customizable Risk Management: Traders can set their own maximum risk per lot (e.g., ₹650), and the strategy adjusts the stop-loss accordingly to ensure that no trade exceeds this threshold.
Partial Profit Booking: A predefined percentage (e.g., 60%) of the position can be booked as profit once the first profit target is reached, with the remaining position trailed using an ATR-based stop.
STBT/BTST Support: The strategy offers the flexibility to carry trades overnight, supporting Sell Today, Buy Tomorrow (STBT) and Buy Today, Sell Tomorrow (BTST).
Time-Based Exit: The strategy automatically closes any open positions by 3:20 PM to avoid the volatile end-of-day market conditions.
Inputs for Traders:
Option Quantity: Select the number of contracts to trade (e.g., 10).
Maximum Risk Per Lot: Set your maximum allowable loss per lot (e.g., ₹650), ensuring that your risk is managed effectively.
Partial Profit Booking Percentage: Define what percentage of your position to book as profit (e.g., 60%) when the first target is hit.
STBT/BTST Option: Choose whether to allow positions to be carried overnight.
Alert Secret Key: Input your secret key for the Dhan platform to trigger automated orders via JSON alerts.
Option Expiry Date: Specify the expiry date for the options being traded.
Trade Logic:
Long Trades: Triggered when JMA crosses above EMA, supported by filters like price-volume spikes and Bollinger Band breakouts. The strategy waits for momentum confirmation before entering long trades, with stop-loss and profit-taking mechanisms in place.
Short Trades: Triggered when JMA crosses below EMA, with confirmation through additional filters to ensure strong market trends before entering short positions.
Risk Management:
Stop-Loss: A dynamic stop-loss is placed for each trade based on the trader's maximum risk per lot. The stop-loss adapts to market conditions using ATR trailing stops to capture further gains as the trade progresses.
Partial Profit Booking: Once the first profit target is hit (2.1x risk for long trades and 2.5x risk for short trades), a percentage of the position is booked as profit, and the remainder is trailed using an ATR stop.
Automation via JSON Alerts:This strategy sends automated JSON alerts to the Dhan platform for seamless execution of orders. The alerts support multi-leg orders for both entry and exit, ensuring that trades are executed efficiently without manual intervention.
Why Use This Strategy?
The Nifty Scalping 3 Minutes Options on Dhan strategy is perfect for traders who want to capitalize on quick market moves in options, backed by strong risk management and automation. With automated alerts, customizable inputs, and advanced technical filters, this strategy is ideal for traders looking to engage in high-probability options trades with minimal effort.
For more detailed information about the underlying logic, you can refer to the previously published Nifty Scalping 3 Minutes Strategy here.
Disclaimer:
This strategy is provided as an educational tool, and we are not affiliated with or sponsored by Dhan. The strategy integrates with the Dhan platform for automated trading, but there is no formal relationship between this strategy and Dhan.

First Candle High Low LevelsDescription
The "First Candle High Low Levels" Pine Script indicator is designed to highlight the high and low levels of the first candle of the day on your TradingView chart. It works across different timeframes and specifically handles the Indian stock market trading hours (9:15 AM to 3:30 PM IST). The script draws a box from the start to the end of the trading session, visually marking the price range defined by the first candle of the day. Traders can customize the box's border color, fill color, and line width.
Features
Customizable Timeframe: Users can select the desired timeframe for the first candle (e.g., 5-minute, 15-minute, etc.).
Custom Box Appearance: Options to adjust the border color, fill color, and line width of the drawn box.
Auto Reset for Each New Day: The high and low of the first candle are reset daily to mark the start of the next trading day.
Accurate Market Session Handling: The box is drawn from the start of the first candle to the end of the trading session (3:30 PM IST).
Usage
Adding to Chart: Apply the script by copying it into the Pine Script editor in TradingView. Once added, the script will automatically draw a box representing the high and low of the first candle of the day.
Select Timeframe: You can adjust the First Candle Timeframe input to define which timeframe candle will be used for marking the high and low. For example, if you choose a 5-minute timeframe, the high and low of the first 5-minute candle will be used.
Customization:
Adjust the Border Color and Box Fill Color through the input settings to match your chart's style.
Modify the Box Line Width to make the box lines more or less prominent.

Scalping with Williams %R, MACD, and SMA (1m)Overview:
This trading strategy is designed for scalping in the 1-minute timeframe. It uses a combination of the Williams %R, MACD, and SMA indicators to generate buy and sell signals. It also includes alert functionalities to notify users when trades are executed or closed.
Indicators Used:
Williams %R : A momentum indicator that measures overbought and oversold conditions. The Williams %R values range from -100 to 0.
Length: 140 bars (i.e., 140-period).
MACD (Moving Average Convergence Divergence) : A trend-following momentum indicator that shows the relationship between two moving averages of a security's price.
Fast Length: 24 bars
Slow Length: 52 bars
MACD Length: 9 bars (signal line)
SMA (Simple Moving Average) : A trend-following indicator that smooths out price data to create a trend-following indicator.
Length: 7 bars
Conditions and Logic:
Timeframe Check :
The strategy is designed specifically for the 1-minute timeframe. If the current chart is not on the 1-minute timeframe, a warning label is displayed on the chart instructing the user to switch to the 1-minute timeframe.
Williams %R Conditions :
Buy Condition: The strategy looks for a crossover of Williams %R from below -94 to above -94. This indicates a potential buying opportunity when the market is moving out of an oversold condition.
Sell Condition: The strategy looks for a crossunder of Williams %R from above -6 to below -6. This indicates a potential selling opportunity when the market is moving out of an overbought condition.
Deactivate Buy: If Williams %R crosses above -40, the buy signal is deactivated, suggesting that the buying condition is no longer valid.
Deactivate Sell: If Williams %R crosses below -60, the sell signal is deactivated, suggesting that the selling condition is no longer valid.
MACD Conditions :
MACD Histogram: Used to identify the momentum and the direction of the trend.
Long Entry: The strategy initiates a buy order if the MACD histogram shows a positive bar after a negative bar while a buy condition is active and Williams %R is above -94.
Long Exit: The strategy exits the buy position if the MACD histogram turns negative and is below the previous histogram bar.
Short Entry: The strategy initiates a sell order if the MACD histogram shows a negative bar after a positive bar while a sell condition is active and Williams %R is below -6.
Short Exit: The strategy exits the sell position if the MACD histogram turns positive and is above the previous histogram bar.
Trend Confirmation (Using SMA) :
Bullish Trend: The strategy considers a bullish trend if the current price is above the 7-bar SMA. A buy signal is only considered if this condition is met.
Bearish Trend: The strategy considers a bearish trend if the current price is below the 7-bar SMA. A sell signal is only considered if this condition is met.
Alerts:
Long Entry Alert: An alert is triggered when a buy order is executed.
Long Exit Alert: An alert is triggered when the buy order is closed.
Short Entry Alert: An alert is triggered when a sell order is executed.
Short Exit Alert: An alert is triggered when the sell order is closed.
Summary:
Buy Signal: Activated when Williams %R crosses above -94 and the price is above the 7-bar SMA. A buy order is placed if the MACD histogram shows a positive bar after a negative bar. The buy order is closed when the MACD histogram turns negative and is below the previous histogram bar.
Sell Signal: Activated when Williams %R crosses below -6 and the price is below the 7-bar SMA. A sell order is placed if the MACD histogram shows a negative bar after a positive bar. The sell order is closed when the MACD histogram turns positive and is above the previous histogram bar.
This strategy combines momentum (Williams %R), trend-following (MACD), and trend confirmation (SMA) to identify trading opportunities in the 1-minute timeframe. It is designed for short-term trading or scalping.

BTC 5 min SHBHilalimSB A Wedding Gift 🌙
What is HilalimSB🌙?
First of all, as mentioned in the title, HilalimSB is a wedding gift.
HilalimSB - Revealing the Secrets of the Trend
HilalimSB is a powerful indicator designed to help investors analyze market trends and optimize trading strategies. Designed to uncover the secrets at the heart of the trend, HilalimSB stands out with its unique features and impressive algorithm.
Hilalim Algorithm and Fixed ATR Value:
HilalimSB is equipped with a special algorithm called "Hilalim" to detect market trends. This algorithm can delve into the depths of price movements to determine the direction of the trend and provide users with the ability to predict future price movements. Additionally, HilalimSB uses its own fixed Average True Range (ATR) value. ATR is an indicator that measures price movement volatility and is often used to determine the strength of a trend. The fixed ATR value of HilalimSB has been tested over long periods and its reliability has been proven. This allows users to interpret the signals provided by the indicator more reliably.
ATR Calculation Steps
1.True Range Calculation:
+ The True Range (TR) is the greatest of the following three values:
1. Current high minus current low
2. Current high minus previous close (absolute value)
3. Current low minus previous close (absolute value)
2.Average True Range (ATR) Calculation:
-The initial ATR value is calculated as the average of the TR values over a specified period
(typically 14 periods).
-For subsequent periods, the ATR is calculated using the following formula:
ATRt=(ATRt−1×(n−1)+TRt)/n
Where:
+ ATRt is the ATR for the current period,
+ ATRt−1 is the ATR for the previous period,
+ TRt is the True Range for the current period,
+ n is the number of periods.
Pine Script to Calculate ATR with User-Defined Length and Multiplier
Here is the Pine Script code for calculating the ATR with user-defined X length and Y multiplier:
//@version=5
indicator("Custom ATR", overlay=false)
// User-defined inputs
X = input.int(14, minval=1, title="ATR Period (X)")
Y = input.float(1.0, title="ATR Multiplier (Y)")
// True Range calculation
TR1 = high - low
TR2 = math.abs(high - close )
TR3 = math.abs(low - close )
TR = math.max(TR1, math.max(TR2, TR3))
// ATR calculation
ATR = ta.rma(TR, X)
// Apply multiplier
customATR = ATR * Y
// Plot the ATR value
plot(customATR, title="Custom ATR", color=color.blue, linewidth=2)
This code can be added as a new Pine Script indicator in TradingView, allowing users to calculate and display the ATR on the chart according to their specified parameters.
HilalimSB's Distinction from Other ATR Indicators
HilalimSB emerges with its unique Average True Range (ATR) value, presenting itself to users. Equipped with a proprietary ATR algorithm, this indicator is released in a non-editable form for users. After meticulous testing across various instruments with predetermined period and multiplier values, it is made available for use.
ATR is acknowledged as a critical calculation tool in the financial sector. The ATR calculation process of HilalimSB is conducted as a result of various research efforts and concrete data-based computations. Therefore, the HilalimSB indicator is published with its proprietary ATR values, unavailable for modification.
The ATR period and multiplier values provided by HilalimSB constitute the fundamental logic of a trading strategy. This unique feature aids investors in making informed decisions.
Visual Aesthetics and Clear Charts:
HilalimSB provides a user-friendly interface with clear and impressive graphics. Trend changes are highlighted with vibrant colors and are visually easy to understand. You can choose colors based on eye comfort, allowing you to personalize your trading screen for a more enjoyable experience. While offering a flexible approach tailored to users' needs, HilalimSB also promises an aesthetic and professional experience.
Strong Signals and Buy/Sell Indicators:
After completing test operations, HilalimSB produces data at various time intervals. However, we would like to emphasize to users that based on our studies, it provides the best signals in 1-hour chart data. HilalimSB produces strong signals to identify trend reversals. Buy or sell points are clearly indicated, allowing users to develop and implement trading strategies based on these signals.
For example, let's imagine you wanted to open a position on BTC on 2023.11.02. You are aware that you need to calculate which of the buying or selling transactions would be more profitable. You need support from various indicators to open a position. Based on the analysis and calculations it has made from the data it contains, HilalimSB would have detected that the graph is more suitable for a selling position, and by producing a sell signal at the most ideal selling point at 08:00 on 2023.11.02 (UTC+3 Istanbul), it would have informed you of the direction the graph would follow, allowing you to benefit positively from a 2.56% decline.
Technology and Innovation:
HilalimSB aims to enhance the trading experience using the latest technology. With its innovative approach, it enables users to discover market opportunities and support their decisions. Thus, investors can make more informed and successful trades. Real-Time Data Analysis: HilalimSB analyzes market data in real-time and identifies updated trends instantly. This allows users to make more informed trading decisions by staying informed of the latest market developments. Continuous Update and Improvement: HilalimSB is constantly updated and improved. New features are added and existing ones are enhanced based on user feedback and market changes. Thus, HilalimSB always aims to provide the latest technology and the best user experience.
Social Order and Intrinsic Motivation:
Negative trends such as widespread illegal gambling and uncontrolled risk-taking can have adverse financial effects on society. The primary goal of HilalimSB is to counteract these negative trends by guiding and encouraging users with data-driven analysis and calculable investment systems. This allows investors to trade more consciously and safely.
What is BTC 5 min ☆SHB Strategy🌙?
BTC 5 min ☆SHB Strategy is a strategy supported by the HilalimSB algorithm created by the creator of HilalimSB. It automatically opens trades based on the data it receives, maintaining trades with its uniquely defined take profit and stop loss levels, and automatically closes trades when necessary. It stands out in the TradingView world with its unique take profit and stop loss markings. BTC 5 min ☆SHB Strategy is close to users' initiatives and is a strategy suitable for 5-minute trades and scalp operations developed on BTC.
What does the BTC 5 min ☆SHB Strategy target?
The primary goal of BTC 5 min ☆SHB Strategy is to close trades made by traders in short timeframes as profitably as possible and to determine the most effective trading points in low time periods, considering the commission rates of various brokerage firms. BTC 5 min ☆SHB Strategy is one of the rare profitable strategies released in short timeframes, with its useful interface, in addition to existing strategies in the markets. After extensive backtesting over a long period and achieving above-average success, BTC 5 min ☆SHB Strategy was decided to be released. Following the completion of test procedures under market conditions, it was presented to users with the unique visual effects of ☆SB.
BTC 5 min ☆SHB Strategy and Heikin Ashi
BTC 5 min ☆SHB Strategy produces data in Heikin-Ashi chart types, but since Heikin-Ashi chart types have their own calculation method, BTC 5 min ☆SHB Strategy has been published in a way that cannot produce data in this chart type due to BTC 5 min ☆SHB Strategy's ideology of appealing to all types of users, and any confusion that may arise is prevented in this way. Heikin-Ashi chart types, especially in short time intervals, carry significant risks considering the unique calculation methods involved. Thus, the possibility of being misled by the coder and causing financial losses has been completely eliminated. After the necessary conditions determined by the creator of BTC 5 min ☆SHB are met, BTC 5 min ☆SHB Heikin-Ashi will be shared exclusively with invited users only, upon request, to users who request an invitation.
Key Features:
+HilalimSHB Algorithm: This algorithm uses a dynamic ATR-based trend-following mechanism to identify the current market trend. The strategy detects trend reversals and takes positions accordingly.
+Heikin Ashi Compatibility: The strategy is optimized to work only with standard candlestick charts and automatically deactivates when Heikin Ashi charts are in use, preventing false signals.
+Advanced Chart Enhancements: The strategy offers clear graphical markers for buy/sell signals. Candlesticks are automatically colored based on trend direction, making market trends easier to follow.
Strategy Parameters:
+Take Profit (%): Defines the target price level for closing a position and automates profit-taking. The fixed value is set at 2%.
+Stop Loss (%): Specifies the stop-loss level to limit losses. The fixed value is set at 3%.
The shared image is a 5-minute chart of BTCUSDC.P with a fixed take profit value of 2% and a fixed stop loss value of 3%. The trades are opened with a commission rate of 0.063% set for the USDT trading pair on Binance.🌙

Thrax - QuickStrike 5-Mins Scalping** Indicator Description **
1. Price Change Threshold (%) – The minimum price change required for a candle to be recognized as significant. Candles exceeding this threshold are considered potential candidates for zone creation. Default value for 5 min is 0.5%. As you move on higher timeframe the threshold should increase
2. Percentage Change for Zones (%) – The amount of price movement needed to form a dynamic support or resistance zone. Tweak this to control how sensitive the indicator is to price fluctuations. 5 min default value is 1%. For 15 min suggested is 2-3%.
3. Break Threshold for Zones (%) – Defines how much price must break above or below a zone for it to be removed from the chart/mitigated. Keeps the chart clean by removing invalidated zones. Default value is 0.1% in 5 min, for 15 min it is 0.5%.
4. Buy Zone Retracement Level (%) – The percentage retracement level for defining the inner buy zone within a broader bullish zone. Ideal for timing precision entries. Ideal value is 75%
5. Sell Zone Retracement Level (%) – The percentage retracement level used to determine the inner sell zone within a larger bearish zone. Helps in identifying potential reversal areas or exits. Ideal value is 25%
By tailoring these inputs, traders can fully customize the indicator to suit their scalping strategies, enhancing their ability to navigate fast-moving markets with confidence.
---------------------------------------------------------------------------
There are two primary approaches for scalping using this indicator:
1. Candle-Based Scalping:
a. Bullish Signal: When you observe a bullish candle highlighted in blue (by default), you can consider entering a long position at the close of this candle. It’s advisable to wait for the candle to close before taking action. For a more aggressive scalp, you might take profits based on your scalp target after a few subsequent candles. If the price remains stagnant or moves unfavorably in the next few candles, you can exit with a small loss. Alternatively, if you have a higher risk tolerance, you may hold the position even if the price initially declines within a set percentage.
b. Bearish Signal: For a bearish candle highlighted in yellow, you can enter a short trade at the close of the candle. Similar to the bullish setup, you have the option to exit after a few candles if the price doesn’t move as expected or hold the position with a higher risk tolerance if the price goes up initially.
2. Zone-Based Scalping:
Entering Zones: Monitor the price as it enters a defined support or resistance zone. If you are open to higher risk, you can enter a trade immediately upon the price entering the zone. For a more cautious approach with a smaller stop loss, wait for the price to reach a retracement level within the zone before initiating your trade. This approach allows for a more precise entry but may result in missing out on trades if the price reverses before hitting the retracement level. Conversely, entering at the zone’s boundary offers the potential for early trade capture but comes with a higher stop loss risk.
Adjust these strategies based on your risk tolerance and trading preferences to optimize your scalping opportunities.

TradeBuilderOverview
TradeBuilder is an ever-growing toolbox that lets you combine and compound any number of bundled indicators and algorithms to create a compound strategy. At launch, we're including two Moving Averages (SMA, EMA), RSI, and Stochastic Oscillator, with many more to come. You can use any combination of indicators, be it just one, two, or all.
Key Concepts
Indicator Integration: Tradebuilder allows the use of Moving Averages, RSI, and Stochastic Oscillators, with customizable parameters for each. More indicators to come.
Mode Selection : Choose between Confirm Trend Mode (using indicators to confirm trends) and Momentum Mode (using indicators to spot reversals).
Trade Flexibility : Offers options for both long and short trades, enabling diverse trading strategies.
Customizable Inputs : Easily toggle indicators on or off and adjust specific settings like periods and thresholds.
Signal Generation : Combines multiple conditions to generate entry and exit signals.
Input Parameters:
Moving Average (MA):
use_ma : Enable this to include the Moving Average in your strategy.
ma_cross_type : Choose between "Close/MA" (price crossing the MA) or "MA/MA" (one MA crossing another).
ma_length : Set the period for the primary MA.
ma_type : Choose between "SMA" (Simple Moving Average) or "EMA" (Exponential Moving Average).
ma_length2 : Set the period for the secondary MA if using the "MA/MA" cross type.
ma_type2 : Set the type for the secondary MA.
Relative Strength Index (RSI):
use_rsi : Enable this to include RSI in your strategy.
rsi_length : Set the period for RSI calculation.
rsi_overbought : Define the overbought level.
rsi_oversold : Define the oversold level.
Stochastic Oscillator:
use_stoch : Enable this to include the Stochastic Oscillator in your strategy.
stoch_k : Set the %K period.
stoch_d : Set the %D period.
stoch_smooth : Define the smoothing factor.
stoch_overbought : Set the overbought level.
stoch_oversold : Set the oversold level.
Confirmation or Momentum Mode:
confirm_trend : Set this to true to use RSI and Stochastic Oscillator to confirm trends (long when above overbought, short when below oversold). Set to false to trade on momentum (short when above overbought, long when below oversold).
Tip: When set to false and used with just momentum oscillators like Stochastic or RSI, it's geared toward scalping as it essentially becomes momentum trading.
Trade Directions:
trade_long : Enable to allow long trades.
trade_short : Enable to allow short trades.
Example Strategy on E-mini S&P 500 Index Futures ( CME_MINI:ES1! ), 1-minute Chart
Let’s say you want to create a strategy to go long when:
A 5-period SMA crosses above a 100-period EMA.
RSI is above 20.
The Stochastic Oscillator is above 95.
Trend Confirmation Mode is on.
For short:
A 5-period SMA crosses below a 100-period EMA.
RSI is below 45.
The Stochastic Oscillator is below 5.
Trend Confirmation Mode is on.
Here’s how you would set it up in Tradebuilder:
use_ma = true
ma_cross_type = "MA/MA"
ma_length = 5
ma_type = "SMA"
ma_length2 = 100
ma_type2 = "EMA"
use_rsi = true
rsi_length = 14
rsi_overbought = 20
rsi_oversold = 45
use_stoch = true
stoch_k = 8
stoch_d = 1
stoch_smooth = 1
stoch_overbought = 95
stoch_oversold = 5
confirm_trend = true
trade_long = true
trade_short = false
Alerts
Here is how to set TradeBuilder alerts: open a TradingView chart, attach TradeBuilder, right-click on chart -> Add Alert. Condition: Symbol (e.g. NQ) >> TradeBuilder >> Open-Ended Alert >> Once Per Bar Close.
Development Roadmap
We plan to add many more compoundable indicators to TradeBuilder over the coming months from all walks of technical analysis, including Volume, Volatility, Trend Detection/Validation, Momentum, Divergences, Chart Patterns, Support/Resistance Analysis. etc.

Heikin Ashi Price DetectionThis script performs custom calculations for both bullish and bearish bars, providing a numerical result that can be used to gauge price movements and potential trading signals.
How It Works
Bullish Bars:
Calculates the absolute difference between the open and low prices (BullOpenLow).
Calculates the absolute difference between the high and close prices (BullHighClose).
Compares BullOpenLow and BullHighClose:
If BullOpenLow is greater, the difference is divided by BullOpenLow.
If BullHighClose is greater, the difference is divided by BullHighClose.
The result is normalized to a percentage and subtracted from 100 to produce a final value.
Bearish Bars:
Calculates the absolute difference between the close and low prices (BearCloseLow).
Calculates the absolute difference between the high and open prices (BearHighOpen).
Compares BearCloseLow and BearHighOpen:
If BearCloseLow is greater, the difference is divided by BearCloseLow.
If BearHighOpen is greater, the difference is divided by BearHighOpen.
The result is normalized to a percentage and subtracted from 100 to produce a final value.
Key Features
Bullish and Bearish Calculations: The script identifies bullish and bearish bars and applies separate calculations to each.
Normalized Results: The calculations provide a normalized result that can be easily interpreted.
Visual Representation: Results are plotted on the chart for quick visual reference.

Advanced Gold Scalping Strategy with RSI Divergence# Advanced Gold Scalping Strategy with RSI Divergence
## Overview
This Pine Script implements an advanced scalping strategy for gold (XAUUSD) trading, primarily designed for the 1-minute timeframe. The strategy utilizes the Relative Strength Index (RSI) indicator along with its moving average to identify potential trade setups based on divergences between price action and RSI movements.
## Key Components
### 1. RSI Calculation
- Uses a customizable RSI length (default: 60)
- Allows selection of the source for RSI calculation (default: close price)
### 2. Moving Average of RSI
- Supports multiple MA types: SMA, EMA, SMMA (RMA), WMA, VWMA, and Bollinger Bands
- Customizable MA length (default: 3)
- Option to display Bollinger Bands with adjustable standard deviation multiplier
### 3. Divergence Detection
- Implements both bullish and bearish divergence identification
- Uses pivot high and pivot low points to detect divergences
- Allows for customization of lookback periods and range for divergence detection
### 4. Entry Conditions
- Long Entry: Bullish divergence when RSI is below 40
- Short Entry: Bearish divergence when RSI is above 60
### 5. Trade Management
- Stop Loss: Customizable, default set to 11 pips
- Take Profit: Customizable, default set to 33 pips
### 6. Visualization
- Plots RSI line and its moving average
- Displays horizontal lines at 30, 50, and 70 RSI levels
- Shows Bollinger Bands when selected
- Highlights divergences with "Bull" and "Bear" labels on the chart
## Input Parameters
- RSI Length: Adjusts the period for RSI calculation
- RSI Source: Selects the price source for RSI (close, open, high, low, hl2, hlc3, ohlc4)
- MA Type: Chooses the type of moving average applied to RSI
- MA Length: Sets the period for the moving average
- BB StdDev: Adjusts the standard deviation multiplier for Bollinger Bands
- Show Divergence: Toggles the display of divergence labels
- Stop Loss: Sets the stop loss distance in pips
- Take Profit: Sets the take profit distance in pips
## Strategy Logic
1. **RSI Calculation**:
- Computes RSI using the specified length and source
- Calculates the chosen type of moving average on the RSI
2. **Divergence Detection**:
- Identifies pivot points in both price and RSI
- Checks for higher lows in RSI with lower lows in price (bullish divergence)
- Checks for lower highs in RSI with higher highs in price (bearish divergence)
3. **Trade Entry**:
- Enters a long position when a bullish divergence is detected and RSI is below 40
- Enters a short position when a bearish divergence is detected and RSI is above 60
4. **Position Management**:
- Places a stop loss order at the entry price ± stop loss pips (depending on the direction)
- Sets a take profit order at the entry price ± take profit pips (depending on the direction)
5. **Visualization**:
- Plots the RSI and its moving average
- Draws horizontal lines for overbought/oversold levels
- Displays Bollinger Bands if selected
- Shows divergence labels on the chart for identified setups
## Usage Instructions
1. Apply the script to a 1-minute XAUUSD (Gold) chart in TradingView
2. Adjust the input parameters as needed:
- Increase RSI Length for less frequent but potentially more reliable signals
- Modify MA Type and Length to change the sensitivity of the RSI moving average
- Adjust Stop Loss and Take Profit levels based on current market volatility
3. Monitor the chart for Bull (long) and Bear (short) labels indicating potential trade setups
4. Use in conjunction with other analysis and risk management techniques
## Considerations
- This strategy is designed for short-term scalping and may not be suitable for all market conditions
- Always backtest and forward test the strategy before using it with real capital
- The effectiveness of divergence-based strategies can vary depending on market trends and volatility
- Consider using additional confirmation signals or filters to improve the strategy's performance
Remember to adapt the strategy parameters to your risk tolerance and trading style, and always practice proper risk management.

Buy-Sell Volume Bar Gauge [By MUQWISHI]▋ INTRODUCTION :
The Buy-Sell Volume Bar Gauge is developed to provide traders with a detailed analysis of volume in bars using a low timeframe, such as a 1-second interval, to measure the dominance of buy and sell for each bar. By highlighting the balance between buying and selling activities, the Buy-Sell Volume Bar Gauge helps traders identify potential volume momentum of a bar; aimed at being a useful tool for day traders and scalpers.
_______________________
▋ OVERVIEW:
_______________________
▋ METHODOLOGY:
The concept is based on bars from a lower timeframe within the current chart timeframe bar, where volume is categorized into Up, Down, and Neutral Volume, with each one displayed as a portion of a column plot. Up Volume is recorded when the price experiences a positive change, Down Volume occurs when the price experiences a negative change, and Neutral Volume is observed when the price shows no significant change.
_______________________
▋ INDICATOR SETTINGS:
(1) Fetch data from the selected lower timeframe. Note: If the selected timeframe is invalid (higher than chart), the indicator will automatically switch to 1 second.
(2) Price Source.
(3) Treating Neutral Data (Price Source) as
Neutral: In a lower timeframe, when the bar has no change in its price, the volume is counted as Neutral Volume.
Previous Move: In a lower timeframe, when the bar has no change in its price, the volume is counted as the previous change; “Up Volume” if the previous change was positive, and “Down Volume” if the previous change was negative.
Opposite Previous Move: In a lower timeframe, when the bar has no change in its price, the volume is counted as the opposite previous change; “Up Volume” if the previous change was negative, and “Down Volume” if the previous change was positive.
(4) Average Volume Length, it's used for lighting/darkening columns in a plot.
(5) Enable Alert.
(7) Total bought (%) Level.
(8) Total Sold (%) Level.
_____________________
▋ COMMENT:
The Buy-Sell Volume Bar Gauge can be taken as confirmation for predicting the next move, but it should not be considered a major factor in making a trading decision.

Sniper BreakoutThis indicator is based on 3 indicator :=
1) Forex Market Session 2) Ema 200 3) Volume
This indicator is for Forex market ..in Forex market (ex- Eur/Usd ) price often (67%) do rotation in every session means example :let suppose a trade take trade in asian session and have 30 pips stop loss 67 % chance price will come back to entry price after London session or New York session so trade have less chance to make trade without hitting stop loss
in this indicator we are using Forex market session indicator to get session range start to end ..this indicator will only search opportunity in London And New York Session range and that can be customize from input section . user can select time zone and time of session from input section indicator and color of session .
next indicator using 200 length Exponential Moving Average for trend identification .if close price is above 200 Ema means trend is upside moving & if close price is below 200 Ema means price is moving downside .user can change length and source of Ema from input section .
Third and most important part is volume indicator when a session start (Example-London session it keep Look back 6 previous candle and compare volume imbalance between look back candle .look back candle can be customize from input section default look back candle input is (6).
next we are using trade range time to only show trade on certain time because often market convert into trading range so given specific input time it only take trade when volume and price is rising or falling .time range can be selected from input section .
Trade Entry Buy Signal -if price is either London or New York session and price is above 200 Ema and volume not in imbalance last number of candle it give Feb (first entry buy ) we keep save high price of every candle after Feb (label ) signal .if any candle break above Feb label it show a confirm buy signal ..Below in example as we can see
Example Image Buy Signal -
in this above example step -1 we searching imbalance of volume and price as we can see imbalance of volume and price on green candle .next we look price is above 200 ema .next step(2) we got Feb (first entry buy ) signal this is not a confirm buy signal .we save high of candle next candle high close above previous candle high we got confirm buy signal .
Trade Entry Sell Signal - if price is either London or New York session and price is below 200 Ema and volume not in imbalance last number of candle it give Feb (first entry Sell ) we keep save low price of every candle after Fes (label ) signal .if any candle break below Fes label it show a confirm sell signal ..Below in example as we can see
step-1 starting of london session we start getting imbalance between price and volume .price is getting rejected but volume is rising on green candle we got fes (first entry sell signal ).next we save low of fes candle but price close above that low of candle we dont get confirm sell entry next price break below low of previous candle so open a new sell signal ..
Example 3 - No Confirm buy/sell Signal
In this above Image example we did not get any confirm signal...we got first entry buy signal but price did not close high of candle in london session .so that day chance price can go any side ..
Example 4 -Feb signal and later confirm buy entry
in this above example we got imbalance of volume and feb(first entry buy signal) but we dont get any confirm buy signal price is just going high then previous candle ..later we see price crossover high of previous candle we got confirm buy signal
Use Of Indicator - This indicator helps traders identify potential trade setups by signaling the first entry points and confirming them later. It's particularly useful for avoiding getting caught in price rotations and aligning trades with significant volume and price movements. Traders should analyze price action and news before confirming a trade.

ORB Heikin Ashi SPY 5min Correlation StrategyOverview:
The ORB (Opening Range Breakout) strategy combined with Heikin Ashi candles and Relative Volume (RVOL) indicator aims to capitalize on significant price movements that occur shortly after the market opens. This strategy identifies breakouts above or below the opening range, using Heikin Ashi candles for smoother price visualization and RVOL to gauge the strength of the breakout.
Components:
Opening Range Breakout (ORB): The strategy starts by defining the opening range, typically the first few minutes of the trading session. It then identifies breakouts above the high or below the low of this range as potential entry points.
Heikin Ashi Candles: Heikin Ashi candles are used to provide a smoother representation of price movements compared to traditional candlesticks. By averaging open, close, high, and low prices of the previous candle, Heikin Ashi candles reduce noise and highlight trends more effectively.
Relative Volume (RVOL): RVOL compares the current volume of a stock to its average volume over a specified period. It helps traders identify abnormal trading activity, which can signal potential price movements.
Candle for correlation : In this case we are using SPY candles. It can also use different asset
Strategy Execution:
Initialization: The strategy initializes by setting up variables and parameters, including the ORB period, session timings, and Heikin Ashi candle settings.
ORB Calculation: It calculates the opening range by identifying the high and low prices during the specified session time. These values serve as the initial reference points for potential breakouts. For this we are looking for the first 30 min of the US opening session.
After that we are going to use the next 2 hours to check for breakout opportunities.
Heikin Ashi Transformation: Optionally, the strategy transforms traditional candlestick data into Heikin Ashi format for smoother visualization and trend identification.
Breakout Identification: It continuously monitors price movements within the session and checks if the current high breaches the ORB high or if the current low breaches the ORB low. These events trigger potential long or short entry signals, respectively.
RVOL Analysis: Simultaneously, the strategy evaluates the relative volume of the asset to gauge the strength of the breakout. A surge in volume accompanying the breakout confirms the validity of the signal. In this case we are looking for at least a 1 value of the division between currentVolume and pastVolume
Entry and Exit Conditions: When a breakout occurs and is confirmed by RVOL and is within our session time, the strategy enters a long or short position accordingly. It does not have a stop loss or a takie profit level, instead it will always exit at the end of the trading session, 5 minutes before
Position Sizing and Commissions: For the purpose of this backtest, the strategy allocated 10% of the capital for each trade and assumes a trading commission of 0.01$ per share ( twice the IBKR broker values)
Session End: At the end of the trading session, the strategy closes all open positions to avoid overnight exposure.
Conclusion:
The combination of ORB breakout strategy, Heikin Ashi candles, and RVOL provides traders with a robust framework for identifying and capitalizing on early trends in the market. By leveraging these technical indicators together, traders can make more informed decisions and improve the overall performance of their trading strategies. However, like any trading strategy, it's essential to backtest thoroughly and adapt the strategy to different market conditions to ensure its effectiveness over time.

BINANCE-BYBIT Cross Chart: Spot-Perpetual CorrelationName: "Binance-Bybit Cross Chart: Spot-Perpetual Correlation"
Category: Scalping, Trend Analysis
Timeframe: 1M, 5M, 30M, 1D (depending on the specific technique)
Technical analysis: This indicator facilitates a comparison between the price movements shown on the Binance spot chart and the Bybit perpetual chart, with the aim of discerning the correlation between the two charts and identifying the dominant market trends. It automatically generates the corresponding chart based on the ticker selected in the primary chart. When a Binance pair is selected in the main chart, the indicator replicates the Bybit perpetual chart for the same pair and timeframe, and vice versa, selecting the Bybit perpetual chart as the primary chart generates the Binance spot chart.
Suggested use: You can utilize this tool to conduct altcoin trading on Binance or Bybit, facilitating the comparison of price actions and real-time monitoring of trigger point sensitivity across both exchanges. We recommend prioritizing the Binance Spot chart in the main panel due to its typically longer historical data availability compared to Bybit.
The primary objective is to efficiently and automatically manage the following three aspects:
- Data history analysis for higher timeframes, leveraging the extensive historical data of the Binance spot market. Variations in indicators such as slow moving averages may arise due to differences in historical data between exchanges.
- Assessment of coin liquidity on both exchanges by observing candlestick consistency on smaller timeframes or the absence of gaps. In the crypto market, clean charts devoid of gaps indicate dominance and offer enhanced reliability.
- Identification of precise trigger point levels, including daily, previous day, or previous week highs and lows, which serve as sensitive areas for breakout or reversal operations.
All-Time High (ATH) and All-Time Low (ATL) levels may vary significantly across exchanges due to disparities in historical data series.
This tool empowers traders to make informed decisions by leveraging historical data, liquidity insights, and precise trigger point identification across Binance Spot and Bybit Perpetual market.
Configuration:
EMA length:
- EMA 1: Default 5, user configurable
- EMA 2: Default 10, user configurable
- EMA 3: Default 60, user configurable
- EMA 4: Default 223, user configurable
- Additional Average: Optional display of an additional average, such as a 20-period average.
Chart Elements:
- Session separator: Indicates the beginning of the current session (in blue)
- Background: Indicates an uptrend (60 > 223) with a green background and a downtrend (60 < 223) with a red background.
Instruments:
- EMA Daily: Shows daily averages on an intraday timeframe.
- EMA levels 1h - 30m: Shows the levels of the 1g-30m EMAs.
- EMA Levels Highest TF: Provides the option to select additional EMA levels from the major timeframes, customizable via the drop-down menu.
- "Hammer Detector: Marks hammers with a green triangle and inverted hammers with a red triangle on the chart
- "Azzeramento" signal on TF > 30m: Indicates a small candlestick on the EMA after a dump.
- "No Fomo" signal on TF < 30m: Indicates a hyperextended movement.
Trigger Points:
- Today's highs and lows: Shows the opening price of the day's candlestick, along with the day's highs and lows (high in purple, low in red, open in green).
- Yesterday's highs and lows: Displays the opening price of the daily candlestick, along with the previous day's highs and lows (high in yellow, low in red).
You can customize the colors in "Settings" > "Style".
It is best used with the Scalping The Bull indicator on the main panel.
Credits:
@tumiza999: for tests and suggestions.
Thanks for your attention, happy to support the TradingView community.

[AlbaTherium] MTF External Ranges Analysis - ERA-Orion for SMC MTF External Ranges Analysis - ERA - Orion for Smart Money Concepts
Introduction:
The MTF External Ranges Analysis - ERA - Orion offers enhanced insights into multi-timeframe external structure points, swing structure points, POIs (Points of Interest), and order blocks (OB) . By incorporating this enhancement, your multi-timeframe analysis are streamlined, simplifying the process and reducing chart workload, no need for manual chart drawing anymore, stay focus on Low Time Frame and get High Time Frame insights in one single Time frame.
This identification process remains effective even when focusing on Lower Time Frames (LTF), providing detailed insights without sacrificing the broader market perspective.
The MTF External Ranges Analysis - ERA – Orion is specifically designed to be used in conjunction with OptiStruct™ Premium for Smart Money Concepts . This strategic combination enhances the workflow of identifying optimal entry points. OptiStruct acts as the analysis tool for Lower Time Frames (LTF), zeroing in on immediate interest areas, while Orion expands this analysis to Higher Time Frames (HTF), providing a broader view of market trends and importants key levels . The integration of Orion with OptiStruct seamlessly merges LTF and HTF analyses, ensuring a thorough understanding of market dynamics for informed and strategic decision-making. This toolkit in one package assembly is pivotal for traders relying on Smart Money Concepts, offering unmatched clarity and actionable insights to navigate the markets effectively.
This tool offers an advanced smart money technical analysis to improve your trading experience. It introduces four key concepts:
Main Features:
Entries Enhancements
Inducements HTF
High/Low Markings HTF
Multiple Timeframes and Confluences on Extreme, Dec and SMT Order Blocks
By integrating these concepts into one, traders can identify high-probability zones across multiple timeframes and develop a thorough understanding of market dynamics. These confluence zones enhance order block skills and potential, establishing them as essential pillars in smart money trading strategies and enabling traders to make more informed decisions.
Settings Overview:
HTF Settings Enable HTF Analysis
Select timeframe {Select or 4H Chart}
Labels Alignment for Lines and Boxes
Inside bar ranges HTF
Break of Structure /Change of Character HTF
Inducements HTF
High/Low Markings HTF
High/Low Sweeps HTF
Extreme Order Blocks HTF
Decisional Order Blocks HTF
Smart Money Traps HTF
IDM Demands and Supplies HTF
Historical Order Blocks HTF
OB Mitigation HTF {touch/ extended}
Understanding the Features:
Chapter 1: Entries Enhancements
In this chapter, we delve into strategies to refine trading entries, focusing on the multi-timeframe analysis of extreme or decisional order blocks in the High Time Frame timeframe as a key point of interest. We highlight the significance of transitioning to the Low Time Frame chart for observing pivotal shifts in market behavior. By examining these concepts, traders can gain deeper insights into market dynamics and make more informed entries decisions at critical junctures.
Practical Example:
We had an Order Block Extreme on the 1-hour timeframe, and currently, we are on the recommended chart for trade entry, which is the 5-minute timeframe. We are patiently waiting to observe a 5-minute ChoCh in the market to enter a buying position since it's an OB Extreme Demand on the 1-hour timeframe. Here, it's crucial and important to focus on the entry timeframe rather than checking what's happening in the higher timeframe. The indicator facilitates this task as it provides us with real-time perspective and visibility of everything happening in the higher timeframe.
Chapter 2: Inducements HTF
It is important and useful to be aware of the various liquidity points across the different timeframes we use; sometimes, a reliable entry point in the Lower Time Frame (LTF) may be surrounded by inducements. Consequently, this point becomes unreliable, and prior to the arrival of this functionality, such anomalies could not be detected, especially when focusing on the market in the LTF. From now on, there will be no more such issues.
Practical Example:
Suppose we identify an Order Block Extreme on the 5M timeframe, indicating a potential entry level. However, when we switch to the 5M timeframe to look for an entry point, we observe an accumulation of inducements around this Order Block coming from a higher timeframe, whether it's M15 or H1. This suggests a potential weakness in the entry point and significant market liquidity, which will act as a trap zone. Before the introduction of this feature, we might have missed this crucial observation, but now we can detect these anomalies and adjust our strategy accordingly.
The only practical way to see theses confluences is to use this Indicator, see the example below
Chapter 03: High/Low – Bos - ChoCh Markings HTF
The High/Low Markings HTF feature in the MTF External Ranges Analysis - ERA - Orion provides a comprehensive view into the market's heartbeat across different timeframes, right from within the convenience of the Lower Time Frame (LTF). It meticulously highlights pivotal shifts, allowing traders to seamlessly discern market sentiment and anticipate potential price reversals without needing to toggle between multiple charts. This innovation ensures that critical market movements and sentiment across various timeframes are visible and actionable from a single, focused LTF perspective, enhancing decision-making and strategic planning in trading activities.
Understanding High/Low Markings in HTF Analysis
High/Low Markings in High Time Frame (HTF) analysis mark the market's extremities within a given period, pinpointing potential areas for reversals or continuation and delineating crucial support and resistance levels. These markings are not arbitrary but represent significant market responses, serving as essential indicators for traders and analysts to gauge market momentum and sentiment.
The Role of HTF in Market Analysis
HTF analysis extends a comprehensive view over market movements, distinguishing between ephemeral fluctuations and substantial trend shifts. By scrutinizing these high and low points across wider time frames, analysts can unravel the underlying market momentum, enabling more strategic, informed trading decisions.
Identifying High/Low Markings
Identifying these crucial points entails detailed chart analysis over extended durations—daily, weekly, or monthly. The search focuses on the utmost highs and lows within these periods, which are more than mere points on a chart. They are significant market levels that have historically elicited robust market reactions, serving as key indicators for future market behavior.
Real-world Example:
Chapter 04: Multiple Timeframes and Confluences on Extreme, Dec and SMT Order Blocks Across HTF
The Orion indicator serves as a bridge between the multiple dimensions of the market, enabling a unified and strategic interpretation of potential movements. It's an indispensable tool for those seeking to capitalize on major opportunity zones, where the convergence of diverse perspectives creates ideal conditions for significant market movements.
Designed to navigate through the data of different timeframes and market analysis, Orion provides a clear and consolidated view of major points of interest. With this indicator, traders can not only spot opportunity zones where consensus is strongest but also adjust their strategies based on the dynamic interaction of various market participants, all while remaining within the Lower Time Frame (LTF).
Conclusion:
MTF External Ranges Analysis - ERA - Orion for Smart Money Concepts as “ The Orion ” indicator captures consensus among scalpers, day traders , swing traders, and investors, turning key areas into major opportunities. It allows for precise identification of areas of interest by analyzing the convergence of actions from various market participants. In short, Orion is crucial for detecting and leveraging the most promising points of convergence in the market.
This identification occurs even while focusing on Lower Time Frames (LTF), allowing for detailed insights without losing the broader market perspective.
This document provides an extensive overview of MTF External Ranges Analysis - ERA - Orion , emphasizing its importance in comprehending market dynamics and utilizing essential smart money concepts trading principles.
