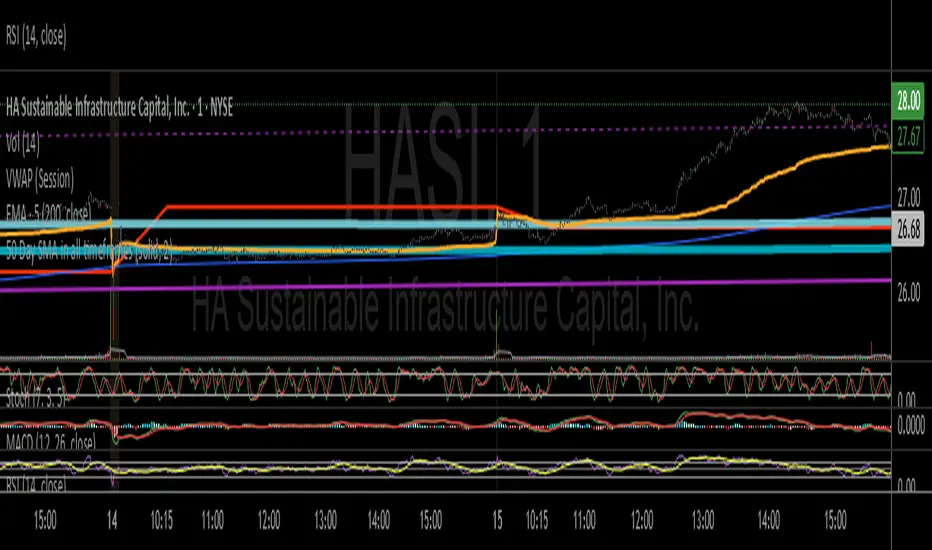
50 Day SMA in all timeframesThis script displays a 50 day SMA that displays correctly on all timeframes and adjusts when the chart is enlarged or reduced. Line color, style, etc are user adjustable. Default is blue thin line.
Cerca negli script per "信达证券能涨到50元吗"
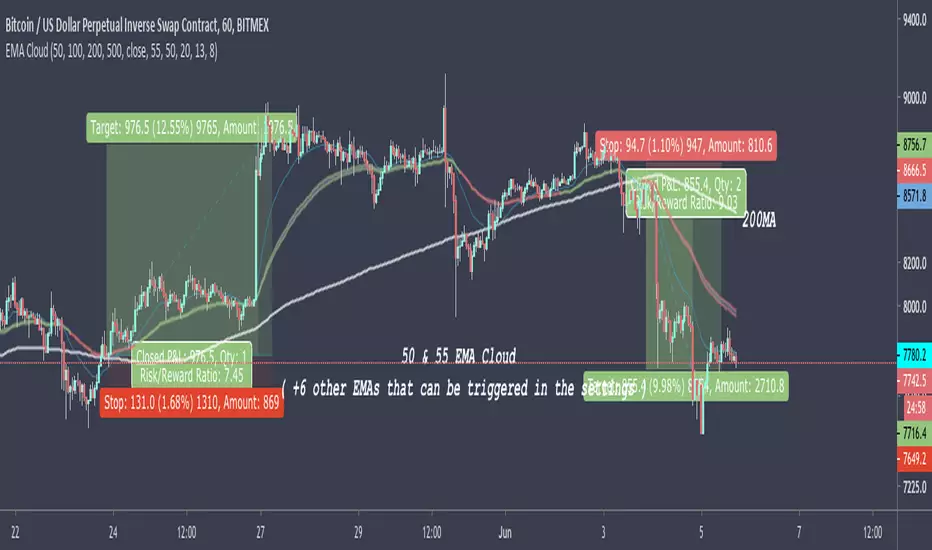
50 & 55 EMA CloudAfter testing thousands of indicators over the years, this simple EMA cloud indicator that I built is still my main weapon. It's always the first one I add to a blank charts and that is not going to change anytime soon.
I find EMAs and MAs are such underrated tools, By observing the price action surrounding these, I can see straight away if it's a good time to get into a trade or not.
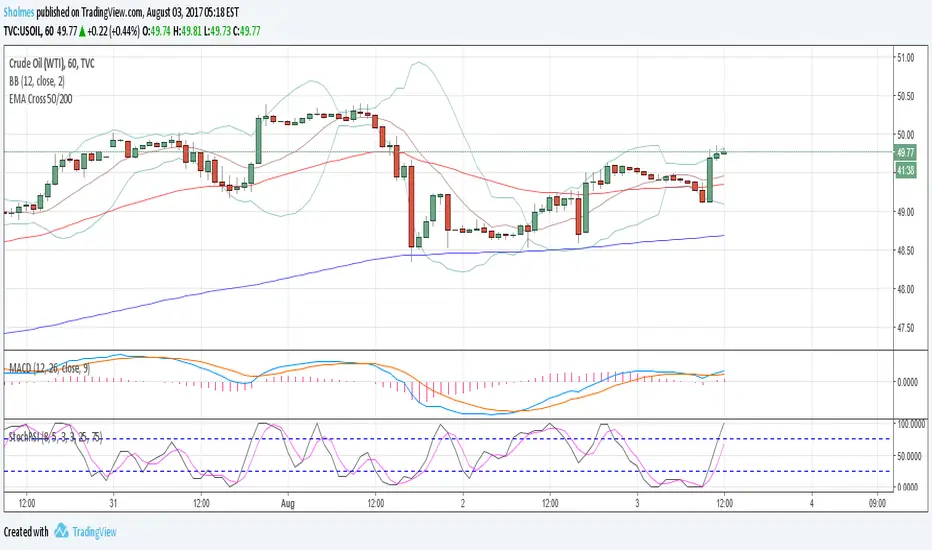
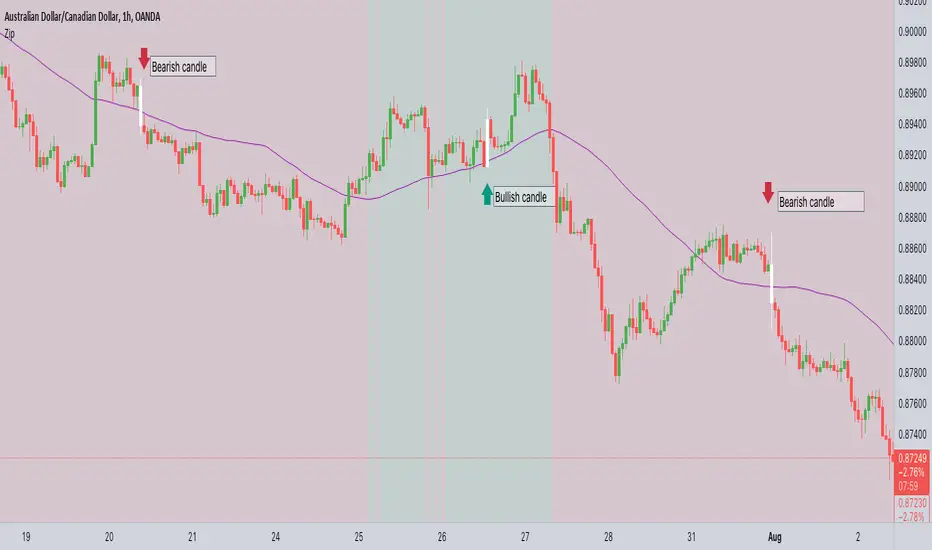
As seen here, I also use the 200MA along with the 50/55EMA cloud to find extra strong support and resistances. If price starts to reject both the cloud and the 200MA at the same time/level, then it's a very good indication the price is going to make a big move in that direction as seen here in this chart.
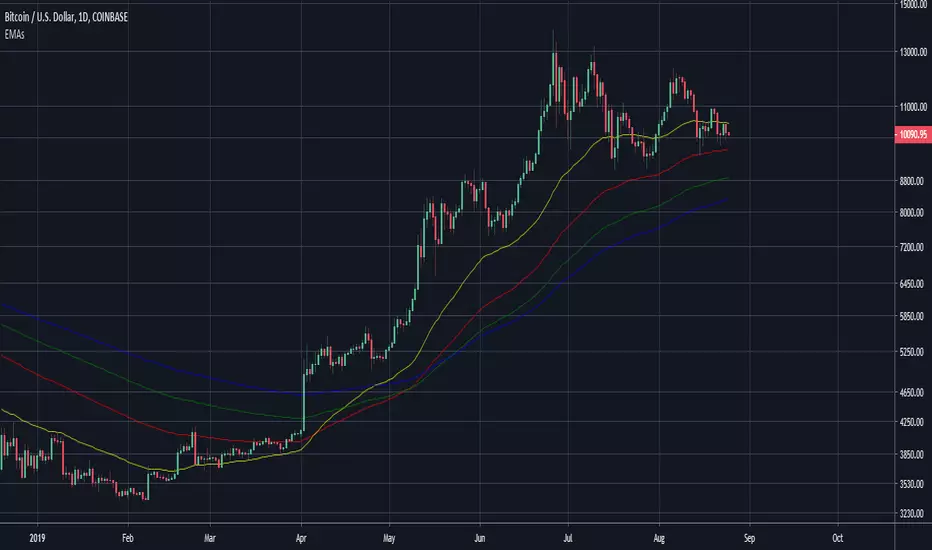
50, 100, 200 EMAsA simple script that displays the 50, 100, and 200-period exponential moving averages. Reduce clutter by combining them into one indicator!

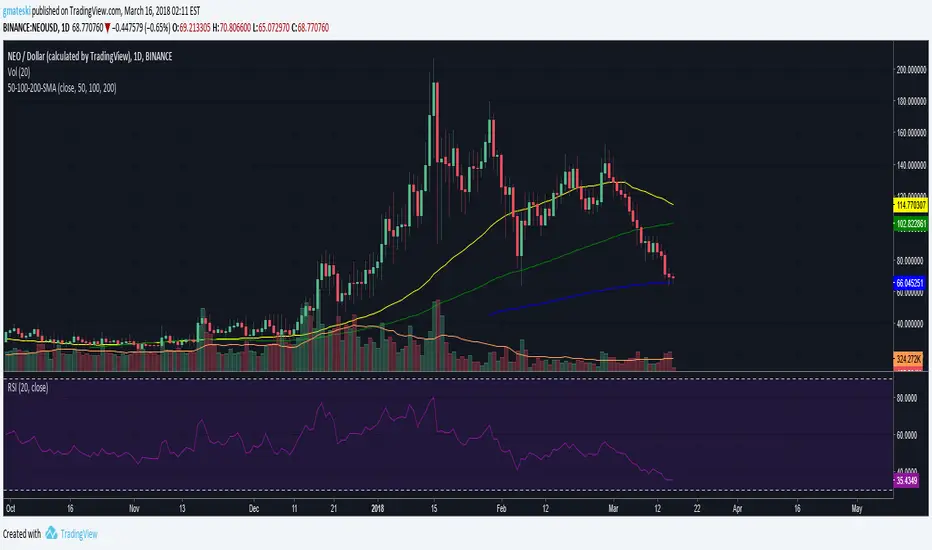
50, 100, 200 SMAsA simple script that displays the 50, 100, and 200-period simple moving averages. Reduce clutter by combining them into one indicator!

50,100,200 MA by CryptoLife71(FIXED)Updated the code by CryptoLife71 so that the 200ma shows correctly.

ADR% Extension Levels from SMA 50I created this indicator inspired by RealSimpleAriel (a swing trader I recommend following on X) who does not buy stocks extended beyond 4 ADR% from the 50 SMA and uses extensions from the 50 SMA at 7-8-9-10-11-12-13 ADR% to take profits with a 20% position trimming.
RealSimpleAriel's strategy (as I understood it):
-> Focuses on leading stocks from leading groups and industries, i.e., those that have grown the most in the last 1-3-6 months (see on Finviz groups and then select sector-industry).
-> Targets stocks with the best technical setup for a breakout, above the 200 SMA in a bear market and above both the 50 SMA and 200 SMA in a bull market, selecting those with growing Earnings and Sales.
-> Buys stocks on breakout with a stop loss set at the day's low of the breakout and ensures they are not extended beyond 4 ADR% from the 50 SMA.
-> 3-5 day momentum burst: After a breakout, takes profits by selling 1/2 or 1/3 of the position after a 3-5 day upward move.
-> 20% trimming on extension from the 50 SMA: At 7 ADR% (ADR% calculated over 20 days) extension from the 50 SMA, takes profits by selling 20% of the remaining position. Continues to trim 20% of the remaining position based on the stock price extension from the 50 SMA, calculated using the 20-period ADR%, thus trimming 20% at 8-9-10-11 ADR% extension from the 50 SMA. Upon reaching 12-13 ADR% extension from the 50 SMA, considers the stock overextended, closes the remaining position, and evaluates a short.
-> Trailing stop with ascending SMA: Uses a chosen SMA (10, 20, or 50) as the definitive stop loss for the position, depending on the stock's movement speed (preferring larger SMAs for slower-moving stocks or for long-term theses). If the stock's closing price falls below the chosen SMA, the entire position is closed.
In summary:
-->Buy a breakout using the day's low of the breakout as the stop loss (this stop loss is the most critical).
--> Do not buy stocks extended beyond 4 ADR% from the 50 SMA.
--> Sell 1/2 or 1/3 of the position after 3-5 days of upward movement.
--> Trim 20% of the position at each 7-8-9-10-11-12-13 ADR% extension from the 50 SMA.
--> Close the entire position if the breakout fails and the day's low of the breakout is reached.
--> Close the entire position if the price, during the rise, falls below a chosen SMA (10, 20, or 50, depending on your preference).
--> Definitively close the position if it reaches 12-13 ADR% extension from the 50 SMA.
I used Grok from X to create this indicator. I am not a programmer, but based on the ADR% I use, it works.
Below is Grok from X's description of the indicator:
Script Description
The script is a custom indicator for TradingView that displays extension levels based on ADR% relative to the 50-period Simple Moving Average (SMA). Below is a detailed description of its features, structure, and behavior:
1. Purpose of the Indicator
Name: "ADR% Extension Levels from SMA 50".
Objective: Draw horizontal blue lines above and below the 50-period SMA, corresponding to specific ADR% multiples (4, 7, 8, 9, 10, 11, 12, 13). These levels represent potential price extension zones based on the average daily percentage volatility.
Overlay: The indicator is overlaid on the price chart (overlay=true), so the lines and SMA appear directly on the price graph.
2. Configurable Inputs
The indicator allows users to customize parameters through TradingView settings:
SMA Length (smaLength):
Default: 50 periods.
Description: Specifies the number of periods for calculating the Simple Moving Average (SMA). The 50-period SMA serves as the reference point for extension levels.
Constraint: Minimum 1 period.
ADR% Length (adrLength):
Default: 20 periods.
Description: Specifies the number of days to calculate the moving average of the daily high/low ratio, used to determine ADR%.
Constraint: Minimum 1 period.
Scale Factor (scaleFactor):
Default: 1.0.
Description: An optional multiplier to adjust the distance of extension levels from the SMA. Useful if levels are too close or too far due to an overly small or large ADR%.
Constraint: Minimum 0.1, increments of 0.1.
Tooltip: "Adjust if levels are too close or far from SMA".
3. Main Calculations
50-period SMA:
Calculated with ta.sma(close, smaLength) using the closing price (close).
Serves as the central line around which extension levels are drawn.
ADR% (Average Daily Range Percentage):
Formula: 100 * (ta.sma(dhigh / dlow, adrLength) - 1).
Details:
dhigh and dlow are the daily high and low prices, obtained via request.security(syminfo.tickerid, "D", high/low) to ensure data is daily-based, regardless of the chart's timeframe.
The dhigh / dlow ratio represents the daily percentage change.
The simple moving average (ta.sma) of this ratio over 20 days (adrLength) is subtracted by 1 and multiplied by 100 to obtain ADR% as a percentage.
The result is multiplied by scaleFactor for manual adjustments.
Extension Levels:
Defined as ADR% multiples: 4, 7, 8, 9, 10, 11, 12, 13.
Stored in an array (levels) for easy iteration.
For each level, prices above and below the SMA are calculated as:
Above: sma50 * (1 + (level * adrPercent / 100))
Below: sma50 * (1 - (level * adrPercent / 100))
These represent price levels corresponding to a percentage change from the SMA equal to level * ADR%.
4. Visualization
Horizontal Blue Lines:
For each level (4, 7, 8, 9, 10, 11, 12, 13 ADR%), two lines are drawn:
One above the SMA (e.g., +4 ADR%).
One below the SMA (e.g., -4 ADR%).
Color: Blue (color.blue).
Style: Solid (style=line.style_solid).
Management:
Each level has dedicated variables for upper and lower lines (e.g., upperLine1, lowerLine1 for 4 ADR%).
Previous lines are deleted with line.delete before drawing new ones to avoid overlaps.
Lines are updated at each bar with line.new(bar_index , level, bar_index, level), covering the range from the previous bar to the current one.
Labels:
Displayed only on the last bar (barstate.islast) to avoid clutter.
For each level, two labels:
Above: E.g., "4 ADR%", positioned above the upper line (style=label.style_label_down).
Below: E.g., "-4 ADR%", positioned below the lower line (style=label.style_label_up).
Color: Blue background, white text.
50-period SMA:
Drawn as a gray line (color.gray) for visual reference.
Diagnostics:
ADR% Plot: ADR% is plotted in the status line (orange, histogram style) to verify the value.
ADR% Label: A label on the last bar near the SMA shows the exact ADR% value (e.g., "ADR%: 2.34%"), with a gray background and white text.
5. Behavior
Dynamic Updating:
Lines update with each new bar to reflect new SMA 50 and ADR% values.
Since ADR% uses daily data ("D"), it remains constant within the same day but changes day-to-day.
Visibility Across All Bars:
Lines are drawn on every bar, not just the last one, ensuring visibility on historical data as well.
Adaptability:
The scaleFactor allows level adjustments if ADR% is too small (e.g., for low-volatility symbols) or too large (e.g., for cryptocurrencies).
Compatibility:
Works on any timeframe since ADR% is calculated from daily data.
Suitable for symbols with varying volatility (e.g., stocks, forex, cryptocurrencies).
6. Intended Use
Technical Analysis: Extension levels represent significant price zones based on average daily volatility. They can be used to:
Identify potential price targets (e.g., take profit at +7 ADR%).
Assess support/resistance zones (e.g., -4 ADR% as support).
Measure price extension relative to the 50 SMA.
Trading: Useful for strategies based on breakouts or mean reversion, where ADR% levels indicate reversal or continuation points.
Debugging: Labels and ADR% plot help verify that values align with the symbol’s volatility.
7. Limitations
Dependence on Daily Data: ADR% is based on daily dhigh/dlow, so it may not reflect intraday volatility on short timeframes (e.g., 1 minute).
Extreme ADR% Values: For low-volatility symbols (e.g., bonds) or high-volatility symbols (e.g., meme stocks), ADR% may require adjustments via scaleFactor.
Graphical Load: Drawing 16 lines (8 upper, 8 lower) on every bar may slow the chart for very long historical periods, though line management is optimized.
ADR% Formula: The formula 100 * (sma(dhigh/dlow, Length) - 1) may produce different values compared to other ADR% definitions (e.g., (high - low) / close * 100), so users should be aware of the context.
8. Visual Example
On a chart of a stock like TSLA (daily timeframe):
The 50 SMA is a gray line tracking the average trend.
Assuming an ADR% of 3%:
At +4 ADR% (12%), a blue line appears at sma50 * 1.12.
At -4 ADR% (-12%), a blue line appears at sma50 * 0.88.
Other lines appear at ±7, ±8, ±9, ±10, ±11, ±12, ±13 ADR%.
On the last bar, labels show "4 ADR%", "-4 ADR%", etc., and a gray label shows "ADR%: 3.00%".
ADR% is visible in the status line as an orange histogram.
9. Code: Technical Structure
Language: Pine Script @version=5.
Inputs: Three configurable parameters (smaLength, adrLength, scaleFactor).
Calculations:
SMA: ta.sma(close, smaLength).
ADR%: 100 * (ta.sma(dhigh / dlow, adrLength) - 1) * scaleFactor.
Levels: sma50 * (1 ± (level * adrPercent / 100)).
Graphics:
Lines: Created with line.new, deleted with line.delete to avoid overlaps.
Labels: Created with label.new only on the last bar.
Plots: plot(sma50) for the SMA, plot(adrPercent) for debugging.
Optimization: Uses dedicated variables for each line (e.g., upperLine1, lowerLine1) for clear management and to respect TradingView’s graphical object limits.
10. Possible Improvements
Option to show lines only on the last bar: Would reduce visual clutter.
Customizable line styles: Allow users to choose color or style (e.g., dashed).
Alert for anomalous ADR%: A message if ADR% is too small or large.
Dynamic levels: Allow users to specify ADR% multiples via input.
Optimization for short timeframes: Adapt ADR% for intraday timeframes.
Conclusion
The script creates a visual indicator that helps traders identify price extension levels based on daily volatility (ADR%) relative to the 50 SMA. It is robust, configurable, and includes debugging tools (ADR% plot and labels) to verify values. The ADR% formula based on dhigh/dlow

EMA 50 200 Multi-Scanner
EMA 50 200 Multi-Scanner: İndikatör Açıklaması ve Kullanım Kılavuzu
"EMA 50 200 Multi-Scanner" indikatörü, birden fazla kripto para çiftini farklı zaman dilimlerinde tarayan güçlü bir teknik analiz aracıdır. Bu indikatör, 50 periyotluk ve 200 periyotluk Üssel Hareketli Ortalamalar (EMA) arasındaki ilişkiyi analiz ederek, çeşitli zaman dilimlerinde potansiyel alım ve satım fırsatlarını tespit etmenizi sağlar. Hem kısa vadeli trendleri hem de uzun vadeli trendleri gözlemleyerek, piyasa koşullarına uygun stratejiler geliştirmenize yardımcı olur.
Ne İşe Yarar?
Trend Yönünü Belirleme: İndikatör, seçtiğiniz kripto para çiftlerinin her birinde 50 EMA ve 200 EMA arasındaki ilişkiyi analiz eder. Bu analiz, hem kısa vadeli hem de uzun vadeli trendlerin yönünü belirlemenize olanak tanır.
Zaman Dilimleri Arası Analiz: Farklı zaman dilimlerinde çalışabilen bu indikatör, günlük, saatlik, dakikalık gibi çeşitli periyotlarda trendleri ve fiyat hareketlerini incelemenizi sağlar. Bu, hem kısa vadeli ticaret fırsatlarını yakalamak hem de uzun vadeli yatırım kararlarını desteklemek için idealdir.
Alım/Satım Sinyalleri: İndikatör, fiyatın 50 EMA ve 200 EMA ile olan ilişkisini temel alarak alım ve satım sinyalleri üretir. Bu sinyaller, piyasa trendlerinden yararlanarak pozisyon açma veya kapama kararlarınızı destekler.
Dinamik Destek ve Direnç Seviyeleri: EMA seviyeleri, aynı zamanda dinamik destek ve direnç seviyeleri olarak kullanılabilir. Fiyatın bu seviyelere yaklaşması, potansiyel geri dönüş noktalarını veya trendin devamını işaret edebilir.
Nasıl Kullanılır?
İndikatör Ayarları:
EMA Uzunlukları: İhtiyacınıza göre 50 EMA ve 200 EMA'nın periyot uzunluklarını ayarlayabilirsiniz.
Renkler: EMA çizgilerinin rengini tercihinize göre özelleştirebilirsiniz.
Negatif Değerleri Gösterme: Fiyatın EMA seviyelerinin altında olduğu durumlarda negatif değerleri görmek isterseniz, bu özelliği aktif hale getirebilirsiniz.
Semboller: İndikatör, önceden tanımlanmış kripto para çiftleri üzerinde çalışır. Her bir sembol, seçtiğiniz zaman diliminde taranır ve sonuçlar gösterilir. Gereksinimlerinize göre bu sembolleri seçebilir veya çıkarabilirsiniz.
Zaman Dilimleri: İndikatör, TradingView platformundaki tüm zaman dilimlerinde çalışır. Bu, hem kısa vadeli hem de uzun vadeli yatırımcılar için esnek bir analiz olanağı sunar.
Al/Sat Sinyalleri:
Alım Sinyali: 50 EMA, 200 EMA'yı yukarı yönde kestiğinde ve fiyat bu kesişimin üzerinde olduğunda yeşil bir "BUY" etiketi ile gösterilir.
Satım Sinyali: 50 EMA, 200 EMA'yı aşağı yönde kestiğinde ve fiyat bu kesişimin altında olduğunda kırmızı bir "SELL" etiketi ile gösterilir.
"EMA 50 200 Multi-Scanner," çoklu zaman dilimlerinde ve kripto para çiftlerinde trend takibi yapmak isteyen yatırımcılar için etkili ve kullanımı kolay bir araçtır. Piyasa koşullarını daha iyi anlamak ve ticaret stratejilerinizi optimize etmek için bu indikatörü kullanabilirsiniz.
-------------
The "EMA 50 200 Multi-Scanner" is a powerful technical analysis tool designed to scan multiple cryptocurrency pairs across different timeframes. This indicator analyzes the relationship between the 50-period and 200-period Exponential Moving Averages (EMA) to help you identify potential buying and selling opportunities across various timeframes. It enables you to observe both short-term and long-term trends, aiding in the development of market-appropriate strategies.
Purpose
Trend Direction Identification: The indicator analyzes the relationship between the 50 EMA and 200 EMA for each selected cryptocurrency pair, allowing you to determine the direction of both short-term and long-term trends.
Multi-Timeframe Analysis: This indicator can operate across different timeframes, such as daily, hourly, and minute-based periods, allowing you to examine trends and price movements in multiple contexts. It is ideal for capturing short-term trading opportunities and supporting long-term investment decisions.
Buy/Sell Signals: The indicator generates buy and sell signals based on the relationship between the price and the 50 EMA and 200 EMA. These signals support your decision-making process by highlighting opportunities to open or close positions based on market trends.
Dynamic Support and Resistance Levels: The EMA levels can also serve as dynamic support and resistance levels. When the price approaches these levels, it can indicate potential reversal points or trend continuations.
How to Use
Indicator Settings:
EMA Lengths: Adjust the period lengths of the 50 EMA and 200 EMA to suit your needs.
Colors: Customize the colors of the EMA lines according to your preferences.
Show Negative Values: If you want to see negative values when the price is below the EMA levels, you can enable this feature.
Symbols: The indicator works on predefined cryptocurrency pairs. Each symbol is scanned within the selected timeframe, and results are displayed. You can select or deselect symbols according to your requirements.
Timeframes: The indicator functions across all timeframes available on the TradingView platform, offering flexible analysis for both short-term and long-term traders.
Buy/Sell Signals:
Buy Signal: A green "BUY" label is shown when the 50 EMA crosses above the 200 EMA and the price is above this crossover.
Sell Signal: A red "SELL" label is shown when the 50 EMA crosses below the 200 EMA and the price is below this crossover.
The "EMA 50 200 Multi-Scanner" is an effective and user-friendly tool for traders looking to track trends across multiple timeframes and cryptocurrency pairs. You can use this indicator to gain a better understanding of market conditions and optimize your trading strategies.
300-Candle Weighted Average Zones w/50 EMA SignalsThis indicator is designed to deliver a more nuanced view of price dynamics by combining a custom, weighted price average with a volatility-based zone and a trend filter (in this case, a 50-period exponential moving average). The core concept revolves around capturing the overall price level over a relatively large lookback window (300 candles) but with an intentional bias toward recent market activity (the most recent 20 candles), thereby offering a balance between long-term context and short-term responsiveness. By smoothing this weighted average and establishing a “zone” of standard deviation bands around it, the indicator provides a refined visualization of both average price and its recent volatility envelope. Traders can then look for confluence with a standard trend filter, such as the 50 EMA, to identify meaningful crossover signals that may represent trend shifts or opportunities for entry and exit.
What the Indicator Does:
Weighted Price Average:
Instead of using a simple or exponential moving average, this indicator calculates a custom weighted average price over the past 300 candles. Most historical candles receive a base weight of 1.0, but the most recent 20 candles are assigned a higher weight (for example, a weight of 2.0). This weighting scheme ensures that the calculation is not simply a static lookback average; it actively emphasizes current market conditions. The effect is to generate an average line that is more sensitive to the most recent price swings while still maintaining the historical context of the previous 280 candles.
Smoothing of the Weighted Average:
Once the raw weighted average is computed, an exponential smoothing function (EMA) is applied to reduce noise and produce a cleaner, more stable average line. This smoothing helps traders avoid reacting prematurely to minor price fluctuations. By stabilizing the average line, traders can more confidently identify actual shifts in market direction.
Volatility Zone via Standard Deviation Bands:
To contextualize how far price can deviate from this weighted average, the indicator uses standard deviation. Standard deviation is a statistical measure of volatility—how spread out the price values are around the mean. By adding and subtracting one standard deviation from the smoothed weighted average, the indicator plots an upper band and a lower band, creating a zone or channel. The area between these bands is filled, often with a semi-transparent color, highlighting a volatility corridor within which price and the EMA might oscillate.
This zone is invaluable in visualizing “normal” price behavior. When the 50 EMA line and the weighted average line are both within this volatility zone, it indicates that the market’s short- to mid-term trend and its average pricing are aligned well within typical volatility bounds.
Incorporation of a 50-Period EMA:
The inclusion of a commonly used trend filter, the 50 EMA, adds another layer of context to the analysis. The 50 EMA, being a widely recognized moving average length, is often considered a baseline for intermediate trend bias. It reacts faster than a long-term average (like a 200 EMA) but is still stable enough to filter out the market “chop” seen in very short-term averages.
By overlaying the 50 EMA on this custom weighted average and the surrounding volatility zone, the trader gains a dual-dimensional perspective:
Trend Direction: If the 50 EMA is generally above the weighted average, the short-term trend is gaining bullish momentum; if it’s below, the short-term trend has a bearish tilt.
Volatility Normalization: The bands, constructed from standard deviations, provide a sense of whether the price and the 50 EMA are operating within a statistically “normal” range. If the EMA crosses the weighted average within this zone, it signals a potential trend initiation or meaningful shift, as opposed to a random price spike outside normal volatility boundaries.
Why a Trader Would Want to Use This Indicator:
Contextualized Price Level:
Standard MAs may not fully incorporate the most recent price dynamics in a large lookback window. By weighting the most recent candles more heavily, this indicator ensures that the trader is always anchored to what the market is currently doing, not just what it did 100 or 200 candles ago.
Reduced Whipsaw with Smoothing:
The smoothed weighted average line reduces noise, helping traders filter out inconsequential price movements. This makes it easier to spot genuine changes in trend or sentiment.
Visual Volatility Gauge:
The standard deviation bands create a visual representation of “normal” price movement. Traders can quickly assess if a breakout or breakdown is statistically significant or just another oscillation within the expected volatility range.
Clear Trade Signals with Confirmation:
By integrating the 50 EMA and designing signals that trigger only when the 50 EMA crosses above or below the weighted average while inside the zone, the indicator provides a refined entry/exit criterion. This avoids chasing breakouts that occur in abnormal volatility conditions and focuses on those crossovers likely to have staying power.
How to Use It in an Example Strategy:
Imagine you are a swing trader looking to identify medium-term trend changes. You apply this indicator to a chart of a popular currency pair or a leading tech stock. Over the past few days, the 50 EMA has been meandering around the weighted average line, both confined within the standard deviation zone.
Bullish Example:
Suddenly, the 50 EMA crosses decisively above the weighted average line while both are still hovering within the volatility zone. This might be your cue: you interpret this crossover as the 50 EMA acknowledging the recent upward shift in price dynamics that the weighted average has highlighted. Since it occurred inside the normal volatility range, it’s less likely to be a head-fake. You place a long position, setting an initial stop just below the lower band to protect against volatility.
If the price continues to rise and the EMA stays above the average, you have confirmation to hold the trade. As the price moves higher, the weighted average may follow, reinforcing your bullish stance.
Bearish Example:
On the flip side, if the 50 EMA crosses below the weighted average line within the zone, it suggests a subtle but meaningful change in trend direction to the downside. You might short the asset, placing your protective stop just above the upper band, expecting that the statistically “normal” level of volatility will contain the price action. If the price does break above those bands later, it’s a sign your trade may not work out as planned.
Other Indicators for Confluence:
To strengthen the reliability of the signals generated by this weighted average zone approach, traders may want to combine it with other technical studies:
Volume Indicators (e.g., Volume Profile, OBV):
Confirm that the trend crossover inside the volatility zone is supported by volume. For instance, an uptrend crossover combined with increasing On-Balance Volume (OBV) or volume spikes on up candles signals stronger buying pressure behind the price action.
Momentum Oscillators (e.g., RSI, Stochastics):
Before taking a crossover signal, check if the RSI is above 50 and rising for bullish entries, or if the Stochastics have turned down from overbought levels for bearish entries. Momentum confirmation can help ensure that the trend change is not just an isolated random event.
Market Structure Tools (e.g., Pivot Points, Swing High/Low Analysis):
Identify if the crossover event coincides with a break of a previous pivot high or low. A bullish crossover inside the zone aligned with a break above a recent swing high adds further strength to your conviction. Conversely, a bearish crossover confirmed by a breakdown below a previous swing low can make a short trade setup more compelling.
Volume-Weighted Average Price (VWAP):
Comparing where the weighted average zone lies relative to VWAP can provide institutional insight. If the bullish crossover happens while the price is also holding above VWAP, it can mean that the average participant in the market is in profit and that the trend is likely supported by strong hands.
This indicator serves as a tool to balance long-term perspective, short-term adaptability, and volatility normalization. It can be a valuable addition to a trader’s toolkit, offering enhanced clarity and precision in detecting meaningful shifts in trend, especially when combined with other technical indicators and robust risk management principles.

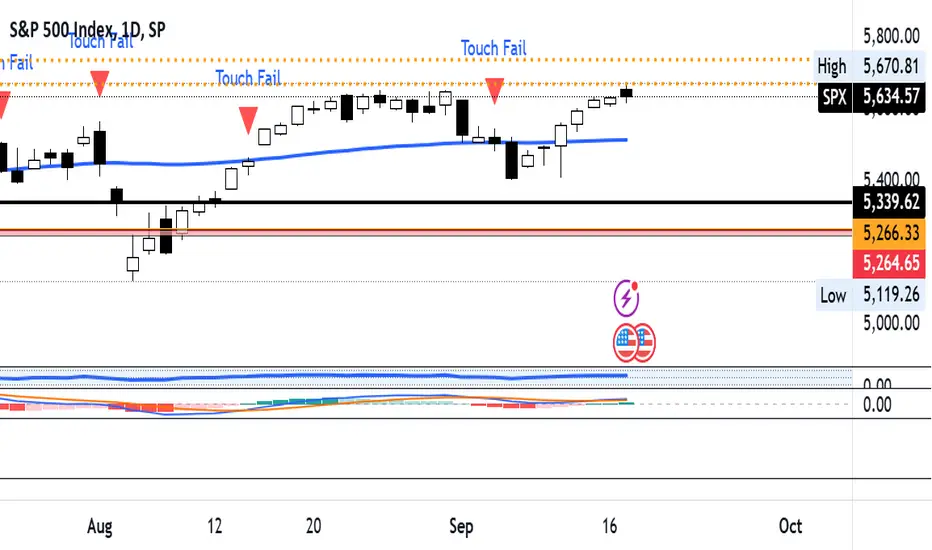
Price Touches 50-Day MA and Fails to CrossOverview: The Price Touches 50-Day MA and Fails to Cross Indicator is a powerful tool designed for traders and analysts using TradingView to monitor and identify key interactions between an asset's price and its 50-day Simple Moving Average (SMA). This indicator specifically highlights moments when the price touches the 50-day MA but fails to cross it, signaling potential support or resistance levels that could influence future price movements.
Key Features:
50-Day Simple Moving Average (SMA) Calculation:
Automatically calculates and plots the 50-day SMA on your chart, providing a clear reference point for price action analysis.
Touch Detection:
Identifies when the closing price comes within a user-defined tolerance (default is 0.1%) of the 50-day MA, indicating a "touch."
Failure to Cross Confirmation:
Determines if the price, after touching the MA, fails to cross it in the subsequent bar. This helps in recognizing potential reversal points or consolidation zones.
Visual Indicators:
Plots red downward triangles above the bars where a touch-and-fail event occurs, making it easy to spot these critical moments at a glance.
Customizable Touch Tolerance:
Allows users to adjust the sensitivity of touch detection by modifying the touch tolerance percentage, catering to different trading strategies and asset volatilities.
Alert Conditions:
Offers the option to set up alerts that notify you whenever a touch-and-fail event is detected, ensuring you never miss significant trading signals.
How It Works:
Calculating the 50-Day SMA:
The indicator computes the 50-day SMA using the closing prices, providing a smooth average that reflects the asset's mid-term trend.
Detecting a Touch:
A "touch" is registered when the absolute difference between the closing price and the 50-day SMA is less than or equal to the specified tolerance. This proximity suggests a potential support or resistance level.
Confirming Failure to Cross:
After a touch is detected, the indicator checks whether the price fails to move beyond the 50-day MA in the next bar. If the price remains on the original side of the MA, it signifies a failed attempt to cross, highlighting a possible reversal or consolidation.
Plotting Indicators:
When a touch-and-fail event is confirmed, a red downward triangle is plotted above the corresponding bar, providing a clear visual cue for traders.
Setting Up Alerts:
Users can enable alert conditions to receive real-time notifications whenever a touch-and-fail event is detected, allowing for timely trading decisions.
Customization Options:
Touch Tolerance (%):
Adjust the touch_tolerance input to set how close the price needs to be to the 50-day MA to be considered a touch. This flexibility allows the indicator to be tailored to different trading styles and asset behaviors.
Visual Styles:
Customize the appearance of the SMA line and the touch-fail indicators to match your charting preferences, ensuring seamless integration with your existing setup.
Benefits:
Enhanced Decision-Making:
By highlighting key interactions with the 50-day MA, this indicator aids in identifying potential entry and exit points, improving overall trading strategy.
Time Efficiency:
Automates the process of monitoring price movements relative to the 50-day MA, saving traders valuable time and reducing the need for constant manual analysis.
Versatility:
Suitable for various asset classes, including stocks, forex, commodities, and cryptocurrencies, making it a versatile tool for any trader's toolkit.
Happy Trading!
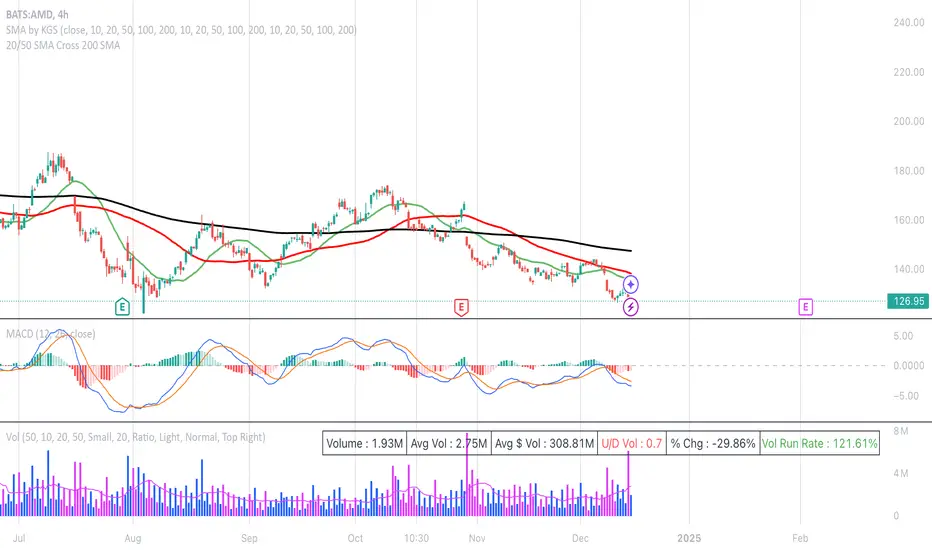
20/50 SMA Cross 200 SMAThis Pine Script code is designed to identify and visualize crossovers of two shorter-term Simple Moving Averages (SMAs), a 20-period SMA and a 50-period SMA, with a longer-term 200-period SMA on a price chart. It also includes alerts for these crossover events. Here's a breakdown:
**Purpose:**
The core idea behind this script is to detect potential trend changes. Crossovers of shorter-term moving averages over a longer-term moving average are often interpreted as bullish signals, while crossovers below are considered bearish.
**Key Components:**
1. **Moving Average Calculation:**
* `sma20 = ta.sma(close, 20)`: Calculates the 20-period SMA of the closing price.
* `sma50 = ta.sma(close, 50)`: Calculates the 50-period SMA of the closing price.
* `sma200 = ta.sma(close, 200)`: Calculates the 200-period SMA of the closing price.
2. **Crossover Detection:**
* `crossUp20 = ta.crossover(sma20, sma200)`: Returns `true` when the 20-period SMA crosses above the 200-period SMA.
* `crossDown20 = ta.crossunder(sma20, sma200)`: Returns `true` when the 20-period SMA crosses below the 200-period SMA.
* Similar logic applies for `crossUp50` and `crossDown50` with the 50-period SMA.
3. **Recent Crossover Tracking (Crucial Improvement):**
* `lookback = 7`: Defines a lookback period of 7 bars.
* `var bool hasCrossedUp20 = false`, etc.: Declares `var` (persistent) boolean variables to track if a crossover has occurred *within* the last 7 bars. This is the most important correction from previous versions.
* The logic using `ta.barssince()` is the key:
* If a crossover happens (`crossUp20` is true), the corresponding `hasCrossedUp20` is set to `true`.
* If no crossover happens on the current bar, it checks if a crossover happened within the last 7 bars using `ta.barssince(crossUp20) <= lookback`. If so, it keeps `hasCrossedUp20` as `true`. After 7 bars, it becomes `false`.
4. **Plotting Crossovers:**
* `plotshape(...)`: Plots circles on the chart to visually mark the crossovers.
* Green circles below the bars for bullish crossovers (20 and 50).
* Red circles above the bars for bearish crossovers (20 and 50).
* Different shades of green/red (green/lime, red/maroon) distinguish between 20 and 50 SMA crossovers.
5. **Plotting Moving Averages (Optional but Helpful):**
* `plot(sma20, color=color.blue, linewidth=1)`: Plots the 20-period SMA in blue.
* Similar logic for the 50-period SMA (orange) and 200-period SMA (gray).
6. **Alerts:**
* `alertcondition(...)`: Triggers alerts when crossovers occur. This is essential for real-time trading signals.
**How it Works (in Simple Terms):**
The script continuously calculates the 20, 50, and 200 SMAs. It then monitors for instances where the 20 or 50 SMA crosses the 200 SMA. When such a crossover happens, a colored circle is plotted on the chart, and an alert is triggered. The key improvement is that it remembers if a crossover occurred in the last 7 bars and continues to display the circle during that period.
**Use Case:**
Traders use this type of indicator to identify potential entry and exit points in the market. A bullish crossover (shorter SMA crossing above the longer SMA) might be a signal to buy, while a bearish crossover might be a signal to sell.
**Key Improvements over Previous Versions:**
* **Correct Lookback Implementation:** The use of `ta.barssince()` and `var` variables is the correct and efficient way to check for crossovers within a lookback period. This fixes the major flaw in earlier versions.
* **Clear Visualizations:** The use of `plotshape` with distinct colors makes it easy to distinguish between 20 and 50 SMA crossovers.
* **Alerts:** The inclusion of alerts makes the script much more practical for real-time trading.
This improved version provides a robust and useful tool for identifying and tracking SMA crossovers.
EMA 50 + 200 Trend Signal TableEMA 50 + 200 Trend Signal Table (ETT)
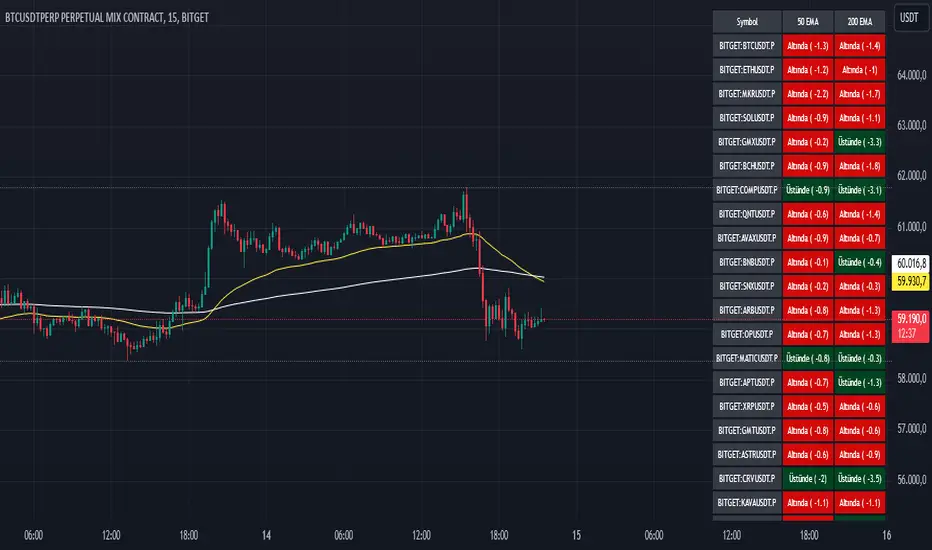
This indicator provides a multi-timeframe trend signal table based on the 50-period and 200-period Exponential Moving Averages (EMAs). It visually plots the EMA 50 and EMA 200 on the chart, along with a customizable, compact table that indicates the trend direction across multiple timeframes. This tool is useful for traders looking to quickly identify market trends and momentum on various timeframes.
How It Works
- EMA Trend Analysis: The script compares the EMA 50 and EMA 200 values to determine the trend. When EMA 50 is above EMA 200, the trend is considered Bullish; if EMA 50 is below EMA 200, the trend is Bearish. If EMA 200 data is unavailable (e.g., on very short timeframes), the trend status will display as Neutral.
- Multi-Timeframe Trend Signals: The table displays the trend signals across five user-defined timeframes, updating in real time. Each timeframe row shows either Bullish, Bearish, or Neutral, with colors customizable to your preference.
Features
- EMA 50 and EMA 200 Visualization: Plots EMA 50 and EMA 200 lines directly on the chart. Users can customize the color and line thickness for each EMA to fit their charting style.
- Trend Signal Table: A table positioned on the chart (with options for positioning in the corners) shows the trend direction for the selected timeframes.
Bullish Trend: Highlighted in green (default) with 50% opacity.
Bearish Trend: Highlighted in red (default) with 50% opacity.
Neutral Trend: Highlighted in gray (default) with 50% opacity.
- Customizable Table Appearance: Allows users to select the position of the table (top-right, top-left, bottom-right, or bottom-left) and choose between compact sizes (Extra Small, Small, Normal).
- Adjustable Colors: Users can specify custom colors for each trend status (Bullish, Bearish, Neutral) as well as for the text and table border colors.
Inputs and Customizations
- Timeframes: Choose up to five different timeframes for trend analysis.
- EMA Colors and Line Widths: Customize the color and line width of EMA 50 and EMA 200 plotted on the chart.
- Table Settings: Control the position, size, and color options of the trend signal table for improved visibility and integration with your chart layout.
Use Case This indicator is ideal for traders who employ a multi-timeframe approach to confirm trends and filter entries. By monitoring the relative positions of EMA 50 and EMA 200 across various timeframes, traders can get a quick snapshot of trend strength and direction, aiding in informed trading decisions.

IB & Hammer at SMA(20,50|200)IB & Hammer at SMA (20, 50, 200) Breakout/Breakdown Indicator
Overview:
The IB (Inside Bar) & Hammer at SMA Breakout/Breakdown Indicator is designed to identify breakout and breakdown opportunities using Inside Bars (IB) in combination with Simple Moving Averages (SMA 20, 50, 200) as key trend filters. This indicator is useful for traders looking to catch momentum moves after consolidation phases, confirming the trend direction with moving averages.
Indicator Logic:
Inside Bar (IB) Detection:
An Inside Bar is a candlestick that is completely within the range of the previous candle (i.e., lower high and higher low).
Inside Bars indicate consolidation, suggesting a potential breakout.
SMA Trend Confirmation:
The script uses three moving averages (SMA 20, 50, 200) to determine the trend direction.
Bullish trend: Price is above the 50 & 200 SMAs.
Bearish trend: Price is below the 50 & 200 SMAs.
The 20 SMA is used as a dynamic short-term momentum filter.
Breakout & Breakdown Conditions:
Breakout: When price breaks above the Inside Bar’s high, and the trend is bullish (above key SMAs).
Breakdown: When price breaks below the Inside Bar’s low, and the trend is bearish (below key SMAs).
Alerts can be set to notify traders of potential trade opportunities.
Features:
✅ Identifies Inside Bars (consolidation zones).
✅ Uses SMA (20, 50, 200) for trend confirmation.
✅ Breakout/Breakdown signals based on Inside Bar structure.
✅ Customizable Moving Averages & Alerts.
✅ Visual markers for easy trade identification.
How to Use:
Confirm Trend Direction:
If the price is above SMA 50 & 200, look for breakout trades.
If the price is below SMA 50 & 200, look for breakdown trades.
Watch for Inside Bars:
The script highlights Inside Bars with a specific color (configurable).
These bars indicate a low-volatility phase, preparing for a breakout.
Trade on Breakout/Breakdown:
Breakout: Enter long when the price breaks above the Inside Bar’s high (bullish trend).
Breakdown: Enter short when the price breaks below the Inside Bar’s low (bearish trend).

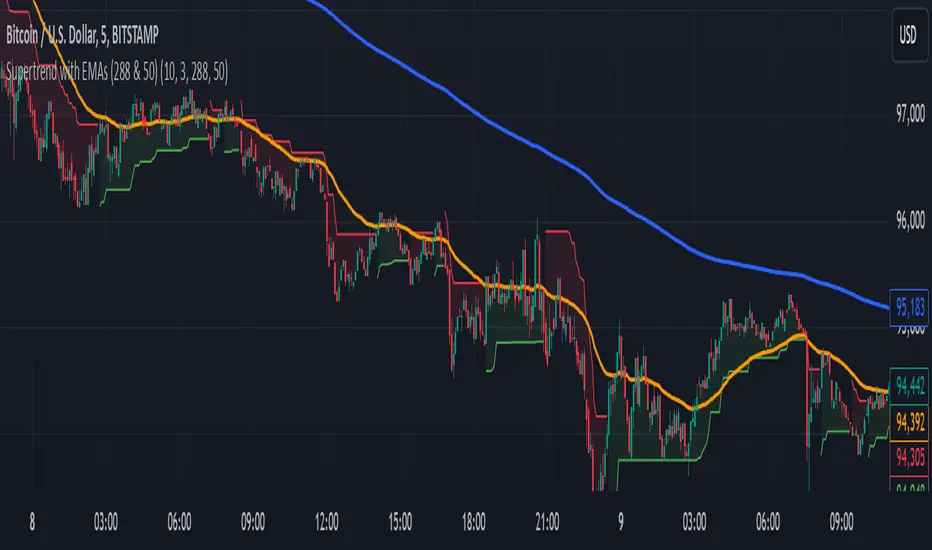
Supertrend with EMAs (288 & 50)This indicator combines the Supertrend with two key Exponential Moving Averages (EMAs) — the 50 EMA and the 288 EMA — to help traders identify trends and possible entry or exit points in the market.
Key Features:
Supertrend Indicator:
The Supertrend indicator is a widely used trend-following tool. It helps determine whether the market is in an uptrend or downtrend by adjusting based on the Average True Range (ATR).
In this indicator, green represents an uptrend, and red represents a downtrend.
288 EMA:
The 288-period Exponential Moving Average is plotted to show the long-term market trend. It reacts more quickly to recent price changes than a simple moving average, offering an effective way to gauge long-term market direction.
50 EMA:
The 50-period Exponential Moving Average is commonly used as a short-term trend indicator. It helps identify shorter-term trends and serves as a dynamic support/resistance level.
EMA Crossover Alerts:
This indicator includes alerts for when the 50 EMA crosses above the 288 EMA (bullish signal) and when it crosses below (bearish signal), helping traders catch trend reversals or confirmation of current trends.
Supertrend Alerts:
Alerts are triggered when the Supertrend indicator switches from uptrend to downtrend or downtrend to uptrend, indicating a potential shift in market direction.
Usage:
Uptrend Confirmation: When the Supertrend is green and the 50 EMA is above the 288 EMA, it signals that the market is in a strong bullish trend.
Downtrend Confirmation: When the Supertrend is red and the 50 EMA is below the 288 EMA, it indicates that the market is in a bearish trend.
Crossover Signals: The indicator provides alerts when the 50 EMA crosses above or below the 288 EMA, helping traders spot trend changes.
Best For:
Trend-following strategies
Identifying potential trend reversals and market shifts
Traders looking for a combination of short-term and long-term trend analysis
Note: This indicator is most effective when used in conjunction with other technical analysis tools and should be considered alongside other factors such as volume, support/resistance levels, and price action.
EMA 21 and SMA 50 Low ConditionsDescription:
This indicator highlights trend zones on a daily chart using the 21-day Exponential Moving Average (EMA) and 50-day Simple Moving Average (SMA). It’s designed to identify bullish conditions with two distinct background colors:
• Green Background: Signals a strong bullish trend. Appears when the low of the candle stays above the 21 EMA for 3 or more consecutive days, with either the 3rd or 4th day closing higher than its open (an “up” day). The green zone persists until a candle closes below the 21 EMA.
• Yellow Background: Indicates a potential support zone. Triggers when the low of the candle remains above the 50 SMA after the green condition ends, suggesting the price is still holding above a longer-term average. The yellow zone lasts until a candle closes below the 50 SMA.
Features:
• Plots the 21 EMA (blue line) and 50 SMA (orange line) for visual reference.
• Uses background colors to mark trend zones, making it easy to spot bullish phases and support levels.
• Optimized for daily timeframes, ideal for swing traders or long-term trend followers.
How to Use:
1. Apply the indicator to a daily chart.
2. Watch for the green background to identify strong bullish momentum (lows holding above the 21 EMA with an up close confirmation).
3. Look for the yellow background as a sign of potential support after the short-term trend weakens (lows above the 50 SMA).
4. Exit zones are triggered by closes below the respective averages (21 EMA for green, 50 SMA for yellow).
Notes:
• Best used on symbols with sufficient historical data to ensure accurate EMA and SMA calculations.
• The indicator prioritizes the green condition over yellow—green will override if both could apply.
Author’s Intent:
Created to help traders visualize sustained bullish trends and key support levels using simple moving average rules. Perfect for confirming uptrends and monitoring pullbacks within a broader bullish context.

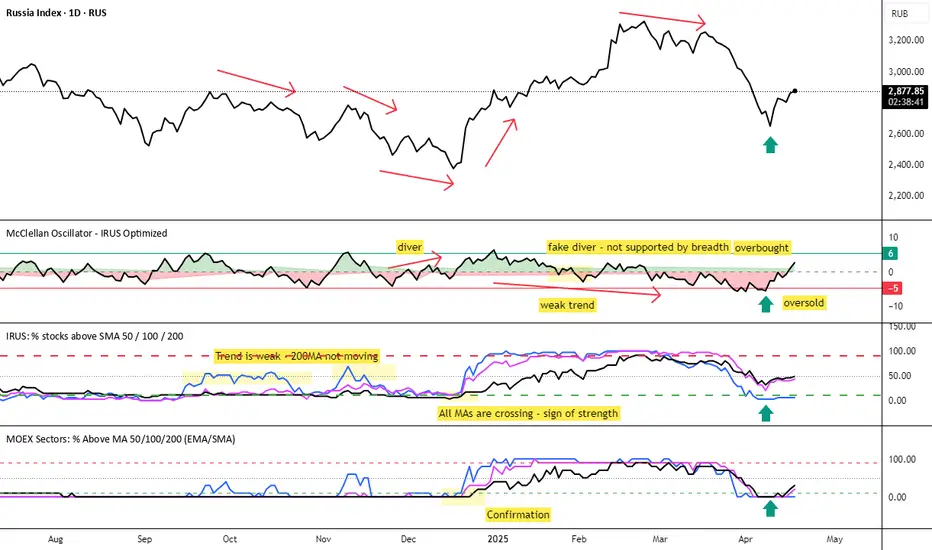
MOEX Sectors: % Above MA 50/100/200 (EMA/SMA)🧠 Name:
MOEX Sectors: % Above MA 50/100/200 (EMA/SMA)
📋 Description (for TradingView “Description” tab):
This indicator shows the percentage of Moscow Exchange sectoral indices trading above the selected moving average (SMA or EMA) with periods of 50, 100, or 200.
It uses 10 official MOEX sector indices:
MOEXOG (Oil & Gas)
MOEXCH (Chemicals)
MOEXMM (Metals & Mining)
MOEXTN (Transport)
MOEXCN (Consumer)
MOEXFN (Financials)
MOEXTL (Telecom)
MOEXEU (Utilities)
MOEXIT (IT)
MOEXRE (Real Estate)
The indicator plots up to 3 lines representing the % of sectors trading above MA 50, 100, and/or 200. The MA type is user-selectable: EMA (default) or SMA.
Horizontal reference levels (90, 50, 10) help interpret market conditions:
🔼 >90% — Overbought zone, potential market exhaustion
⚖️ ~50% — Neutral state
🔽 <10% — Oversold zone, possible rebound
📈 How to Use in Strategy:
✅ 1. Trend Filter
If >50% of sectors are above MA 200 → market in long-term uptrend
If <50% → avoid long bias, bearish regime likely
✅ 2. Bottom Detection
When <10% of sectors are above MA 200, the market is heavily oversold — often a bottoming signal
✅ 3. Trend Confirmation
If the main index is rising and % of sectors above MA is growing, the trend is supported by breadth
If the index rises while breadth declines → bearish divergence
✅ 4. Contrarian Setups
>90% of sectors above MA 50 → market may be overheated, watch for pullback
<20% above MA 50 → potential local bottom
⚙️ Tips:
Overlay this indicator on the IMOEX index chart to detect narrow leadership
Combine with other breadth metrics or RSI on the index
Use the EMA/SMA toggle to fine-tune sensitivity
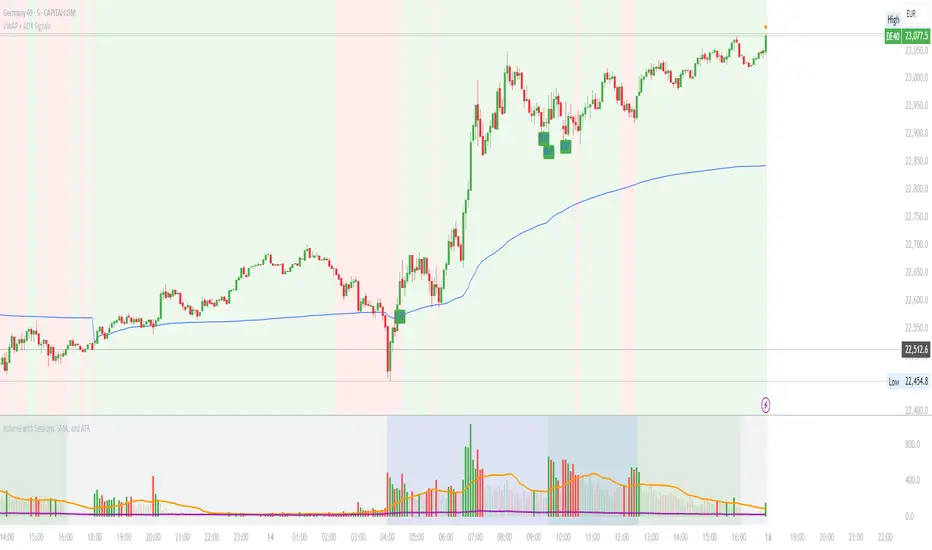
VWAP with ADX Buy/Sell Signals and 50 MA BackgroundThis Pine Script combines several technical indicators to create a comprehensive chart with buy and sell signals based on the ADX and VWAP, as well as background color changes depending on the price relative to the 50-period simple moving average (SMA). Here's a breakdown of what each part of the code does:
1. VWAP Settings
Anchor Period: You can select different periods such as "Session", "Week", "Month", etc. to define the anchor period for the VWAP.
Source: The source for VWAP is set to the typical price (hlc3).
Offset: Allows for shifting the VWAP by a specified amount.
2. ADX Settings
ADX Length: The period used to calculate the ADX.
ADX Smoothing: Used to smooth the ADX for better clarity.
ADX Threshold: Used to filter out weak trends (i.e., signals when ADX > 20).
3. ADX and VWAP Calculation
The ADX values are calculated using ta.dmi(), which returns the +DI, -DI, and ADX lines.
VWAP is calculated using ta.vwap(), based on the selected price source.
4. Buy/Sell Conditions
Buy Signal: A buy signal is generated when:
The +DI crosses above the -DI (indicating an uptrend).
The ADX is above 20 (indicating a strong trend).
The closing price is above the VWAP (indicating bullish market sentiment).
Sell Signal: A sell signal occurs when:
The -DI crosses above the +DI (indicating a downtrend).
The ADX is above 20 (indicating a strong trend).
The closing price is below the VWAP (indicating bearish market sentiment).
5. VWAP Bands
The standard deviation of the price is calculated using ta.stdev(), and the bands are plotted at multiples of the standard deviation (1, 2, and 3).
These bands are used to highlight possible overbought or oversold conditions.
6. 50-period SMA and Background Color
The script calculates a 50-period Simple Moving Average (SMA).
The background color is then changed based on whether the price is above or below the 50-period SMA. If the price is above the SMA, the background is green (bullish), and if it’s below, it’s red (bearish).
7. Plots
The script includes plots for the VWAP line, the ADX and DI lines (optional), and the upper and lower bands.
The buy and sell signals are plotted as shapes with text labels ("BUY" and "SELL") that appear below or above the price bars.
Final Notes:
Band Plots: Three levels of bands (green, olive, teal) are plotted using standard deviation multipliers (1, 2, and 3 times the standard deviation).
Background Color: The background color changes depending on whether the price is above or below the 50 SMA, giving a visual cue for bullish or bearish market conditions.
This indicator aims to offer a multi-faceted view of the market with trend-following signals (via ADX), VWAP for intraday support/resistance, and background coloring to indicate the current trend strength based on the 50 SMA.
EMA Crossover Strategy with 50 & 200 EMAs - Faisal AnwarThis indicator uses 50 and 200-day Exponential Moving Averages (EMAs) to identify significant trend directions and potential trading opportunities through golden crossovers and death crosses. It highlights the role of EMAs as dynamic support in uptrends and downtrends, enhancing trend-following strategies.
Detailed Explanation:
EMAs Used:
The strategy utilizes two key EMAs — the 50-day EMA and the 200-day EMA. The 50-day EMA is often seen as a medium-term trend indicator, while the 200-day EMA is regarded as a benchmark for the long-term market trend.
Golden Crossover:
This occurs when the 50-day EMA crosses above the 200-day EMA, traditionally considered a bullish signal indicating potential long positions.
Death Cross:
This event is marked by the 50-day EMA crossing below the 200-day EMA, typically viewed as a bearish signal suggesting potential short positions.
Trend Support Identification:
The script also identifies when the price is above the 50-day EMA during an uptrend (indicating ongoing support) and when the price is above the 200-day EMA during a downtrend, suggesting the EMA is acting as resistance turning into support.
Visual Tools:
The indicator plots these EMAs on the chart with distinct colors for easy differentiation and uses background color changes to visually indicate when these EMAs act as support. Buy and sell signals are clearly marked with shapes and text directly on the chart for actionable insights.
Usage Tips:
Trading Decisions:
This indicator is best used in markets with clear trends, where EMAs can effectively identify shifts in momentum and serve as reliable support or resistance levels.
Complementary Tools:
Consider combining this EMA strategy with other technical analysis tools like RSI or MACD for confirmation of signals to enhance the reliability of the trading signals.
Ideal for:
Traders looking for a visual tool to assist in identifying trend directions and optimal points for entering or exiting trades based on established technical analysis principles.
ZIP Entry Strategy( Using 50 SMA and 100 SMA)Description:
This strategy uses only two simple moving averages, specifically the 50 SMA and the 100 SMA.
Simple moving average : A simple moving average (SMA) calculates the average of a selected range of prices, usually closing prices, by the number of periods in that range.
Here's how it works:
Background color:
The chart background is colored green when the price is above the 100 SMA.
The chart background turns red when the price is below the 100 SMA.
The greenback ground suggest the bullish momentum and the red background suggests the bearish momentum.
We can use this long term trend to take the trades in alignment with the trend to increase our odds.
We will use the 50 SMA to identify the spots when a new trend is starting. When the price crosses above the 50 SMA while the background is green, the candle/bar color changes to white indicating a new trend beginning.
Conversely, when the price crosses below the 50 SMA while the background is red, the candle/bar color also changes to white indicating a new trend beginning.
The occurrence of white candles indicates the start of a potential new trend in alignment with the long term trend.
However, it's essential to remember that like any trading strategy, this one is not perfect. For more reliable results, it's advisable to combine it with a consideration of the overall price structure to minimize false entry signals.
Originality and usefulness
Even though it makes use of two moving averages, we don't use the moving average crossover. The moving average crossovers are either lagging or provide too many false signals. We have tried to address these issue with this strategy. While maintaining the long-term trend and ignoring false signals, it gives out signals early.
You can choose the moving average that best suits your needs by changing these moving averages to a different moving average . The 50 SMA and 100 SMA appeared to be giving the better signals in my experience.
I dont use any other indicators but i would like to check the price structure to make sure its moving along with the 50 SMA. Sometimes the choppy markets might give false signals.
Its okay to see multiple white candles as long as the price structure holds.
I have highlighted the white candles in the above chart. The color of the candle is always the same so the background decides whether its bearish or bullish cross
Volume Profile Free MAX SLI (50 Levels Value Area VWAP) by RRBVolume Profile Free MAX SLI by RagingRocketBull 2019
Version 1.0
All available Volume Profile Free MAX SLI versions are listed below (They are very similar and I don't want to publish them as separate indicators):
ver 1.0: style columns implementation
ver 2.0: style histogram implementation
ver 3.0: style line implementation
This indicator calculates Volume Profile for a given range and shows it as a histogram consisting of 50 horizontal bars.
It can also show Point of Control (POC), Developing POC, Value Area/VWAP StdDev High/Low as dynamically moving levels.
Free accounts can't access Standard TradingView Volume Profile, hence this indicator.
There are several versions: Free Pro, Free MAX SLI, Free History. This is the Free MAX SLI version. The Differences are listed below:
- Free Pro: 25 levels, +Developing POC, Value Area/VWAP High/Low Levels, Above/Below Area Dimming
- Free MAX SLI: 50 levels, packed to the limit, 2x SLI modes for Buy/Sell or even higher res 150 levels
- Free History: auto highest/lowest, historic poc/va levels for each session
Features:
- High-Res Volume Profile with up to 50 levels (3 implementations)
- 20-30x faster than the old Pro versions especially on lower tfs with long history
- 2x SLI modes for even higher res: 150 levels with 3x vertical SLI, 50 buy/sell levels with 2x horiz SLI
- Calculate Volume Profile on full history
- POC, Developing POC Levels
- Buy/Sell/Total volume modes
- Side Cover
- Value Area, VAH/VAL dynamic levels
- VWAP High/Low dynamic levels with Source, Length, StdDev as params
- Show/Hide all levels
- Dim Non Value Area Zones
- Custom Range with Highlighting
- 3 Anchor points for Volume Profile
- Flip Levels Horizontally
- Adjustable width, offset and spacing of levels
- Custom Color for POC/VA/VWAP levels and Transparency for buy/sell levels
Usage:
- specify max_level/min_level/spacing (required)
- select range (start_bar, range length), confirm with range highlighting
- select volume type: Buy/Sell/Total
- select mode Value Area/VWAP to show corresponding levels
- flip/select anchor point to position the buy/sell levels
- use Horiz SLI mode for 50 Buy/Sell or Vertical SLI for 150 levels if needed
- use POC/Developing POC/VA/VWAP High/Low as S/R levels. Usually daily values from 1-3 days back are used as levels for the current day.
SLI:
- use SLI modes to extend the functionality of the indicator:
- Horiz Buy/Sell 2x SLI lets you view 50 Buy/Sell Levels at the same time
- Vertical Max_Vol 3x SLI lets you increase the resolution to 150 levels
- you need at least 2 instances of the indicator attached to the same chart for SLI to work
1) Enable Horiz SLI:
- attach 2 indicator instances to the chart
- make sure all instances have the same min_level/max_level/range/spacing settings
- select volume type for each instance: you can have a buy/sell or buy/total or sell/total SLI. Make sure your buy volume instance is the last attached to be displayed on top of sell/total instances without overlapping.
- set buy_sell_sli_mode to true for indicator instances with volume_type = buy/sell, for type total this is optional.
- this basically tells the script to calculate % lengths based on total volume instead of individual buy/sell volumes and use ext offset for sell levels
- Sell Offset is calculated relative to Buy Offset to stack/extend sell after buy. Buy Offset = Zero - Buy Length. Sell Offset = Buy Offset - Sell Length = Zero - Buy Length - Sell Length
- there are no master/slave instances in this mode, all indicators are equal, poc/va levels are not affected and can work independently, i.e. one instance can show va levels, another - vwap.
2) Enable Vertical SLI:
- attach the first instance and evaluate the full range to roughly determine where is the highest max_vol/poc level i.e. 0..20000, poc is in the bottom half (third, middle etc) or
- add more instances and split the full vertical range between them, i.e. set min_level/max_level of each corresponding instance to 0..10000, 10000..20000 etc
- make sure all instances have the same range/spacing settings
- an instance with a subrange containing the poc level of the full range is now your master instance (bottom half). All other instances are slaves, their levels will be calculated based on the max_vol/poc of the master instance instead of local values
- set show_max_vol_sli to true for the master instance. for slave instances this is optional and can be used to check if master/slave max_vol values match and slave can read the master's value. This simply plots the max_vol value
- you can also attach all instances and set show_max_vol_sli to true in all of them - the instance with the largest max_vol should become the master
Auto/Manual Ext Max_Vol Modes:
- for auto vertical max_vol SLI mode set max_vol_sli_src in all slave instances to the max_vol of the master indicator: "VolumeProfileFree_MAX_RRB: Max Volume for Vertical SLI Mode". It can be tricky with 2+ instances
- in case auto SLI mode doesn't work - assign max_vol_sli_ext in all slave instances the max_vol value of the master indicator manually and repeat on each change
- manual override max_vol_sli_ext has higher priority than auto max_vol_sli_src when both values are assigned, when they are 0 and close respectively - SLI is disabled
- master/slave max_vol values must match on each bar at all times to maintain proper level scale, otherwise slave's levels will look larger than they should relative to the master's levels.
- Max_vol (red) is the last param in the long list of indicator outputs
- the only true max_vol/poc in this SLI mode is the master's max_vol/poc. All poc/va levels in slaves will be irrelevant and are disabled automatically. Slaves can only show VWAP levels.
- VA Levels of the master instance in this SLI mode are calculated based on the subrange, not the whole range. Cross check with the full range.
WARNING!
- auto mode max_vol_sli_src is experimental and may not work as expected
- you can only assign auto mode max_vol_sli_src = max_vol once due to some bug with unhandled exception/buffer overflow in Tradingview. Seems that you can clear the value only by removing the indicator instance
- sometimes you may see a "study in error state" error when attempting to set it back to close. Remove indicator/Reload chart and start from scratch
- volume profile may not finish to redraw and freeze in an ugly shape after an UI parameter change when max_vol_sli_src is assigned a max_vol value. Assign it to close - VP should redraw properly, but it may not clear the assigned max_vol value
- you can't seem to be able to assign a proper auto max_vol value to the 3rd slave instance
- 2x Vertical SLI works and tested in both auto/manual, 3x SLI - only manual seems to work
Notes:
- This code is 20x-30x faster (main for cycle is removed) especially on lower tfs with long history - only 2-3 sec load/redraw time vs 30-60 sec of the old Pro versions
- Instead of repeatedly calculating the total sum of volumes for the whole range on each bar, vol sums are now increased on each bar and passed to the next in the range making it a per range vs per bar calculation that reduces time dramatically
- hist_base for levels still results is ugly redraw
- if you don't see a volume profile check range settings: min_level/max_level and spacing, set spacing to 0 (or adjust accordingly based on the symbol's precision, i.e. 0.00001)
- you can view either of Buy/Sell/Total volumes, but you can't display Buy/Sell levels at the same time using a single instance (this would 2x reduce the number of levels). Use 2 indicator instances in horiz buy/sell sli mode for that.
- Volume Profile/Value Area are calculated for a given range and updated on each bar. Each level has a fixed length. Offsets control visible level parts. Side Cover hides the invisible parts.
- Custom Color for POC/VA/VWAP levels - UI Style color/transparency can only change shape's color and doesn't affect textcolor, hence this additional option
- Custom Width - UI Style supports only width <= 4, hence this additional option
- POC is visible in both modes. In VWAP mode Developing POC becomes VWAP, VA High and Low => VWAP High and Low correspondingly to minimize the number of plot outputs
- You can't change buy/sell level colors from input (only plot transparency) - this requires 2x plot outputs => 2x reduces the number of levels to fit the max 64 limit. That's why 2 additional plots are used to dim the non Value Area zones
- All buy/sell volume lengths are calculated as % of a fixed base width = 100 bars (100%). You can't set show_last from input to change it
- There's no such thing as buy/sell volume, there's just volume, but for the purposes of the Volume Profile method, assume: bull candle = buy volume, bear candle = sell volume
P.S. Gravitonium Levels Are Increasing. Unobtainium is nowhere to be found!
Links on Volume Profile and Value Area calculation and usage:
www.tradingview.com
stockcharts.com
onlinelibrary.wiley.com
