Multiple Ticker Stochastic RSIThe Stochastic RSI is a technical indicator ranging between 0 and 100, based on applying the Stochastic oscillator formula to a set of relative strength index (RSI). Unlike the original Stochastic RSI indicator, this allows you to define up to two additional tickers for which all three will be averaged and outputted visually looking like a standard Stochastic RSI indicator. Potential buy and sell visuals are included, as well as alerts. Please note that this indicator is not meant to be used by itself.
Cerca negli script per "文华财经tick价格"

Supertrend Screener PanelScript to display Supertrend trend state of 8 different securities in a panel. Timeframe & Tickers which are to be displayed can be configured from settings.
Part of code is from the ADX DI Monitoring Panel script by u/wugamlo with his permission. Thanks to him for that and do please check out his work also.

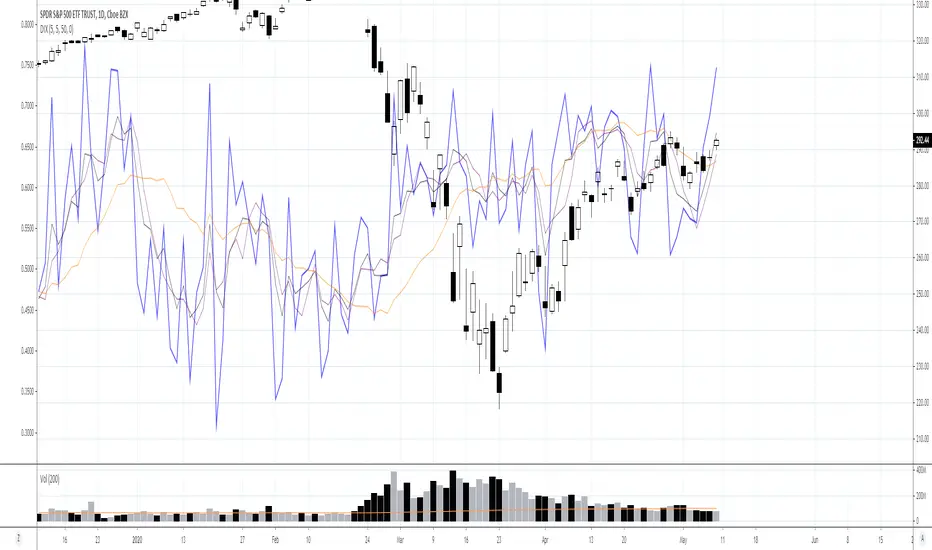
Individual Ticker DIXThis is the "DIX" for the current ticker. Includes MAs/EMAs/regression built in. One issue that I have not taken the time to figure out is that it will not update until the next day. Monday's DIX will not show on here until Tuesday for example. I am sure it is a simple solution, I just have not taken the time to figure it out. If anyone knows the solution, PM me. Thanks.
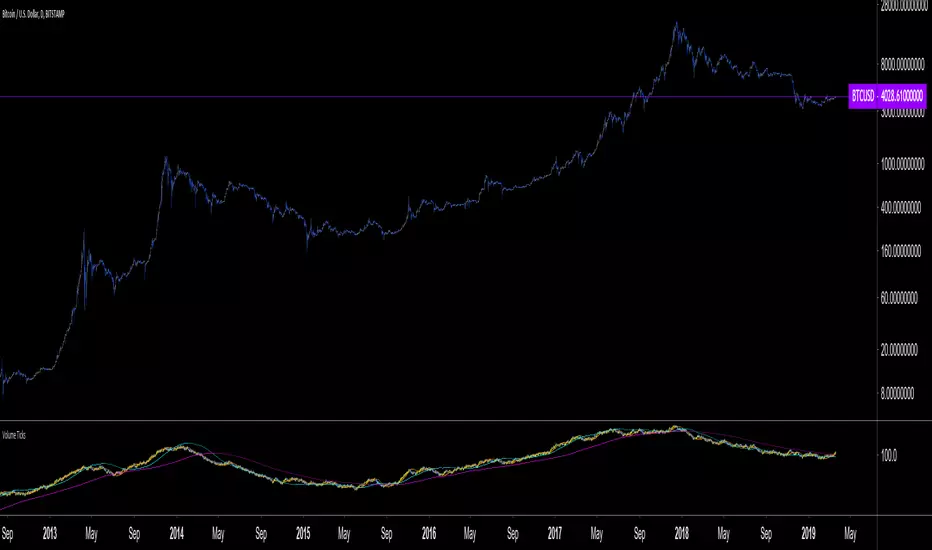
Volume Ticks - Increasing Volume Bar Count [LucF]Volume Ticks is a zero-lag market sentiment indicator. It works by providing a cumulative count of increasing volume columns.
A one count is added for each increasing volume column where close>open, and one is subtracted on an increasing volume column if close
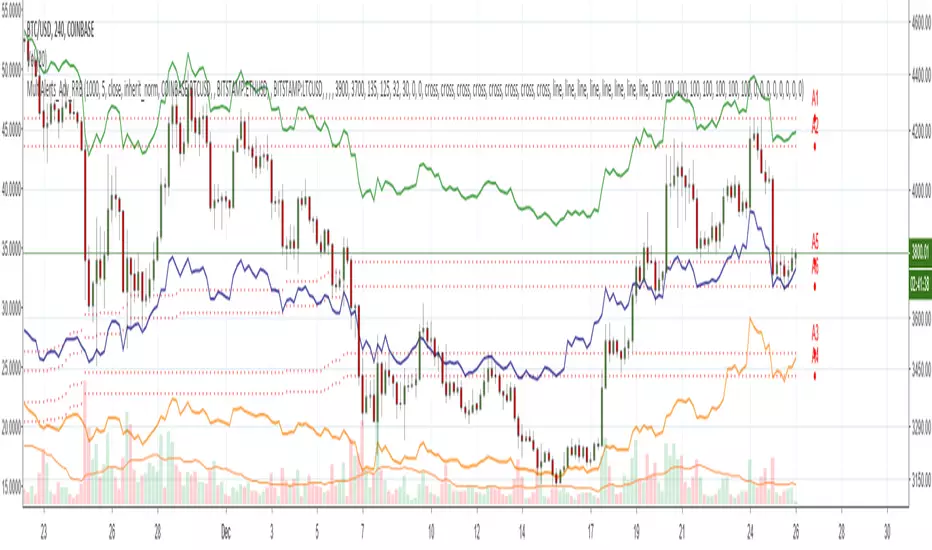
Zindarra Multi Alerts Advanced (8 Symbols, 8 Levels) by RRBZindarra Multi Alerts Advanced by RRB by RagingRocketBull 2018
Version 1.0
This indicator lets you configure multiple alert levels for several assets. Zindarra Multi Alerts Advanced supports 8 symbols with 8 custom alert levels.
You can have an M:M relationship betweeen symbols and levels, for example:
- 4 symbols each boxed by 2 alerts above/below the price
- 3 symbols with 1 alert each
- 2 symbols, 1st with 2 alerts, 2nd - with 6 alerts
- 1 symbol with 8 alerts etc
There are several versions: Simple, Pro, Advanced and Ultimate. This is the Advanced version. The Differences are listed below.
- Simple: 10 Alert Levels, 1 plot mode, alert type: cross, no colors/triggered alerts
- Pro: 9 Alert Levels, 2 plot modes: plot/price line, alert type: cross, +change/swap colors, +hide/disable triggered alerts, 2 penetration modes (close, high/low), trigger on confirmed close
- Advanced: 8 Symbols/Tickers, 8 Alert Levels, +alert types: cross up/cross down, no color change. Display sources as lines/candles, normalize, scale/shift independently
- Ultimate: 5 Symbols/Tickers, 8 Alert Levels, +alert types: volume/price %/abs change, volume/ema/time cross
Features:
- 8 custom symbols, symbols:levels = M:M
- 8 custom alert levels with labels. For each alert there must be a corresponding non-empty symbol (can be a duplicate)
- alert types: cross/cross up/cross down
- normalize symbols (and alert levels) to 100% to compare,
- scale and shift each symbol (and alert levels) to position on a chart independently
- 1 alert levels plot mode: plot
- 2 symbol types: line/candles
- colorize symbol candles
- high/low or close level penetration modes
- show/hide levels/labels
- keep or auto disable triggered alerts
- trigger alerts only after a confirmed close
You will see all symbols on a single chart at the same time with their corresponding alert levels. From this chart you can manage all alerts configured for multiple assets.
Although TradingView has 2 percentage scale modes (Percent, Indexed to 100), somehow they still fail to be usefull when comparing multiple assets.
This indicator lets you normalize all symbols to 100% making a direct single scale comparison between assets with vastly different price levels possible.
All alert levels will be normalized as well.
TradingView does not let you move the plots attached to left scale. When scaled they all remain stuck in the center and can't be moved vertically or relative to each other.
This indicator lets you position all symbols independently using individual scale and shift settings. For example, you can:
- split your screen in 3 horiz areas and have a symbol in each of them without overlapping or
- have several partially overlapping assets with different scale each or
- have all assets fully overlapping and normalized to the same 100% scale
You have to manually create an alert in Manage Alerts Panel and configure it to use with this indicator.
Free accounts are limited to only 1 alert slot and this indicator will take it (any existing alerts must be disabled/stopped).
Once the alert is configured, the indicator can be removed from chart to free a slot for another indicator, but you won't see the alert levels.
Usage:
1. attach indicator to a chart
2. define alert levels in UI settings
3. in TradingView's Manage Alerts panel on the right:
- for free accounts: disable/stop all existing alerts, you are limited to 1 alert slot only. Otherwise you won't be able to save.
- create a new Alert:
- select 'Multi Alerts' indicator name in the Condition dropdown box, leave Level 1 and Multi Alerts Cross as default options
- select 'Once Per Bar' or 'Once Per Minute' instead of 'Only Once' to trigger the alert multiple times
5. click Save. Your 9 alerts are enabled now.
Change Settings:
1. change levels/settings in UI. Any changes will also reset already triggered levels visibility.
2. in Manage Alerts panel:
- open/edit the alert you created
- select new instance of 'Multi Alerts' indicator name in the Condition dropdown box (appears at the bottom)
- check the Condition dropdown again - a single instance should remain selected.
3. click Save. Your alert settings are updated.
Notes on using alerts:
- attaching this indicator to a chart and configuring alert levels will not automatically enable the alerts - you have to manually create/configure a new alert in the Alerts Panel
- removing this indicator from chart will not disable the alerts, you have to manually disable the alert you created in the Alerts Panel
- your alert in the Alerts Panel uses another instance (copy) of indicator/settings. Any changes won't affect the alert. You have to manually update the alert every time you change any settings in the indicator.
- recompiling and attaching your own version of indicator will require creating a new Alert (delete the old one).
- alerts are designed to work in realtime. In replay mode you will see triggered alert levels hiding/changing colors but there will be no system alert messages. It's best to test the indicator in realtime on M1 (1 min) chart
- you will only see 1 system alert per bar/60 sec when multiple alert levels are crossed with a single bar or across several symbols at the same time. However all of these levels will hide in the indicator as expected.
- you can only see the alert levels when the indicator is attached to chart, they are not shown by the system alert.
- For source=high/low a directional level penetration is used automatically (crossunder/low and crossover/high). For source=close a standard bidirectional cross is used unless another alert type is specified.
- normalization breaks/distorts alert levels and symbol price - this is normal and is expected. To view the real price of alert levels uncheck normalize - the first 8 outputs are alert levels. Unnormalized levels are straight lines.
- you will see alerts from all symbols in the system alert message box of the current symbol - a bit confusing, but there's no workaround, you can't have a customized alert message for each symbol/level
- many tickers as arguments can stretch/break TradingView's Create New Alert dialog but it's still possible to push all required buttons and Save.
- duplicate symbols will be displayed by default. You can manually hide duplicates using show/hide flags.
- empty tickers (and corresponding alerts) are essentially disabled
1. uses plot*, cross*, barssince, highest, security, alertcondition
Bithumb Ticker USD/BTC PairConverts Bithumb tickers into USD or bitcoin pairings from KRW.
This currently uses the FX pair to convert. There is an option to toggle between candlesticks and line.

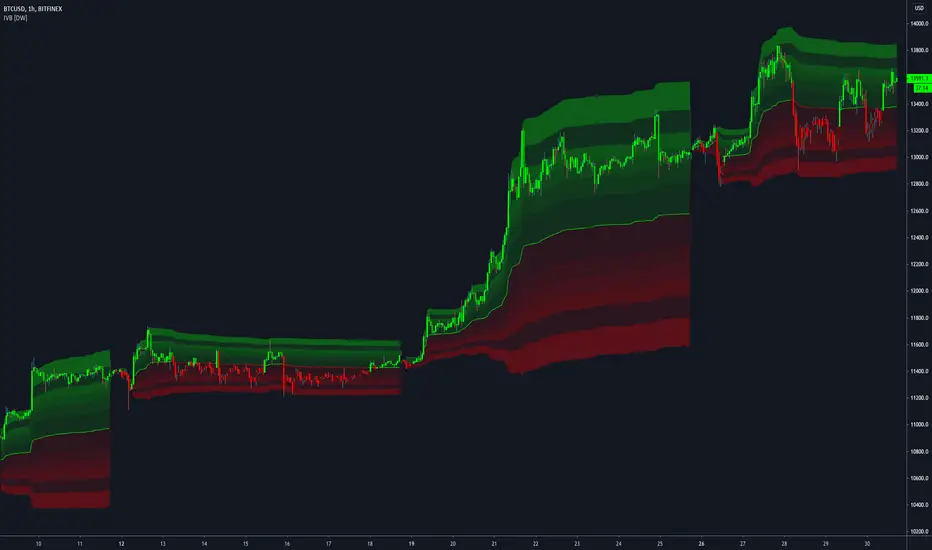
Interval Volatility Bands [DW]This is an experimental study that utilizes Volume Weighted Average Price or Time Weighted Average Price calculations, Bollinger Bands, and Fibonacci numbers to estimate volatility over a specified interval.
First, the basis is calculated by selecting:
-VWAP, which has the option to be calculated using real volume or tick volume
-TWAP, which has the option to be calculated using the standard method or exponential method
Next, standard deviation from the basis is calculated and multiplied by a specified expansion coefficient. The result is then added to and subtracted from the basis to calculate the high and low bands.
There are three band calculation methods to chosse from in this script:
-Standard, which uses the default calculations
-Average, which takes a cumulative average of standard deviation
-Hybrid, which takes the maximum of the standard and average standard deviation methods
Lastly, the high and low band ranges are multiplied by Fibonacci Percentages 23.6 - 78.6.
A custom color scheme with eight default presets to choose from is included.
Live Volume TickerGives current real-time volume of tick movements denoted in the timeframe of the current candle.

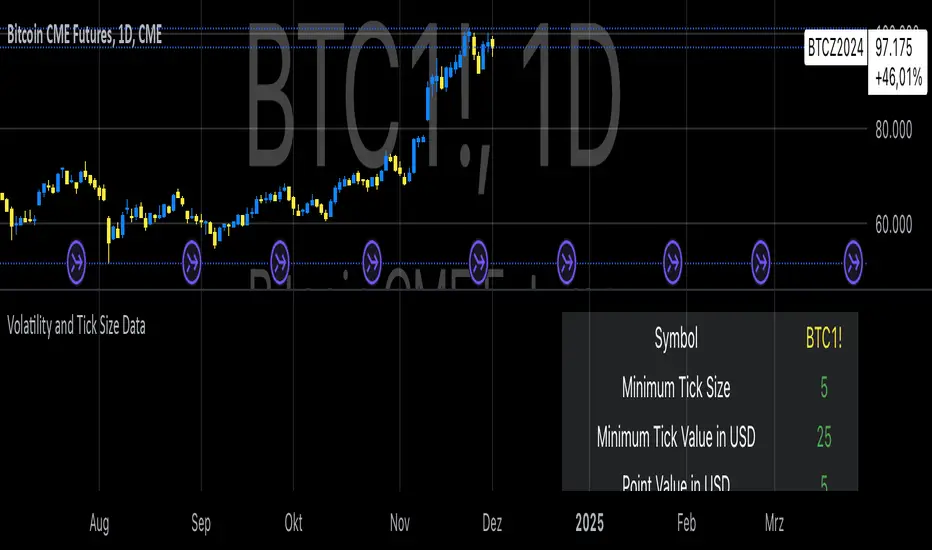
Volatility and Tick Size DataThis indicator, titled "Tick Information & Standard Deviation Table," provides detailed insights into market microstructure, including tick size, point value, and standard deviation values calculated based on the True Range. It helps visualize essential trading parameters that influence transaction costs, risk management, and portfolio performance, including volatility measures that can guide investment strategies.
Why These Data Points Are Important for Portfolio Management
Tick Size and Point Value:
Tick size refers to the smallest possible price movement in a given asset. It defines the granularity of the price changes, affecting how precise the market price can be at any moment. Point value reflects the monetary value of a single price movement (one tick). These two data points are essential for understanding transaction costs and for evaluating how much capital is at risk per price movement. Smaller tick sizes may lead to more efficient pricing in high-frequency trading strategies (Hasbrouck, 2009).
Reference: Hasbrouck, J. (2009). Empirical Market Microstructure. Foundations and Trends® in Finance, 3(4), 169-272.
Standard Deviations and Volatility:
Standard deviation measures the variability or volatility of an asset's price over a set period. This data point is critical for portfolio management, as it helps to quantify risk and predict potential price movements. True Range and its standard deviations provide a more comprehensive measure of market volatility than just price fluctuations, as they include gaps and extreme price changes. Investors use volatility data to assess the potential risk and adjust portfolio allocations accordingly (Ang, 2006).
Reference: Ang, A. (2006). Asset Management: A Systematic Approach to Factor Investing. Oxford University Press.
Risk Management:
The ability to quantify risk through metrics like the 1st, 2nd, and 3rd standard deviations of the true range is essential for implementing risk controls within a portfolio. By incorporating volatility data, portfolio managers can adjust their strategies for different market conditions, potentially reducing exposure to high-risk environments. These volatility measures help in setting stop-loss levels, optimizing position sizes, and managing the portfolio’s overall risk-return profile (Black & Scholes, 1973).
Reference: Black, F., & Scholes, M. (1973). The Pricing of Options and Corporate Liabilities. Journal of Political Economy, 81(3), 637-654.
Portfolio Diversification and Hedging:
Understanding asset volatility and transaction costs is critical when constructing a diversified portfolio. By using the standard deviations from this indicator, investors can better identify assets that may provide diversification benefits, potentially reducing the overall portfolio risk. Moreover, the point values and tick sizes help assess the cost-effectiveness of various assets, enabling portfolio managers to implement more efficient hedging strategies (Markowitz, 1952).
Reference: Markowitz, H. (1952). Portfolio Selection. The Journal of Finance, 7(1), 77-91.
Conclusion
The Tick Information & Standard Deviation Table provides critical market data that informs the risk management, diversification, and pricing strategies used in portfolio management. By incorporating tick size, point value, and volatility metrics, investors can make more informed decisions, better manage risk, and optimize the returns on their portfolios. The data serves as an essential tool for aligning asset selection and portfolio allocations with the investor's risk tolerance and market conditions.
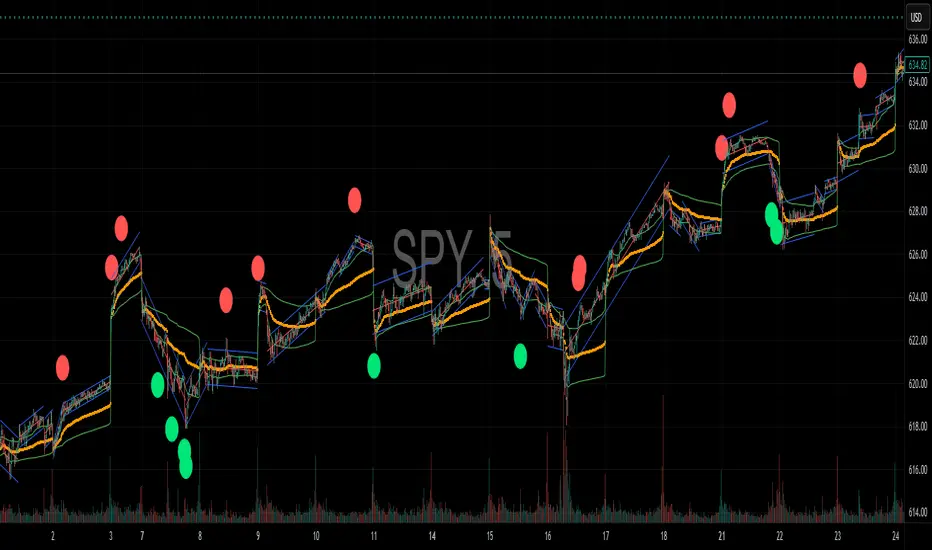
Reversal Signal avec TICK + RSIThis indicator is a potential reversal indicator for SCALPING, don't use it for swing. It's base on TICK and on an overbrought/oversold condition of the RSI. You can play with the setting, typicaly I like my TICK to be over reacting an 800/-800 and my rsi over 20 and 80, but it give not enough signal. So I set the TICK signal at 651/-651 and the RSI at 25/75. This indicator is made for SP500 and Nasdaq, so SPY/QQQ/SPX/ES/NQ should work well. It's the first version of it, so maybe I'll add so more data to it to increase signal and lower false one. For now I've test it on live market yet(26/7/25).
The RSI is Fast(5 period), I like to use it on the 1 or 5 min chart.
Please not that it only work during 9h30am to 4pm EST.(Because of the TICK)
Feel free to try and even comment. Don't be harsh on me, it's my first try!
(Sorry for my 'english' it's not my first language)
FAUCON
Enhanced Stock Ticker with 50MA vs 200MADescription
The Enhanced Stock Ticker with 50MA vs 200MA is a versatile Pine Script indicator designed to visualize the relative position of a stock's price within its short-term and long-term price ranges, providing actionable bullish and bearish signals. By calculating normalized indices based on user-defined lookback periods (defaulting to 50 and 200 bars), this indicator helps traders identify potential reversals or trend continuations. It offers the flexibility to plot signals either on the main price chart or in a separate lower pane, leveraging Pine Script v6's force_overlay functionality for seamless integration. The indicator also includes a customizable ticker table, visual fills, and alert conditions for automated trading setups.
Key Features
Dual Lookback Indices: Computes short-term (default: 50 bars) and long-term (default: 200 bars) indices, normalizing the closing price relative to the high/low range over the specified periods.
Flexible Signal Plotting: Users can toggle between plotting crossover signals (triangles) on the main price chart (location.abovebar/belowbar) or in the lower pane (location.top/bottom) using the Plot Signals on Main Chart option.
Crossover Signals: Generates bullish (Golden Cross) and bearish (Death Cross) signals when the short or long index crosses above 5 or below 95, respectively.
Visual Enhancements:
Plots short-term (blue) and long-term (white) indices in a separate pane with customizable lookback periods.
Includes horizontal reference lines at 0, 20, 50, 80, and 100, with green and red fills to highlight overbought/oversold zones.
Dynamic fill between indices (green when short > long, red when long > short) for quick trend visualization.
Displays a ticker and legend table in the top-right corner, showing the symbol and lookback periods.
Alert Conditions: Supports alerts for bullish and bearish crossovers on both short and long indices, enabling integration with TradingView's alert system.
Technical Innovation: Utilizes Pine Script v6's force_overlay parameter to plot signals on the main chart from a non-overlay indicator, combining the benefits of a separate pane and chart-based signals in a single script.
Technical Details
Calculation Logic:
Uses confirmed bars (barstate.isconfirmed) to calculate indices, ensuring reliability by avoiding real-time bar fluctuations.
Short-term index: (close - lowest(low, lookback_short)) / (highest(high, lookback_short) - lowest(low, lookback_short)) * 100
Long-term index: (close - lowest(low, lookback_long)) / (highest(high, lookback_long) - lowest(low, lookback_long)) * 100
Signals are triggered using ta.crossover() and ta.crossunder() for indices crossing 5 (bullish) and 95 (bearish).
Signal Plotting:
Main chart signals use force_overlay=true with location.abovebar/belowbar for precise alignment with price bars.
Lower pane signals use location.top/bottom for visibility within the indicator pane.
Plotting is controlled by boolean conditions (e.g., bullishLong and plot_on_chart) to ensure compliance with Pine Script's global scope requirements.
Performance Considerations: Optimized for efficiency by calculating indices only on confirmed bars and using lightweight plotting functions.
How to Use
Add to Chart:
Copy the script into TradingView's Pine Editor and add it to your chart.
Configure Settings:
Short Lookback Period: Adjust the short-term lookback (default: 50 bars) to match your trading style (e.g., 20 for shorter-term analysis).
Long Lookback Period: Adjust the long-term lookback (default: 200 bars) for broader market context.
Plot Signals on Main Chart: Check this box to display signals on the price chart; uncheck to show signals in the lower pane.
Interpret Signals:
Golden Cross (Bullish): Green (long) or blue (short) triangles indicate the index crossing above 5, suggesting a potential buying opportunity.
Death Cross (Bearish): Red (long) or white (short) triangles indicate the index crossing below 95, signaling a potential selling opportunity.
Set Alerts:
Use TradingView's alert system to create notifications for the four alert conditions: Long Index Valley, Long Index Peak, Short Index Valley, and Short Index Peak.
Customize Visuals:
The ticker table displays the symbol and lookback periods in the top-right corner.
Adjust colors and styles via TradingView's settings if desired.
Example Use Cases
Swing Trading: Use the short-term index (e.g., 50 bars) to identify short-term reversals within a broader trend defined by the long-term index.
Trend Confirmation: Monitor the fill between indices to confirm whether the short-term trend aligns with the long-term trend.
Automated Trading: Leverage alert conditions to integrate with bots or manual trading strategies.
Notes
Testing: Always backtest the indicator on your chosen market and timeframe to validate its effectiveness.
Optional Histogram: The script includes a commented-out histogram for the index difference (index_short - index_long). Uncomment the plot(index_diff, ...) line to enable it.
Compatibility: Built for Pine Script v6 and tested on TradingView as of May 27, 2025.
Acknowledgments
This indicator was inspired by the need for a flexible tool that combines lower-pane analysis with main chart signals, made possible by Pine Script's force_overlay feature. Share your feedback or suggestions in the comments below, and happy trading!

Live Risk/Reward Lines (Dynamic Update: Tick or Bar Close)This script displays dynamic Risk and Reward target lines directly on the chart.
You can choose whether the updates happen live with each price tick or only once a bar closes.
It supports both long and short trading directions, with customizable risk and reward percentages.
Key Features:
Dynamic live updates (per tick or per bar close).
Choose Long or Short trade direction.
Customize risk and reward percentages individually.
Adjustable line length and color.
Option to show or hide risk and reward lines.
How It Works:
For long trades: Risk = Close Price * (1 - Risk %), Reward = Close Price * (1 + Reward %).
For short trades: Risk = Close Price * (1 + Risk %), Reward = Close Price * (1 - Reward %).
Lines are automatically centered around the current bar.
Why It Is Unique:
Unlike static risk/reward indicators, this script allows traders to see real-time dynamic changes based on the latest tick or bar close.
It offers full flexibility for scalpers and swing traders by allowing manual control over update timing and visualization style.
Usage Instructions:
Select your trade direction (Long or Short) from the settings.
Set your preferred risk and reward percentages.
Choose whether lines should update with every tick or only on bar close.
Optionally adjust the length and colors of the lines.
Important:
The script focuses on visualizing risk and reward directly on the price chart without giving buy or sell signals.
Disclaimer:
This tool is intended for educational and informational purposes only and should not be considered financial advice.

Multi-Ticker RS vs SPYThis Pine Script, titled "Multi-Ticker RS vs SPY," is a clean and efficient indicator designed for TradingView, enabling traders to monitor the relative strength (RS) of up to 10 ticker symbols compared to the S&P 500 ETF (SPY) on a single chart. Ideal for options traders, such as those managing a $1,400 account, it provides a simple way to assess which stocks are outperforming or underperforming the broader market. As of February 26, 2025, the script supports any chart timeframe, such as 5-minute or daily intervals, and calculates RS based on a user-defined lookback period, defaulting to 1 bar for real-time insights.
Users can input ticker symbols via customizable settings, with defaults set to popular stocks like AAPL, TSLA, NVDA, GOOGL, AMZN, MSFT, FB, NFLX, INTC, and PYPL. The script fetches closing prices for each ticker and SPY, computes their percentage changes over the lookback period, and determines RS as the ratio of each ticker’s change to SPY’s change, handling division by zero gracefully. It displays each ticker’s current RS score in a vertical column of labels on the chart’s top-left corner, updated on the last bar to avoid clutter. Users can adjust label size (tiny, small, normal, large) and text color for visibility, ensuring a tailored, error-free experience for quick market analysis.

DF: Horizontal Levels and Colors for NYSE TICK Chart
DF: Horizontal Levels and Colors for NYSE TICK Chart
This is intended to be added very specifically to your NYSE TICK chart.
This script creates a custom indicator designed to enhance the visual analysis
of market breadth through the NYSE TICK data. It features:
1. **Horizontal Levels**:
- **1300 and -1300**: Gray lines indicating extreme bullish and bearish conditions.
- **1000 and -1000**: Light red and green lines representing significant support and resistance zones.
- **850 and -850**: Customizable blue lines that can be adjusted according to user preferences.
**Zero Line**: A solid white line marking the neutral point, drawn prominently for quick reference.
2. **Color Fills**:
- Red fill between 1000 and 1300 to highlight extreme bullish sentiment.
- Green fill between -1000 and -1300 to signify extreme bearish sentiment.
3. **Exponential Moving Average (EMA)**:
- Calculated based on user-defined length (default set to 8).
- The EMA line's color dynamically adjusts based on its slope:
- White when trending upwards.
- Magenta when trending downwards, providing quick visual cues of market momentum.
Overall, this script serves as a powerful tool for traders seeking to visualize market trends, support and resistance levels, and market breadth through the NYSE TICK data, enhancing their decision-making process in trading.

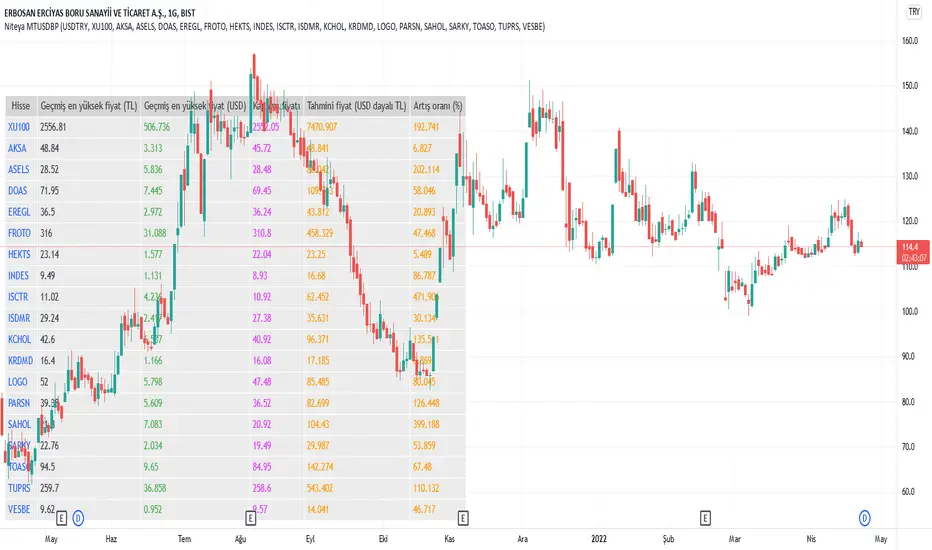
Niteya Multi Ticker Dollar-Based Pricing Ver 1.3The main purpose of the indicator is to make a future price estimation based on the highest dollar-based price of the stock in the past, especially for stocks that exceed their past prices in chart currency terms. There should be no expectation that this prediction will necessarily come true.
A table with six columns and 19 rows (excluding the header) is created on the graph, positioned bottom and left.
The first column contains the ticker code, the second column contains the highest historical price of the stock in currency, the third column contains the past high price of the stock in USD, the fourth column contains the closing price, the fifth column contains the value obtained by multiplying the past highest USD price of the stock by the daily dollar price, and the sixth column is includes the rate of increase.
Using the indicator interface, you can select the ticker value in the first row of the table from among 22 different values via a selection box, and for the 18 rows below, you can directly type the ticker name.
* The currency of the chart must be compatible with the dollar conversion currency. For example, if the conversion currency is "USDTRY", the currency of the chart should be "TRY".
All stocks in the indicator are randomly selected. Investment information, stock selections, comments and recommendations herein are not within the scope of investment consultancy. Investment consultancy service is provided within the framework of investment consultancy agreement to be signed between brokerage houses, portfolio management companies, non-deposit banks and the customer.
Türkçe açıklama
Göstergenin temel amacı, özellikle grafik para birimi (TRY) bazında geçmiş fiyatlarının üzerine çıkmış hisselerde, hissenin geçmişteki en yüksek dolar bazlı fiyatını esas alarak, geleceğe yönelik bir fiyat tahmininde bulunmaktır. Bu tahminin mutlaka gerçekleşeceği beklentisi olmamalıdır.
Grafik üzerinde, üste ve ortalanmış olarak, altı sütun ve başlık kısmı hariç 19 satırlık bir tablo oluşturulmaktadır.
İlk sütun hisse kodunu, ikinci sütun hissenin geçmiş en yüksek fiyatını TRY olarak, üçüncü sütun hissenin geçmiş en yüksek fiyatını USD olarak, dördüncü sütun kapanış fiyatını, beşinci sütun hissenin geçmiş en yüksek USD fiyatının günlük dolar kuru ile çarpılarak elde edilen değeri, altıncı sütun ise artış oranını içerir.
Gösterge arayüzünü kullanarak, tablonun ilk satırındaki ticker (hisse) değerini 22 farklı değer arasından (BIST 100 ve 21 şirket) bir seçim kutusu yoluyla, altta yer alan 18 satır için ise, doğrudan hisse adını yazabilirsiniz.
* Grafiğin para birimi dolar çevrim kuru ile uyumlu olmalıdır. Örneğin, çevrim kuru "USDTRY" ise, grafiğin para birimi "TRY" olmalıdır.
Gösterge içinde yer alan tüm hisseler rastgele seçilmiştir. Buradaki yatırım bilgileri, hisse seçimleri, yorum ve tavsiyeleri yatırım danışmanlığı kapsamında değildir. Yatırım danışmanlığı hizmeti, aracı kurumlar, portföy yönetim şirketleri, mevduat kabul etmeyen bankalar ile müşteri arasında imzalanacak yatırım danışmanlığı sözleşmesi çerçevesinde sunulmaktadır.
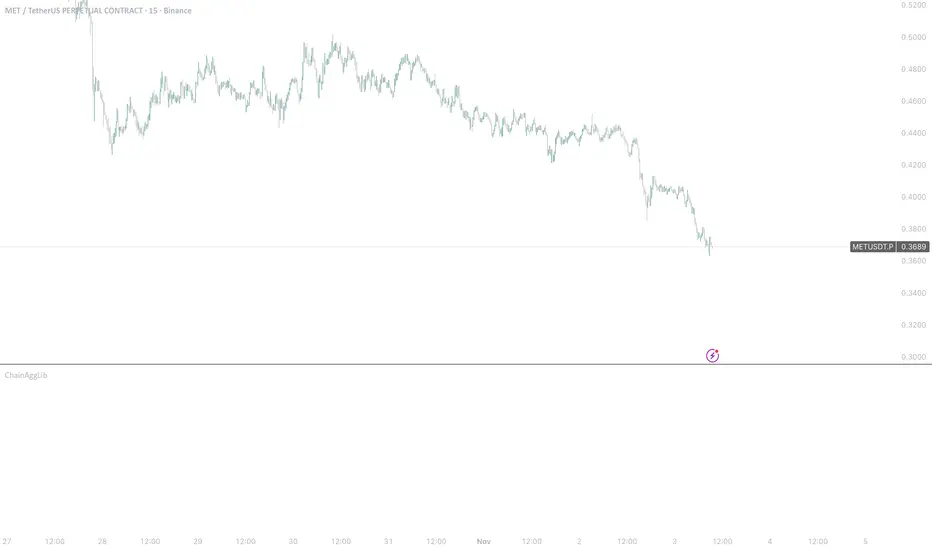
ChainAggLib - library for aggregation of main chain tickersLibrary "ChainAggLib"
ChainAggLib — token -> main protocol coin (chain) and top-5 exchange tickers for volume aggregation.
Library only (no plots). All helpers are pure functions and do not modify globals.
norm_sym(s)
Parameters:
s (string)
get_base_from_symbol(full_symbol)
Parameters:
full_symbol (string)
get_chain_for_token(token_symbol)
Parameters:
token_symbol (string)
get_top5_exchange_tickers_for_chain(chain_code)
Parameters:
chain_code (string)
get_top5_exchange_tickers_for_token(token_symbol)
Parameters:
token_symbol (string)
join_tickers(arr)
Parameters:
arr (array)
contains_symbol(arr, symbol)
Parameters:
arr (array)
symbol (string)
contains_current(arr)
Parameters:
arr (array)
get_arr_for_current_token()
get_chain_for_current()
Avg Candle Size Table (Ticks) The average of the last N candles in ticks shown on a table in the top right of the chart

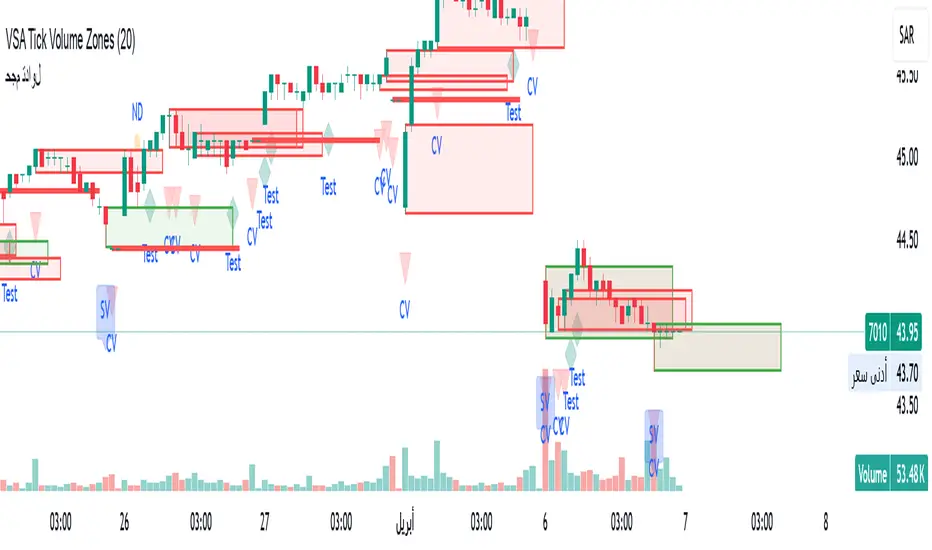
VSA Tick Volume Zones0
مؤشر VSA Tick Volume مع مناطق العرض والطلب (إصدار تجريبي)
مؤشر مخصص لمنصة TradingView يعتمد على تحليل الحجم والسعر (VSA - Volume Spread Analysis)، ويقوم تلقائيًا بتحديد مناطق الطلب والعرض استنادًا إلى إشارات VSA القوية. يهدف المؤشر إلى كشف تحركات المتداولين المحترفين وتحديد نقاط الانعكاس الذكية.
---
✅ الميزات الأساسية:
1. إشارات VSA:
المؤشر يتعرف تلقائيًا على أبرز إشارات تحليل VSA:
- *Climactic Volume (CV):* حجم تداول مرتفع بشكل استثنائي يشير لنهاية الاتجاه الحالي.
- *No Demand (ND):* شموع صعودية ضعيفة الحجم، تشير إلى غياب اهتمام المشترين.
- *No Supply (NS):* شموع هبوطية ضعيفة الحجم، تشير إلى غياب اهتمام البائعين.
- *Stopping Volume (SV):* ارتفاع مفاجئ في الحجم بعد اتجاه هابط، يشير لتدخل المشترين.
- *UpThrust (UT):* اختراق كاذب للسعر نحو الأعلى مع حجم كبير وإغلاق منخفض.
- *Test (T):* شموع اختبارية بحجم منخفض للتحقق من غياب البائعين استعدادًا للصعود.
2. تلوين الشموع:
- كل إشارة تُلوَّن تلقائيًا على الشارت لتسهيل المتابعة البصرية:
- CV باللون الأحمر
- ND باللون البرتقالي
- NS باللون الأخضر
- SV باللون الأزرق
- UT باللون الأرجواني
- Test باللون السماوي
3. رسم مناطق العرض والطلب تلقائيًا:
- يتم تحديد المناطق بناءً على إشارات *UT* و*SV* و*Test*، حيث تعتبر مناطق تمركز ذكي للمؤسسات (Smart Money Zones).
🎯 الهدف من المؤشر:
يساعد هذا المؤشر:
- المتداول اليومي على اتخاذ قرارات مدروسة.
- المحلل الفني على فهم السياق المؤسساتي للسوق.
- دعم استراتيجيات الدخول والخروج بدقة أعلى من خلال الدمج بين إشارات VSA والمناطق الفعلية للعرض والطلب.
---
🧪 ملاحظات:
- المؤشر لا يعتبر توصية شراء أو بيع.
- الإشارات تحتاج إلى تأكيد من خلال حركة السعر أو مؤشرات مساعدة.
- يمكن استخدامه مع أدوات إضافية مثل RSI أو Moving Averages.
---
⚙ الاقتراحات المستقبلية:
- دمج أدوات تدفق السيولة (مثل OBV أو VWAP).
- تنبيه صوتي وإشعار عند ظهور إشارات محددة.
- تخصيص أكبر للمستخدم من حيث الألوان ونوع الإشارات.
---
للتواصل أو المساهمة في تطوير المؤشر، يرجى مراسلتي.
VSA Tick Volume Indicator with Supply and Demand Zones (Beta Version)
A custom indicator for the TradingView platform based on Volume and Price Analysis (VSA - Volume Spread Analysis), it automatically identifies supply and demand zones based on strong VSA signals. The indicator aims to uncover the movements of professional traders and identify smart reversal points.
✅ Key Features:
VSA Signals: The indicator automatically detects key VSA analysis signals:
Climactic Volume (CV): Exceptionally high trading volume indicating the end of the current trend.
No Demand (ND): Bullish candles with weak volume, indicating a lack of buyer interest.
No Supply (NS): Bearish candles with weak volume, indicating a lack of seller interest.
Stopping Volume (SV): A sudden volume spike after a downtrend, indicating buyer intervention.
UpThrust (UT): A false price breakout upwards with high volume and a low close.
Test (T): Low-volume test candles to check for the absence of sellers, signaling readiness for an upward move.
Candle Coloring:
Each signal is automatically color-coded on the chart for easy visual tracking:
CV in red
ND in orange
NS in green
SV in blue
UT in purple
Test in cyan
Automatic Supply and Demand Zone Drawing:
Zones are determined based on the UT, SV, and Test signals, which are considered smart money zones.
🎯 Purpose of the Indicator:
This indicator helps:
The day trader make informed decisions.
The technical analyst understand the market's institutional context.
Enhance entry and exit strategies with more accuracy by combining VSA signals and actual supply and demand zones.
🧪 Notes:
The indicator is not a buy or sell recommendation.
Signals need confirmation through price action or additional indicators.
Can be used alongside other tools such as RSI or Moving Averages.
⚙ Future Suggestions:
Integration of liquidity flow tools (such as OBV or VWAP).
Sound alerts and notifications when specific signals appear.
Greater customization options for users regarding colors and signal types.
For inquiries or contributions to the indicator's development, please contact me.
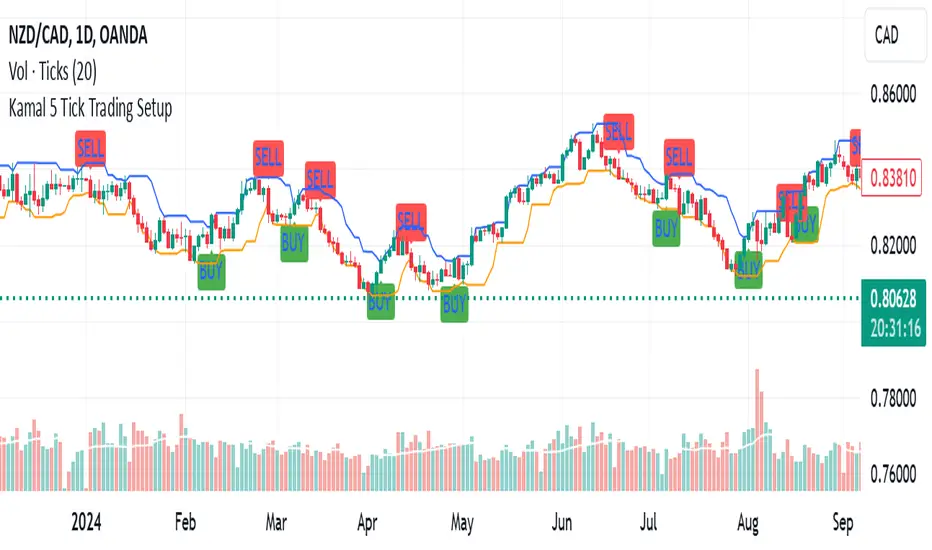
Kamal 5 Tick Trading SetupKamal 5 Tick Trading Setup
The "Kamal 5 Tick Trading Setup" is a custom indicator designed by Kamal Preet Singh Trader for TradingView to identify potential Buy and Sell signals on daily forex charts. This indicator helps traders make informed decisions based on the price action of the previous five daily candles.
Indicator Logic:
Buy Signal: A Buy signal is generated when the closing price of the current candle exceeds the highest high of the previous five daily candles.
Sell Signal: A Sell signal is generated when the closing price of the current candle falls below the lowest low of the previous five daily candles.
Features:
Lookback Period: The indicator uses a lookback period of five candles to determine the highest high and lowest low.
Visual Signals: Buy signals are plotted as green "BUY" labels below the candles, while Sell signals are plotted as red "SELL" labels above the candles.
Debugging Plots: The highest high and lowest low of the previous five candles are plotted as blue and orange lines, respectively, to help verify the conditions for Buy and Sell signals.
Non-Repetitive Signals: The indicator ensures that once a Buy signal is given, no further Buy signals are generated until a Sell signal is given, and vice versa.
Usage:
Apply the indicator to your daily forex chart in TradingView.
Observe the plotted Buy and Sell signals to identify potential entry and exit points.
Use the debugging plots to ensure the conditions for the signals are being met correctly.
This indicator provides a straightforward approach to trading based on recent price action, helping traders capitalize on potential breakout and breakdown opportunities.
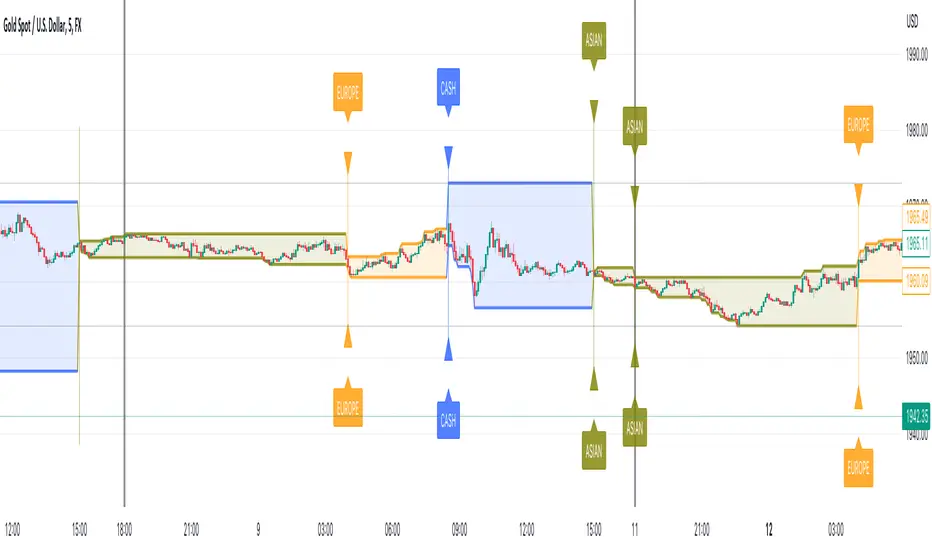
Session Tick-BoxThe "Session Tick-Box" is designed to display session-related information on the chart (HIGH/LOW box). Here's a breakdown of its features and functionalities:
Session Settings:
You can specify different sessions such as the Cash Session, Asian Session, European Session, and Offset Session using the input.session() function.
The sat.session_tick() function is used to calculate the low, high, fill color, open bar status, and session open status for each session.
Display Settings:
You have the option to show a new daily session using the separateDays input. The background color for the new session can be customized using the Day_Bg input.
The colorDays input allows you to enable or disable coloring the background based on different days of the week.
You can customize the colors for the Cash, Asian, European, and Offset sessions using the respective color inputs.
Other Features:
The indicator calculates the percentage change between the low and high of each session using the sat.AbsPercentChange() function.
Labels are added to mark the high and low points of the sessions.
A vertical line is drawn between the low and high points of each session using the line.new() function.
The fill() function is used to create a shaded area between the low and high lines of each session.
Overall, the "Session Tick-Box" indicator provides visual representation and analysis of different sessions on the chart, including their respective ranges and percentage changes.
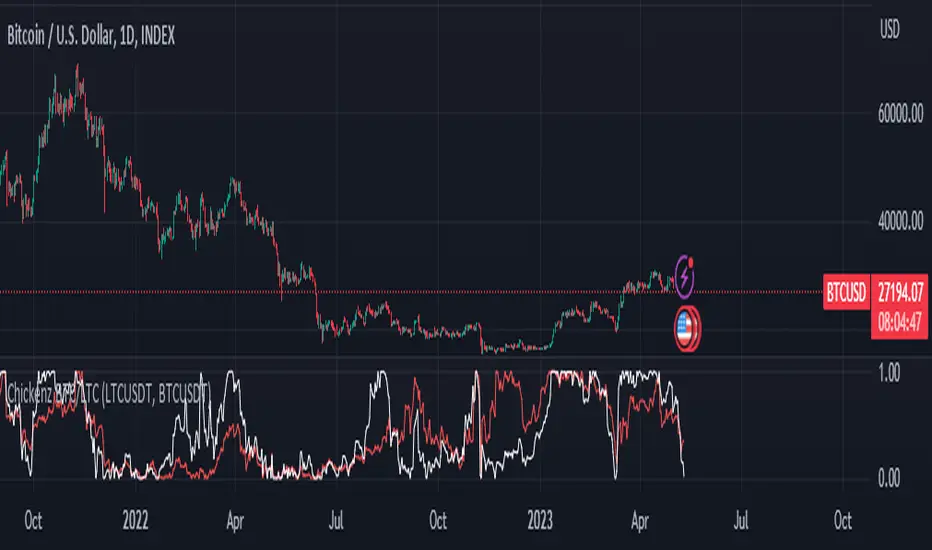
Chickenz Compare performance of 2 Tickers (Default - BTC/LTC)Compare relative performance of 2 Tickers directly on one chart. Default BTC/LTC but can be adjusted to any pair.
First attempt at pine scripts so go gentle on feedback ;)
In Chart Currency TickersQuick View of Multiple Currencies & Gold Price on Chart
In Chart Currency Tickers will help quick view of Multiple Currencies (Up/Down points & Percentage), you can change symbols on settings as per your requirement
മെയിൻ കറൻസികളും സ്വർണവിലയും റിയൽ ടൈം മോണിറ്റർ ചെയ്യുന്നതിനും മാർക്കറ്റ് സെന്റിമെൻറ് അറിയുന്നതിനും അതിനനുസരിച്ച് ട്രേഡിങ്ങ് ഡിസിഷൻ എടുക്കുന്നതിനും നിങ്ങളെ സഹായിക്കുന്നു
Happy Trading to All..!!!
Asif Kerim Naduvilaparambil

Symbol InfoFor those who likes clean chart:
Adjustable Symbol ticker and timeframe( AKA watermark) script is here.
1: You can place Symbol ticker and timeframe info anywhere on the chart.
Also you can hide one of them or both.
Position:
Horizontal options: Left Center Right
Vertical options: Top Middle Bottom
Size: Tiny Smal Normal Large Huge Auto
Color is adjustable. Background is optional too.
2: Even more cool part is you can add 2 different custom texts that can switch. (Idea from Pinecoders original script)
You don't have to use text function and reposition it everytime, your message will always stays at one place.
Let the chart deliver your message.
I put my favourite trading slangs there:
1. Do Your Own Research (DYOR)
2. Not a Financial Advice ( NFA)
