Scout Regiment - D17# Scout Regiment - D17 Indicator
## English Documentation
### Overview
Scout Regiment - D17 is a comprehensive TradingView indicator that combines multiple technical analysis tools into one powerful overlay indicator. It provides traders with market structure analysis, divergence detection, volume profiling, smart money concepts, and session analysis.
### Key Features
#### 1. **EMA (Exponential Moving Averages)**
- **Purpose**: Trend identification and dynamic support/resistance levels
- **Configuration**: 13 customizable EMAs with adjustable periods
- **Default Active EMAs**: EMA 3 (21), EMA 5 (55), EMA 7 (144), EMA 8 (233)
- **Uses**: Identify trend direction, entry/exit points, and trend strength
- **Color Coding**: Different colors for easy visual distinction
#### 2. **TFMA (Timeframe Moving Averages)**
- **Purpose**: Multi-timeframe trend analysis
- **Features**:
- 3 EMAs on higher timeframes
- Dynamic labels showing trend direction
- Price difference percentage display
- Customizable timeframe settings
- **Default Settings**: 21-period timeframe with lengths 55, 144, and 233
- **Benefits**: Align trades with higher timeframe trends
#### 3. **DFMA (Daily Frame Moving Averages)**
- **Purpose**: Daily timeframe perspective on any chart
- **Features**: Similar to TFMA but specifically for daily analysis
- **Default Timeframe**: 1D (Daily)
- **Use Case**: Long-term trend confirmation and positioning
#### 4. **PMA (Price Moving Averages)**
- **Purpose**: Price channel analysis with filled areas
- **Configuration**: 7 customizable moving averages with fill zones
- **Default Lengths**: 12, 144, 169, 288, 338, 576, 676
- **Visual**: Color-filled zones between selected MAs for channel trading
#### 5. **VWAP (Volume Weighted Average Price)**
- **Purpose**: Institutional trading levels and fair value
- **Features**:
- Multiple anchor periods (Session, Week, Month, Quarter, Year, etc.)
- Standard deviation bands
- Corporate event anchoring (Earnings, Dividends, Splits)
- **Use Case**: Identify institutional support/resistance and mean reversion opportunities
#### 6. **Divergence Detector**
- **Purpose**: Identify potential trend reversals
- **Supported Indicators**: MACD, MACD Histogram, RSI, Stochastic, CCI, Williams %R, Bias, Momentum, OBV, SOBV, VWmacd, CMF, MFI, and external indicators
- **Divergence Types**:
- Regular Bullish/Bearish
- Hidden Bullish/Bearish
- **Features**:
- Automatic divergence line drawing
- Customizable detection parameters
- Color-coded alerts
#### 7. **Volume Profile & Node Detection**
- **Purpose**: Identify key price levels based on volume distribution
- **Features**:
- Volume Profile with POC (Point of Control)
- Value Area High (VAH) and Value Area Low (VAL)
- Peak and trough volume node detection
- Highest/lowest volume node highlighting
- **Lookback**: Configurable (default 377 bars)
- **Use Case**: Identify support/resistance zones and liquidity areas
#### 8. **Smart Money Concepts**
- **Purpose**: Track institutional trading patterns
- **Features**:
- Market Structure (BOS - Break of Structure, CHoCH - Change of Character)
- Internal and Swing structures
- Strong/Weak Highs and Lows
- Equal Highs/Lows detection
- Fair Value Gaps (FVG)
- **Modes**: Historical or Present (latest only)
- **Use Case**: Trade with institutional flow
#### 9. **Trading Sessions**
- **Purpose**: Analyze market behavior during different global sessions
- **Available Sessions**:
- Asian Session
- Sydney, Tokyo, Shanghai, Hong Kong
- European Session
- London, New York, NYSE
- **Features**:
- Session boxes with high/low visualization
- Real-time countdown timers
- Volume and price change tracking
- Information table with session statistics
- **Customization**: Choose which sessions to display, colors, and box styles
### How to Use
#### For Trend Following:
1. Enable EMAs 3, 5, 7, and 8
2. Use TFMA for higher timeframe confirmation
3. Look for price above/below key EMAs for trend direction
4. Use VWAP as additional confirmation
#### For Reversal Trading:
1. Enable Divergence Detector with MACD Histogram and Bias
2. Look for divergences at key support/resistance levels
3. Confirm with Smart Money CHoCH signals
4. Use Volume Profile nodes as entry/exit targets
#### For Intraday Trading:
1. Enable Trading Sessions
2. Focus on high-volume sessions (London, New York overlap)
3. Use session highs/lows as support/resistance
4. Trade Fair Value Gaps during active sessions
#### For Swing Trading:
1. Use DFMA for daily trend
2. Enable PMA for channel identification
3. Look for price reactions at volume profile value areas
4. Confirm with swing structure breaks
### Best Practices
1. **Don't Overcrowd**: Enable only the components you need for your strategy
2. **Multi-Timeframe Analysis**: Always check higher timeframe TFMA/DFMA
3. **Confluence**: Look for multiple signals confirming the same direction
4. **Volume Confirmation**: Use Volume Profile to validate price action
5. **Session Awareness**: Be aware of which session is active for volatility expectations
### Performance Optimization
- Disable unused features to improve chart loading speed
- Use "Present Mode" for Smart Money Concepts if historical data isn't needed
- Reduce Volume Profile lookback period on slower devices
### Alerts
The indicator includes alert conditions for:
- All divergence types (8 conditions)
- Smart Money structure breaks (8 conditions)
- Equal highs/lows detection
- Fair Value Gaps formation
---
## 中文说明文档
### 概述
Scout Regiment - D17 是一款综合性TradingView指标,将多个技术分析工具整合到一个强大的叠加指标中。它为交易者提供市场结构分析、背离检测、成交量分析、聪明钱概念和时区分析。
### 核心功能
#### 1. **EMA(指数移动平均线)**
- **用途**:趋势识别和动态支撑阻力位
- **配置**:13条可自定义周期的EMA
- **默认启用**:EMA 3(21)、EMA 5(55)、EMA 7(144)、EMA 8(233)
- **应用**:识别趋势方向、进出场点位和趋势强度
- **颜色编码**:不同颜色便于视觉区分
#### 2. **TFMA(时间框架移动平均线)**
- **用途**:多时间框架趋势分析
- **特点**:
- 3条更高时间框架的EMA
- 显示趋势方向的动态标签
- 价格差异百分比显示
- 可自定义时间框架设置
- **默认设置**:21周期时间框架,长度为55、144和233
- **优势**:使交易与更高时间框架趋势保持一致
#### 3. **DFMA(日线框架移动平均线)**
- **用途**:在任何图表上提供日线时间框架视角
- **特点**:与TFMA类似,但专门用于日线分析
- **默认时间框架**:1D(日线)
- **使用场景**:长期趋势确认和定位
#### 4. **PMA(价格移动平均线)**
- **用途**:价格通道分析与填充区域
- **配置**:7条可自定义的移动平均线,带填充区域
- **默认长度**:12、144、169、288、338、576、676
- **视觉效果**:选定MA之间的彩色填充区域,用于通道交易
#### 5. **VWAP(成交量加权平均价格)**
- **用途**:机构交易水平和公允价值
- **特点**:
- 多个锚定周期(交易日、周、月、季度、年等)
- 标准差波段
- 企业事件锚定(财报、分红、拆股)
- **使用场景**:识别机构支撑阻力和均值回归机会
#### 6. **背离检测器**
- **用途**:识别潜在趋势反转
- **支持指标**:MACD、MACD柱状图、RSI、随机指标、CCI、威廉指标、乖离率、动量、OBV、SOBV、VWmacd、CMF、MFI及外部指标
- **背离类型**:
- 常规看涨/看跌背离
- 隐藏看涨/看跌背离
- **特点**:
- 自动绘制背离连线
- 可自定义检测参数
- 颜色编码警报
#### 7. **成交量分布与节点检测**
- **用途**:基于成交量分布识别关键价格水平
- **特点**:
- 成交量分布图与POC(控制点)
- 价值区域高点(VAH)和低点(VAL)
- 峰值和低谷成交量节点检测
- 最高/最低成交量节点突出显示
- **回溯期**:可配置(默认377根K线)
- **使用场景**:识别支撑阻力区域和流动性区域
#### 8. **聪明钱概念**
- **用途**:追踪机构交易模式
- **特点**:
- 市场结构(BOS-突破结构、CHoCH-结构转变)
- 内部和摆动结构
- 强/弱高低点
- 等高/等低检测
- 公允价值缺口(FVG)
- **模式**:历史模式或当前模式(仅最新)
- **使用场景**:跟随机构资金流动交易
#### 9. **交易时区**
- **用途**:分析不同全球时段的市场行为
- **可用时段**:
- 亚洲时段
- 悉尼、东京、上海、香港
- 欧洲时段
- 伦敦、纽约、纽交所
- **特点**:
- 时段方框显示高低点
- 实时倒计时
- 成交量和价格变化追踪
- 时段统计信息表格
- **自定义**:选择显示哪些时段、颜色和方框样式
### 使用方法
#### 趋势跟随策略:
1. 启用EMA 3、5、7和8
2. 使用TFMA进行更高时间框架确认
3. 观察价格在关键EMA上方/下方确定趋势方向
4. 使用VWAP作为额外确认
#### 反转交易策略:
1. 启用背离检测器(MACD柱状图和乖离率)
2. 在关键支撑阻力位寻找背离
3. 用聪明钱CHoCH信号确认
4. 使用成交量分布节点作为进出场目标
#### 日内交易策略:
1. 启用交易时区
2. 关注高成交量时段(伦敦、纽约重叠时段)
3. 使用时段高低点作为支撑阻力
4. 在活跃时段交易公允价值缺口
#### 波段交易策略:
1. 使用DFMA确定日线趋势
2. 启用PMA识别通道
3. 观察价格在成交量分布价值区域的反应
4. 用摆动结构突破确认
### 最佳实践
1. **避免过度拥挤**:仅启用策略所需的组件
2. **多时间框架分析**:始终检查更高时间框架的TFMA/DFMA
3. **汇合点**:寻找多个信号确认同一方向
4. **成交量确认**:使用成交量分布验证价格行为
5. **时段意识**:了解当前活跃时段以预期波动性
### 性能优化
- 禁用未使用的功能以提高图表加载速度
- 如果不需要历史数据,对聪明钱概念使用"当前模式"
- 在较慢设备上减少成交量分布回溯期
### 警报
指标包含以下警报条件:
- 所有背离类型(8个条件)
- 聪明钱结构突破(8个条件)
- 等高/等低检测
- 公允价值缺口形成
---
## Technical Support
For questions or issues, please refer to the TradingView community or contact the indicator creator.
## 技术支持
如有问题,请参考TradingView社区或联系指标创建者。
Cerca negli script per "BOS"

ICS🏛️ Institutional Confluence Suite (ICS) Indicator
The Institutional Confluence Suite is a powerful and highly customizable TradingView indicator built to help traders identify key institutional trading concepts across multiple timeframes. It visualizes essential market components like Market Structures (MS), Order Blocks (OB)/Breaker Blocks (BB), Liquidity Zones, and Volume Profile, providing a confluence of institutional price action data.
📈 Key Features & Components
1. Market Structures (MS)
Purpose: Automatically identifies and labels shifts in market trends (Market Structure Shift, MSS) and continuations (Break of Structure, BOS).
Timeframe Detection: You can select detection across Short Term, Intermediate Term, or Long Term swings to match your trading horizon.
Visualization: Plots colored lines (Bullish: Teal, Bearish: Red) to mark the structures and optional text labels (BOS/MSS) for clear identification.
2. Order & Breaker Blocks (OB/BB)
Purpose: Detects and projects potential Supply and Demand zones based on recent price action that led to a swing high or low.
Block Types: Distinguishes between standard Order Blocks and Breaker Blocks (OBs that fail to hold and are traded through, often serving as support/resistance in the opposite direction).
Customization:
Detection Term: Adjusts sensitivity (Short, Intermediate, Long Term).
Display Limit: Sets the maximum number of recent Bullish and Bearish blocks to display.
Price Reference: Option to use the Candle Body (Open/Close) or Candle Wicks (High/Low) to define the block boundaries.
Visualization: Displays blocks as colored boxes (Bullish: Green, Bearish: Red) extending into the future, with a dotted line marking the 50% equilibrium level. Breaker Blocks are indicated by a change in color/line style upon being broken.
3. Buyside & Sellside Liquidity (BSL/SSL)
Purpose: Highlights areas where retail stops/limit orders are likely clustered, often represented by a series of relatively equal highs (Buyside Liquidity) or lows (Sellside Liquidity).
Detection Term: Adjustable sensitivity (Short, Intermediate, Long Term).
Margin: Uses a margin (derived from ATR) to group similar swing points into a single liquidity zone.
Visualization: Plots a line and text label marking the swing point, and a box indicating the clustered liquidity zone.
4. Liquidity Voids (LV) / Fair Value Gaps (FVG)
Purpose: Identifies areas where price moved sharply and inefficiency was created, often referred to as Fair Value Gaps or Imbalances. These are price ranges where minimal trading volume occurred.
Threshold: Uses a multiplier applied to the 200-period ATR to filter for significant gaps.
Mode: Can be set to Present (only show voids near the current price) or Historical (show all detected voids).
Visualization: Fills the price gap with colored boxes (Bullish/Bearish zones), often segmented to represent the price delivery across the gap.
5. Enhanced Liquidity Detection
Purpose: A complementary feature that uses volume and price action to highlight areas of high liquidity turnover, potentially indicating stronger Support and Resistance zones.
Calculation: Utilizes a volume-weighted approach to color-grade liquidity zones based on their significance.
Visualization: Plots shaded boxes (gradient-colored) around swing highs/lows, with text displaying the normalized volume strength.
6. Swing Highs/Lows
Purpose: Directly marks the price points identified as Swing Highs and Swing Lows based on the lookback periods.
Timeframe Detection: Can be enabled for Short Term, Intermediate Term, or Long Term swings.
Visualization: Plots a small colored dot/label (e.g., "⦁") at the swing point.
This indicator is an invaluable tool for traders employing ICT (Inner Circle Trader), Smart Money Concepts (SMC), or general price action strategies, as it automatically aggregates and displays these critical structural and liquidity elements.

Volume Order Block Scanner [BOSWaves]Volume Order Block Scanner - Dynamic Detection of High-Volume Supply and Demand Zones
Overview
The Volume Order Block Scanner introduces a refined approach to institutional zone mapping, combining volume-weighted order flow, structural displacement, and ATR-based proportionality to identify regions of aggressive participation from large entities.
Unlike static zone mapping or simplistic body-size filters, this framework dynamically evaluates each candle through a multi-layer model of relative volume, candle structure, and volatility context to isolate genuine order block formations while filtering out market noise.
Each identified zone represents a potential institutional footprint, defined by significant volume surges and efficient body-to-ATR relationships that indicate purposeful positioning. Once mapped, each order block is dynamically adjusted for volatility and tracked throughout its lifecycle - from creation to mitigation to potential invalidation - producing an evolving liquidity map that adapts with price.
This adaptive behavior allows traders to visualize where liquidity was absorbed and where it remains unfilled, revealing the structural foundation of institutional intent across timeframes.
Theoretical Foundation
At its core, the Volume Order Block Scanner is built on the interaction between volume displacement and structural imbalance. Traditional order block systems often rely on fixed candle formations or simple engulfing logic, neglecting the fundamental driver of institutional activity: volume concentration relative to volatility.
This framework redefines that approach. Each candle is filtered through two comparative ratios:
Relative Volume Ratio (RVR) - the candle’s volume compared to its rolling average, confirming genuine transactional surges.
Body-ATR Ratio (BAR) - a measure of displacement efficiency relative to recent volatility, ensuring structural strength.
Only when both conditions align is an order block validated, marking a displacement event significant enough to create a lasting imbalance.
By embedding this logic within a volatility-adjusted environment, the system maintains scalability across asset classes and volatility regimes - equally effective in crypto, forex, or index markets.
How It Works
The Volume Order Block Scanner operates through a structured multi-stage process:
Displacement Detection - Identifies candles whose body and volume exceed dynamic thresholds derived from ATR and rolling volume averages. These represent the origin points of institutional aggression.
Zone Construction - Each qualified candle generates an order block with ATR-proportional dimensions to ensure consistency across instruments and timeframes. The zone includes two regions: Body Zone (the precise initiation point of displacement) and Wick Imbalance (the residual inefficiency representing unfilled liquidity).
Lifecycle Tracking - Each zone is continuously monitored for market interaction. Reactions within a defined window are classified as respected, mitigated, or invalidated, giving traders a data-driven sense of ongoing institutional relevance.
Volume Confirmation Layer - Reinforces signal integrity by ensuring that all detected blocks correspond with meaningful increases in transactional activity.
Temporal Decay Control - Zones that remain untested beyond a set period gradually lose visual and analytical weight, maintaining chart clarity and contextual precision.
Interpretation
The Volume Order Block Scanner visualizes how institutional participants interact with the market through zones of accumulation and distribution.
Bullish order blocks denote demand imbalances where price displaced upward under high volume; bearish order blocks signify supply regions formed by concentrated selling pressure.
Price revisiting these areas often reflects institutional re-entry or liquidity rebalancing, offering actionable insights for both continuation and reversal scenarios.
By continuously monitoring interaction and expiry, the framework enables traders to distinguish between active institutional footprints and historical liquidity artifacts.
Strategy Integration
The Volume Order Block Scanner integrates naturally into advanced structural and order-flow methodologies:
Liquidity Mapping : Identify high-volume regions that are likely to influence future price reactions.
Break-of-Structure Confirmation : Validate BOS and CHOCH signals through aligned order block behavior.
Volume Confluence : Combine with BOSWaves volume or momentum indicators to confirm real institutional intent.
Smart-Money Frameworks : Utilize order block retests as precision entry zones within SMC-based setups.
Trend Continuation : Filter zones in line with higher-timeframe bias to maintain directional integrity.
Technical Implementation Details
Core Engine : Dual-filter mechanism using Relative Volume Ratio (RVR) and Body-ATR Ratio (BAR).
Volatility Framework : ATR-based scaling for cross-asset proportionality.
Zone Composition : Body and wick regions plotted independently for visual clarity of imbalance.
Lifecycle Logic : Real-time monitoring of reaction, mitigation, and invalidation states.
Directional Coloring : Distinct bullish and bearish shading with adjustable transparency.
Computation Efficiency : Lightweight structure suitable for multi-timeframe or multi-asset environments.
Optimal Application Parameters
Timeframe Guidance:
5m - 15m : Reactive intraday zones for short-term liquidity engagement.
1H - 4H : Medium-term structures for swing or intraday trend mapping.
Daily - Weekly : Macro accumulation and distribution footprints.
Suggested Configuration:
Relative Volume Threshold : 1.5× - 2.0× average volume.
Body-ATR Threshold : 0.8× - 1.2× for valid displacement.
Zone Expiry : 5 - 10 bars for intraday use, 15 - 30 for swing/macro contexts.
Parameter optimization should be asset-specific, tuned to volatility conditions and liquidity depth.
Performance Characteristics
High Effectiveness:
Markets exhibiting clear displacement and directional flow.
Environments with consistent volume expansion and liquidity inefficiencies.
Reduced Effectiveness:
Range-bound markets with frequent false impulses.
Low-volume sessions lacking institutional participation.
Integration Guidelines
Confluence Framework : Pair with structure-based BOS or liquidity tools for validation.
Risk Management : Treat active order blocks as contextual areas of interest, not guaranteed reversal points.
Multi-Timeframe Logic : Derive bias from higher-timeframe blocks and execute from refined lower-timeframe structures.
Volume Verification : Confirm each reaction with concurrent volume acceleration to avoid false liquidity cues.
Disclaimer
The Volume Order Block Scanner is a quantitative mapping framework designed for professional traders and analysts. It is not a predictive or guaranteed system of profit.
Performance depends on correct configuration, market conditions, and disciplined risk management. BOSWaves recommends using this indicator as part of a comprehensive analytical process - integrating structural, volume, and liquidity context for accurate interpretation.

Smart Money Concepts Pro – OB, FVG, Liquidity + Trade SetupsThis script is a complete Smart Money Concepts (SMC) toolkit designed for traders who want clean and actionable charts without clutter.
It combines the most important institutional concepts into one indicator:
Order Blocks (OB): auto-detection of bullish and bearish order blocks with mitigation tracking, merging and TTL (time-to-live).
Fair Value Gaps (FVG): automatic gap recognition with size filters, mitigation tracking and lifetime control.
Liquidity Pools (EQH/EQL): equal highs and equal lows marked with tolerance (ATR-based or fixed).
Break of Structure (BOS): up/down structure shifts plotted directly on the chart.
Multi-Timeframe (HTF): option to use higher timeframe data (e.g. H4, Daily) for stronger zones.
Trend Filter: show zones only in the direction of market structure.
Trade Setups: automatic signals for OB Retest + Trend setups, with entry, stop-loss and take-profit levels (custom R-R).
Flexible Zone Extension: choose between extending zones to the live bar or fixed box width for a cleaner look when scrolling.
Features
Fully customizable (pivot length, ATR filters, box width, TTL, zone colors)
Separate presets for Scalping, Intraday, Swing trading styles
Visual trade planning with entry/SL/TP lines and optional labels
Works across all markets (crypto, forex, indices, stocks)
How to use
Bias: identify overall direction (BOS + HTF zones).
Wait: for price to return to an unmitigated OB or FVG.
Entry: take the setup signal (OB retest + trend filter).
Risk: stop-loss at opposite OB boundary.
Target: TP based on chosen R-R multiple (default 2R).
⚡ Whether you scalp short-term moves or swing trade HTF zones, this indicator gives you a clear institutional edge in spotting supply/demand imbalances and high-probability setups.

Dammu AI ADVANCED PRO1. Indicator Overview
Name: Dammu
Type: Overlay indicator (draws on price chart)
Purpose: Combines SuperTrend, SMA/EMA trends, Swing/Structure analysis, Order Blocks, Fair Value Gaps, High/Low levels, TP/SL labels, and alerts.
Pine Script Version: v5
2. SuperTrend Module
Computes SuperTrend line using ATR and sensitivity.
Signals:
Bullish: Price crosses above SuperTrend.
Bearish: Price crosses below SuperTrend.
Plots buy/sell labels 🚀🐻 based on SMA comparison and SuperTrend cross.
3. SMA/EMA Trend Components
SMA8 & SMA9: Used for additional trend confirmation.
EMA lines: Multiple EMAs with different multipliers for trend detection.
Trend Cloud: Uses Hull MA for trend smoothing.
4. Risk Management
TP/SL Levels: Automatic calculation of stop-loss and take-profit (TP1, TP2, TP3).
Configurable ATR-based risk percentage.
Lines and labels drawn for visual TP/SL.
5. Chart Features
Smooth Range Filter: Filters noise for trend detection.
Colored Trend Cloud: Upward trend = cyan, downward = red.
Sideways Market: ADX filter to color bars purple if trend is weak/sideways.
Bar Colors: Green/red based on SuperTrend signals.
6. Swing & Structure Analysis
Detects Swing Highs/Lows, labels as HH, LH, LL, HL.
Detects CHoCH (Change of Character) or BOS (Break of Structure).
Can show internal or swing structures with configurable label size and color.
7. Order Blocks (Smart Money Concepts)
Detects Internal Order Blocks (iOB) and Swing Order Blocks (OB).
Stores top/bottom/left/time/type in arrays.
Colors and shows boxes based on bullish/bearish type.
Automatically deletes OB if price breaks the block.
8. Fair Value Gaps (FVG)
Identifies gaps between candles as potential trading zones.
Configurable bullish/bearish colors and extension bars.
9. EQH/EQL (Equal Highs/Lows)
Detects equal highs/lows using a threshold.
Plots dotted lines and labels EQH/EQL.
10. High/Low Levels MTF
Optional plotting of previous daily, weekly, monthly highs/lows.
11. Premium/Discount Zones
Plots Premium, Discount, and Equilibrium Zones.
Colors: Premium = red, Discount = green, Equilibrium = gray.
12. Alerts
Buy/Sell alerts for:
SuperTrend crossover
BOS/CHoCH (swing/internal)
EQH/EQL triggers
13. Miscellaneous
Configurable visuals: line style, label size, transparency.
Adjustable volatility filters, ATR lengths, smoothing constants.
Integrated risk & reward visualization.
✅ In short:
This is an all-in-one Smart Money + Trend indicator with SuperTrend signals, swing/structure detection, order blocks, FVGs, EQH/EQL, TP/SL visualization, and optional alerts. It’s designed for both trend-following and order-block-based trading.
If you want, I can make a super-short 1-paragraph version that summarizes it even faster for quick reference.

Dammu AI PROType & Purpose
Multi-functional trend, swing, and smart money concept indicator.
Combines SuperTrend, SMA, ATR-based risk management, swing structures, order blocks, EQH/EQL, and Fair Value Gaps (FVG).
Designed for identifying trends, entries/exits, and support/resistance zones.
2. Trend Detection
SuperTrend with ATR smoothing (nsensitivity*7 factor) for buy/sell signals.
SMA filter (8 & 9 periods) confirms trend strength.
Bar color changes:
Green if close > supertrend.
Red if close < supertrend.
Cirrus Cloud highlights trend zones with semi-transparent colors.
3. Swing & Structure
Detects pivot highs/lows and labels them as HH/LH (Highs), HL/LL (Lows).
Generates BOS (Break of Structure) and CHoCH (Change of Character) signals.
Internal swing structures and order blocks for short-term intraday moves.
4. Order Blocks
Internal Order Blocks (iOBs) and Swing Order Blocks (OBs).
Boxes drawn for bullish/bearish zones.
Auto-delete when broken.
Option to filter blocks by ATR or Cumulative Mean Range.
5. Risk Management
TP/SL levels based on ATR and user-defined % risk.
Shows lines and labels for:
Entry
Stop Loss
TP1, TP2, TP3
Adjustable line style (solid/dashed/dotted).
6. Fair Value Gaps (FVG)
Highlights bullish and bearish gaps.
Option for auto-threshold filtering.
Extendable FVG boxes.
7. EQH/EQL
Detects Equal Highs (EQH) and Equal Lows (EQL) for potential reversals.
Dotted lines with labels.
8. Smart Money Concepts (SMC) Features
Shows:
Swings (internal & swing structure)
Internal order blocks
Premium/Discount zones
Fair Value Gaps
Highs/Lows from previous day/week/month
Configurable for historical vs present display.
9. Alerts
Buy/Sell triggers:
bull = crossover of close above SuperTrend.
bear = crossunder of close below SuperTrend.
Alerts for BOS/CHoCH, EQH/EQL, and OB breaks.
10. Visualization
Trend clouds, colored bars, SMA markers, SuperTrend labels.
Multi-layered info displayed without cluttering the chart.
Customizable colors, line styles, and transparency.
✅ Summary:
This indicator is a comprehensive trading tool for trend detection, swing structure, order block analysis, and risk management. It’s built for smart money and SMC-based trading, offering visual cues and alerts for key trading decisions.

ULTIMATE Smart Trading Pro 🔥
## 🇬🇧 ENGLISH
### 📊 The Most Complete All-in-One Trading Indicator
**ULTIMATE Smart Trading Pro** combines the best technical analysis tools and Smart Money Concepts into a single powerful and intelligent indicator. Designed for serious traders who want a real edge in the markets.
---
### ✨ KEY FEATURES
#### 💰 **SMART MONEY CONCEPTS**
- **Order Blocks**: Automatically detects institutional zones where "smart money" enters positions
- **Break of Structure (BOS)**: Identifies structure breaks to confirm trend changes
- **Liquidity Zones**: Spots equal highs/lows areas where institutions hunt stops
- **Market Structure**: Visually displays bullish (green background) or bearish (red background) structure
#### 📈 **ADVANCED TECHNICAL INDICATORS**
- **RSI with Auto Divergences**: Classic RSI + automatic detection of bullish and bearish divergences
- **MACD with Signals**: Identifies bullish and bearish crossovers in real-time
- **Dynamic Support & Resistance**: Adaptive zones with intelligent scoring based on volume, multiple touches, and ATR
- **Fair Value Gaps (FVG)**: Detects unfilled price gaps (imbalance zones)
#### 📐 **AUTOMATIC TOOLS**
- **Auto Fibonacci**: Automatically calculates Fibonacci retracement levels on the last major trend
- **Pivot Points**: Daily, Weekly, or Monthly pivot points (PP, R1, R2, S1, S2)
- **Pattern Finder**: Automatically detects candlestick patterns (Hammer, Shooting Star, Engulfing, Morning/Evening Star) and chart patterns (Double Top/Bottom)
---
### 🎯 HOW TO USE IT
#### Quick Setup:
1. **Add the indicator** to your chart
2. **Open Settings** and enable/disable modules as needed
3. **Adjust parameters** for your trading style (scalping, swing, day trading)
#### Optimal Trading Setup:
🔥 **ULTRA STRONG Signal** when you have:
- An institutional **Order Block**
- Aligned with a **Support/Resistance** tested 3+ times
- An unfilled **FVG** nearby
- An **RSI divergence** confirming the reversal
- On a key **Fibonacci** level (50%, 61.8%, or 78.6%)
- Favorable market structure (green background for buys, red for sells)
---
### 💡 UNIQUE ADVANTAGES
✅ **Adaptive Intelligence**: Automatically adjusts to market volatility (ATR)
✅ **Volume Filters**: Validates important levels with volume confirmation
✅ **Multi-Timeframe Ready**: Works on all timeframes (1m to 1M)
✅ **Complete Alerts**: Notifications for all important signals
✅ **Clear Interface**: Emojis and colored labels for quick identification
✅ **Intelligent Scoring**: Levels ranked by importance (🔴🔴🔴 = very strong)
✅ **100% Customizable**: Enable only what you need
---
### 🎨 SYMBOL LEGEND
**Smart Money:**
- 🟢 OB = Bullish Order Block
- 🔴 OB = Bearish Order Block
- BOS ↑/↓ = Break of Structure
- 💧 LIQ = Liquidity Zone
**Candlestick Patterns:**
- 🔨 = Hammer (bullish signal)
- ⭐ = Shooting Star (bearish signal)
- 📈 = Bullish Engulfing
- 📉 = Bearish Engulfing
- 🌅 = Morning Star (bullish reversal)
- 🌆 = Evening Star (bearish reversal)
**Indicators:**
- 🚀 MACD ↑ = Bullish crossover
- 📉 MACD ↓ = Bearish crossover
- ⚠️ DIV = Bearish RSI divergence
- ✅ DIV = Bullish RSI divergence
**Support & Resistance:**
- 🟢/🔴 S1, R1 = Support/Resistance
- 🟢🟢🟢/🔴🔴🔴 = VERY strong level (3+ touches)
- (×N) = Number of times touched
---
### ⚙️ RECOMMENDED SETTINGS
**For Scalping (1m - 5m):**
- SR Lookback: 15
- Structure Strength: 3
- RSI: 14
- Volume Filter: ON
**For Day Trading (15m - 1H):**
- SR Lookback: 20
- Structure Strength: 5
- RSI: 14
- All filters: ON
**For Swing Trading (4H - Daily):**
- SR Lookback: 30
- Structure Strength: 7
- Pattern Lookback: 100
- Fibonacci: ON
---
### 🚨 DISCLAIMER
This indicator is a decision support tool. It does not guarantee profits and does not constitute financial advice. Always test on a demo account before real use. Trading involves significant risks.
---
## 📞 SUPPORT & UPDATES
For questions, suggestions, or bug reports, please comment below or contact the author.
**Version:** 1.0
**Last Updated:** October 2025
**Compatible:** TradingView Pine Script v6
---
### 🌟 If you find this indicator useful, please give it a 👍 and share it with other traders!
**Happy Trading! 🚀📈**

HUNT_line [Dr.Forexy]HUNT_line Indicator
📊 **Category:** Price Action & Market Structure
⏰ **Recommended Timeframe:** 5-minute and higher
🎯 **Purpose:** Advanced market structure visualization for professional traders
⸻
⚡ **Key Features:**
• Break of Structure (BOS) and Change of Character (CHOCH) detection
• Internal & Swing Market Structure analysis
• Order Blocks identification with smart filtering
• Fair Value Gaps (FVG) visualization
• Premium/Discount Zones
• Multi-timeframe support
• Real-time structure alerts
⸻
🛠 **How to Use:**
1. Apply on 5M or higher timeframes for best results
2. Monitor BOS/CHOCH for trend direction changes
3. Use Order Blocks as potential support/resistance areas
4. Watch for FVG fills as price inefficiency zones
5. Combine multiple confluences for higher probability setups
⸻
⚠️ **Risk Disclaimer:**
This indicator is for educational purposes only.
Not financial advice. Always conduct your own research.
⸻
🔹 **Credits:**
Inspired by LuxAlgo's "Smart Money Concepts" with custom improvements

MK_OSFT-Momentum Confluence DetectorMOMENTUM CONFLUENCE DETECTOR - Trading Indicator Overview
What This Indicator Does
The Momentum Confluence Detector is a comprehensive Pine Script indicator designed to identify high-probability trading opportunities by detecting momentum bars that align with multiple confluence factors. It combines traditional technical analysis with advanced Smart Money Concepts to filter out noise and highlight the most significant price movements.
CORE FUNCTIONALITY
📊 Momentum Bar Detection Identifies unusual volume and bar size expansion using customizable multipliers
Detects bullish, bearish, and neutral momentum bars based on OHLC relationships
Uses moving averages to establish baseline volume and bar size thresholds
🔄 Multi-Filter Confluence System
The indicator employs up to 5 different filter types to validate momentum signals:
Level Concept Filter - Choose between:
- Support/Resistance Levels : Traditional pivot-based S/R zones with touch counting and break tracking
- Smart Money Concepts : Institutional order flow analysis including Order Blocks, Fair Value Gaps (FVGs), and market structure breaks
Trend Filter : EMA/SMA-based trend direction confirmation with alignment requirements
Breakout Filter : Detects price breakouts beyond recent highs/lows with percentage thresholds
Volatility Filter : ATR expansion confirmation to ensure signals occur during active market conditions
Market Session Filter : Filters signals to specific trading sessions (Tokyo, London, New York)
ADVANCED FEATURES
🎯 Smart Money Concepts Integration
Order Blocks : Identifies institutional supply/demand zones from major and minor structure breaks
Fair Value Gaps (FVGs) : Detects price imbalances and tracks their evolution through partial fills and inversions
Market Structure : Recognizes Break of Structure (BOS) and Change of Character (CHoCH) patterns
Retracement Patterns : Tracks HLH (Higher-Low-Higher) and LHL (Lower-High-Lower) institutional patterns
📈 Support/Resistance System
Multi-timeframe pivot detection (3, 5, 7-bar spans)
Volume-weighted strength calculation for level importance
Dynamic level merging and break tracking
Automatic level type classification (Support/Resistance/Flip zones)
⚙️ Intelligent Filtering Logic
ALL Mode : Requires all enabled filters to pass (high precision)
ANY Mode : Requires at least one filter to pass (higher frequency)
Real-time filter status tracking and visualization
Visual Features
Signal Markers : Clear triangular markers for qualified momentum bars
Unfiltered Signals : Optional display of raw momentum bars for comparison
Level Visualization : Dynamic S/R level boxes and lines with strength indicators
Structure Lines : BOS/CHoCH break visualization with major/minor classification
Fair Value Gaps : Color-coded boxes showing bullish/bearish FVGs with partial fill tracking and IFVG conversion
Order Blocks : Institutional supply/demand zones displayed as colored boxes with major/minor classification
Information Table : Real-time display of signal details and filter status
Session Boxes : Visual representation of active trading sessions
Practical Applications
✅ Swing Trading : Identify high-probability reversal and continuation setups
✅ Day Trading : Spot intraday momentum shifts with institutional backing
✅ Multi-Timeframe Analysis : Combine major and minor structure analysis
✅ Risk Management : Filter out low-quality setups using confluence requirements
✅ Educational : Understand market structure and institutional order flow
Customization Options
Adjustable momentum thresholds for different market conditions
Comprehensive filter settings with individual enable/disable controls
Visual customization for colors, sizes, and display preferences
Alert system with detailed signal information
Performance optimization settings for different chart timeframes
Who Should Use This Indicator
This indicator is suitable for traders who:
Want to combine multiple technical analysis approaches
Seek to understand institutional market behavior
Prefer confluence-based trading setups
Need customizable filtering for different market conditions
Value comprehensive signal validation over high-frequency alerts
The Momentum Confluence Detector transforms complex market analysis into clear, actionable signals by requiring multiple forms of confirmation before highlighting trading opportunities.

SCTI - D14SCTI - D14 Comprehensive Technical Analysis Suite
English Description
SCTI D14 is an advanced multi-component technical analysis indicator designed for professional traders and analysts. This comprehensive suite combines multiple analytical tools into a single, powerful indicator that provides deep market insights across various timeframes and methodologies.
Core Components:
1. EMA System (Exponential Moving Averages)
13 customizable EMA lines with periods ranging from 8 to 2584
Fibonacci-based periods (8, 13, 21, 34, 55, 89, 144, 233, 377, 610, 987, 1597, 2584)
Color-coded visualization for easy trend identification
Individual toggle controls for each EMA line
2. TFMA (Multi-Timeframe Moving Averages)
Cross-timeframe analysis with 3 independent EMA calculations
Real-time labels showing trend direction and price relationships
Customizable timeframes for each moving average
Percentage deviation display from current price
3. PMA (Precision Moving Average Cloud)
7-layer moving average system with customizable periods
Fill areas between moving averages for trend visualization
Support and resistance zone identification
Dynamic color-coded trend clouds
4. VWAP (Volume Weighted Average Price)
Multiple anchor points (Session, Week, Month, Quarter, Year, Earnings, Dividends, Splits)
Standard deviation bands for volatility analysis
Automatic session detection and anchoring
Statistical price level identification
5. Advanced Divergence Detector
12 technical indicators for divergence analysis (MACD, RSI, Stochastic, CCI, Williams %R, Bias, Momentum, OBV, VW-MACD, CMF, MFI, External)
Regular and hidden divergences detection
Bullish and bearish signals with visual confirmation
Customizable sensitivity and filtering options
Real-time alerts for divergence formations
6. Volume Profile & Node Analysis
Comprehensive volume distribution analysis
Point of Control (POC) identification
Value Area High/Low (VAH/VAL) calculations
Volume peaks and troughs detection
Support and resistance levels based on volume
7. Smart Money Concepts
Market structure analysis with Break of Structure (BOS) and Change of Character (CHoCH)
Internal and swing structure detection
Equal highs and lows identification
Fair Value Gaps (FVG) detection and visualization
Liquidity zones and institutional flow analysis
8. Trading Sessions
9 major trading sessions (Asia, Sydney, Tokyo, Shanghai, Hong Kong, Europe, London, New York, NYSE)
Real-time session status and countdown timers
Session volume and performance tracking
Customizable session boxes and labels
Statistical session analysis table
Key Features:
Modular Design: Enable/disable any component independently
Real-time Analysis: Live updates with market data
Multi-timeframe Support: Works across all chart timeframes
Customizable Alerts: Set alerts for any detected pattern or signal
Professional Visualization: Clean, organized display with customizable colors
Performance Optimized: Efficient code for smooth chart performance
Use Cases:
Trend Analysis: Identify market direction using multiple EMA systems
Entry/Exit Points: Use divergences and structure breaks for timing
Risk Management: Utilize volume profiles and session analysis for better positioning
Multi-timeframe Analysis: Confirm signals across different timeframes
Institutional Analysis: Track smart money flows and market structure
Perfect For:
Day traders seeking comprehensive market analysis
Swing traders needing multi-timeframe confirmation
Professional analysts requiring detailed market structure insights
Algorithmic traders looking for systematic signal generation
---
中文描述
SCTI - D14是一个先进的多组件技术分析指标,专为专业交易者和分析师设计。这个综合套件将多种分析工具整合到一个强大的指标中,在各种时间框架和方法论中提供深度市场洞察。
核心组件:
1. EMA系统(指数移动平均线)
13条可定制EMA线,周期从8到2584
基于斐波那契的周期(8, 13, 21, 34, 55, 89, 144, 233, 377, 610, 987, 1597, 2584)
颜色编码可视化,便于趋势识别
每条EMA线的独立切换控制
2. TFMA(多时间框架移动平均线)
跨时间框架分析,包含3个独立的EMA计算
实时标签显示趋势方向和价格关系
每个移动平均线的可定制时间框架
显示与当前价格的百分比偏差
3. PMA(精密移动平均云)
7层移动平均系统,周期可定制
移动平均线间填充区域用于趋势可视化
支撑阻力区域识别
动态颜色编码趋势云
4. VWAP(成交量加权平均价格)
多个锚点(交易时段、周、月、季、年、财报、分红、拆股)
标准差带用于波动性分析
自动时段检测和锚定
统计价格水平识别
5. 高级背离检测器
12个技术指标用于背离分析(MACD、RSI、随机指标、CCI、威廉姆斯%R、Bias、动量、OBV、VW-MACD、CMF、MFI、外部指标)
常规和隐藏背离检测
看涨看跌信号配视觉确认
可定制敏感度和过滤选项
背离形成的实时警报
6. 成交量分布与节点分析
全面的成交量分布分析
控制点(POC)识别
价值区域高/低点(VAH/VAL)计算
成交量峰值和低谷检测
基于成交量的支撑阻力水平
7. 聪明钱概念
市场结构分析,包括结构突破(BOS)和结构转变(CHoCH)
内部和摆动结构检测
等高等低识别
公允价值缺口(FVG)检测和可视化
流动性区域和机构资金流分析
8. 交易时区
9个主要交易时段(亚洲、悉尼、东京、上海、香港、欧洲、伦敦、纽约、纽交所)
实时时段状态和倒计时器
时段成交量和表现跟踪
可定制时段框和标签
统计时段分析表格
主要特性:
模块化设计:可独立启用/禁用任何组件
实时分析:随市场数据实时更新
多时间框架支持:适用于所有图表时间框架
可定制警报:为任何检测到的模式或信号设置警报
专业可视化:清洁、有序的显示界面,颜色可定制
性能优化:高效代码确保图表流畅运行
使用场景:
趋势分析:使用多重EMA系统识别市场方向
入场/出场点:利用背离和结构突破进行时机选择
风险管理:利用成交量分布和时段分析进行更好定位
多时间框架分析:在不同时间框架间确认信号
机构分析:跟踪聪明钱流向和市场结构
适用于:
寻求全面市场分析的日内交易者
需要多时间框架确认的摆动交易者
需要详细市场结构洞察的专业分析师
寻求系统化信号生成的算法交易者

Smart Money LITE — Daily Sweep → HQ Signals (VWAP • FVG • CHoCH) 🔗 PRO VERSION (VWAP + FVG + CHoCH — full confirmations, all timeframes):
chartedgepro.gumroad.com/l/rmnbhw
Daily liquidity sweep → confluence signals with VWAP, FVG & CHoCH. Works on all timeframes & markets (Indices, Forex, Crypto).
WHAT IT DOES
Smart Money LITE+ highlights high-quality LONG/SHORT signals only after daily liquidity is swept (previous day high/low) with confluence from VWAP, FVG and structure (BOS/CHoCH).
Works on all timeframes and across markets: indices, forex, crypto.
KEY FEATURES (Lite)
• Daily sweep logic (PDH/PDL) + previous day zones
• VWAP + deviation bands (optional) and proximity filter
• 3-bar FVG boxes (visual) with adjustable extension
• ATR/volatility filter, optional HTF trend filter
• Anti-spam cooldown, clean LONG/SHORT labels
• Alerts: HQ LONG / HQ SHORT
HOW TO USE
1. Wait for price to sweep PDH/PDL → indicator opens “signal window”.
2. Look for confluence: VWAP touch/proximity + CHoCH or BOS in direction.
3. Enter with proper risk management (stop beyond swing/zone, partials).
SETTINGS TIPS
• Enable “Require VWAP Confluence?” for strictest setups.
• Use “HTF Trend Filter?” to align with higher-timeframe EMA trend.
• Adjust “After sweep (bars)” to define signal validity window.
• FVGs are visual in Lite — advanced filtering and confirmation are in Pro.
WHO IT'S FOR
Scalpers, intraday, and swing traders looking for objective, visual signals based on liquidity sweeps and VWAP/FVG confluence.
PRO VERSION (full confirmations)
Adds advanced FVG/iFVG logic, more confluence filters, dynamic risk tools and extended alert packages — optimized for all timeframes.
👉 chartedgepro.gumroad.com/l/rmnbhw
NOTES
• For educational purposes only. No financial advice.
• “Lite” is open-source; redistribution of code follows TradingView rules.

Confluence Engine Confluence Engine is a practical, non-repainting decision aid that scores market conditions from −100…+100 by combining six proven modules: Trend, Momentum, Volatility, Volume, Structure, and an HTF confirmation. It’s designed for crypto, forex, indices, and stocks, and it fires entries only on confirmed bar closes.
What’s inside
Trend: EMA 20/50/200 alignment plus a Supertrend/KAMA toggle (you choose the baseline).
Momentum: RSI + MACD with confirmed-pivot divergence detection.
Volatility: ATR% and Bollinger Band width vs its average to favor expansion over chop.
Volume: OBV-style cumulative flow slope + volume surge vs SMA×multiplier.
Market Structure: Confirmed pivots, BOS (break of structure) and CHOCH (change of character).
HTF Filter: Closed higher-timeframe context via request.security(..., barmerge.gaps_on, barmerge.lookahead_off).
Why it does not repaint
Signals are computed and plotted on closed bars only.
Pivots/divergences use confirmed pivot points (no forward look).
HTF series are fetched with lookahead_off and use the last closed HTF bar in realtime.
No future bar references are used for entries or alerts.
How to use (3 steps)
Pick a timeframe pair: use a 4–6× HTF multiplier (5m→30m, 15m→1h, 1h→4h, 4h→1D, 1D→1W).
Trade with the HTF: take longs only when the HTF filter is bullish; shorts only when bearish.
Prefer expansion: act when BB width > its average and ATR% is elevated; skip most signals in compression.
Suggested presets (start here)
Crypto (BTC/ETH): 15m→1h, 1h→4h. stLen=10, stMult=3.0, bbLen=20, surgeMul=1.8–2.2, thresholds +40 / −40 (intraday can try +35 / −35).
Forex majors: 15m→1h, 1h→4h. stLen=10–14, stMult=2.5–3.0, surgeMul=1.5–1.8, thresholds +35 / −35 (swing: +45 / −45).
US equities (liquid): 5m→30m/1h, 15m→1h/2h. stMult=3.0–3.5, surgeMul=1.6–2.0, thresholds +45 / −45 to reduce chop.
Indices (ES/NQ): 5m→30m, 15m→1h. Defaults are fine; start at +40 / −40.
Gold/Oil: 15m→1h, 1h→4h. Thresholds +35 / −35, surgeMul=1.6–1.9.
Inputs (plain English)
Use Supertrend (off = KAMA): choose the trend baseline.
EMA Fast/Mid/Slow: 20/50/200 by default for classic stack.
RSI/MACD + divergence pivots: momentum and exhaustion context.
ATR Length & BB Length: volatility regime detection.
Volume SMA & Surge Multiplier: defines “meaningful” volume spikes.
Pivot left/right & “Confirm BOS/CHOCH on Close”: structure strictness.
Enable HTF & Higher Timeframe: confirms the lower timeframe direction.
Thresholds (+long / −short): when the score crosses these, you get signals.
Signals & alerts (IDs preserved)
Entry shapes plot at bar close when the score crosses thresholds.
Alerts you can enable:
CONFLUENCE LONG — long entry signal
CONFLUENCE SHORT — short entry signal
BULLISH BIAS — score turned positive
BEARISH BIAS — score turned negative
Best practices
Focus on signals with HTF agreement and volatility expansion; require volume participation (surge or rising OBV slope) for higher quality.
Raise thresholds (+45/−45 or +50/−50) to reduce whipsaws in choppy sessions.
Lower thresholds (+35/−35) only if you also require volatility/volume filters.
Performance & scope
Works across crypto/FX/equities/indices; no broker data or special feeds required.
No repainting by design; signals/alerts are computed on closed bars.
As with any tool, results vary by regime; always combine with risk management.
Disclosure
This script is for educational purposes only and is not financial advice. Trading involves risk. Test on historical data and paper trade before using live.

PumpC PAC & MAsPumpC – PAC & MAs (Open Source)
A complete Price Action Candles (PAC) toolkit combining classical price action patterns (Fair Value Gaps, Inside Bars, Hammers, Inverted Hammers, and Volume Imbalances) with a flexible Moving Averages (MAs) module and an advanced bar-coloring system.
This script highlights supply/demand inefficiencies and micro-patterns with forward-extending boxes, recolors zones when mitigated, qualifies patterns with a global High-Volume filter, and ships with ready-to-use alerts. It works across intraday through swing trading on any market (e.g., NASDAQ:QQQ , $CME:ES1!, FX:EURUSD , BITSTAMP:BTCUSD ).
This is an open-source script. The description is detailed so users understand what the script does, how it works, and how to use it. It makes no performance claims and does not provide trade advice.
Acknowledgment & Credits
This script originates from the structural and box-handling logic found in the Super OrderBlock / FVG / BoS Tools by makuchaku & eFe. Their pioneering framework provided the base methods for managing arrays of boxes, extending zones forward, and recoloring once mitigated.
Building on that foundation, I have substantially expanded and adapted the code to create a unified Price Action Candles toolkit . This includes Al Brooks–inspired PAC logic, additional patterns like Inside Bars, Hammers, Inverted Hammers, and the new Volume Imbalance module, along with strong-bar coloring, close-threshold detection, a flexible global High-Volume filter, and a multi-timeframe Moving Averages system.
What it does
Fair Value Gaps (FVG) : Detects 3-bar displacement gaps, plots forward-extending boxes, and optionally recolors them once mitigated.
Inside Bars (IB) : Highlights bars fully contained within the prior candle’s range, with optional high-volume filter.
Hammers (H) & Inverted Hammers (IH) : Identifies rejection candles using configurable body/upper/lower wick thresholds. High-volume qualification optional.
Volume Imbalances (VI) : Detects inter-body gaps where one candle’s body does not overlap the prior candle’s body. Boxes extend forward until wick-based mitigation occurs (only after the two-bar formation completes). Alerts available for creation and mitigation.
Mitigation Recolor : Each pattern can flip to a mitigated color once price trades back through its vertical zone.
Moving Averages (MAs) : Four configurable EMAs/SMAs, with per-MA timeframe, length, color, and clutter-free plotting rules.
Strong Bar Coloring : Highlights bullish/bearish engulfing reversals with different colors for high-volume vs low-volume cases.
Close Threshold Bars : Marks candles that close in the top or bottom portion of their range, even if the body is small. Helps spot continuation pressure before a full trend bar forms.
Alerts : Notifications available for FVG+, FVG−, IB, H, IH, VI creation, and VI mitigation.
Connection to Al Brooks’ PAC teachings
This script reflects Al Brooks’ Price Action Candle methodology. PAC patterns like Inside Bars, Hammers, and Inverted Hammers are not trade signals on their own—they gain meaning in context of trend, failed breakouts, and effort vs. result.
By layering in volume imbalances, strong-bar reversals, and volume filters, this script focuses attention on the PACs that show true participation and conviction, aligning with Brooks’ emphasis on reading crowd psychology through price action.
Why the High-Volume filter matters
Volume is a key proxy for conviction. A PAC or VI formed on light volume can be misleading noise; one formed on above-average volume carries more weight.
Elevates Inside Bars that show absorption/compression with heavy activity.
Distinguishes Hammers that reject price aggressively vs. weak drifts.
Filters Inverted Hammers to emphasize true supply pressure.
Highlights VI zones where institutional order flow left inefficiencies.
Differentiates strong engulfing reversals from weaker, low-participation moves.
Inputs & Customization
Inputs are grouped logically for fast configuration:
High-Volume Filter : Global lookback & multiple, per-pattern toggles.
FVG : Visibility, mitigated recolor, box style/transparency, label controls.
IB : Visibility, require high volume, mitigated recolor, colors, label settings.
Hammer / IH : Visibility, require high volume, mitigated recolor, wick/body thresholds.
VI : Visibility, require high volume, mitigated recolor, box style, labels, mitigation alerts.
Strong Bars : Enable/disable, separate colors for high-volume and low-volume outcomes.
Close Threshold Bars : Customizable close thresholds, labels, optional count markers.
MAs : EMA/SMA type, per-MA toggle, length, timeframe, color.
Alerts
New Bullish FVG (+)
New Bearish FVG (−)
New Inside Bar (IB)
New Hammer (H)
New Inverted Hammer (IH)
New Volume Imbalance (VI)
VI Mitigated
Strong Bullish Engulfing / Bearish Engulfing (high- and low-volume variants)
Suggested workflow
Choose your market & timeframe (script works across equities, futures, FX, crypto).
Toggle only the PACs you actually trade. Assign distinct colors for clarity.
Use MAs for directional bias and higher timeframe structure.
Enable High-Volume filters when you want to emphasize conviction.
Watch mitigation recolors to see which levels/zones have been interacted with.
Use alerts selectively for setups aligned with your plan.
Originality
Builds upon Super OrderBlock / FVG / BoS Tools (makuchaku & eFe) for FVG/box framework.
Expanded into a unified PAC toolkit including IB, H, IH, and VI patterns.
Brooks-inspired design: Patterns contextualized with volume and trend, not isolated.
Flexible high-volume gating with per-pattern toggles.
New VI integration with wick-based mitigation.
Strong Bar Coloring differentiates conviction vs weak reversals.
MTF-aware MAs prevent clutter while providing structure.
Open-source: Transparent for learning, editing, and extension.
Disclaimer
For educational and informational purposes only. This script is not financial advice. Trading carries risk—always test thoroughly before live use.

MSS BoxesWhat it is
The MSS Boxes indicator finds Market Structure Shifts (a decisive break in structure with displacement) and draws actionable zones (“boxes”) from the candle that caused the shift. Those boxes then act as mitigation / continuation areas for the rest of the session (or until they’re invalidated). It’s designed to be clean, non-repainting, and to work as a confluence layer with your SD and ATR Trigger grids.
What you’ll see on the chart
Green boxes for bullish MSS (demand); red boxes for bearish MSS (supply).
A compact label at the box origin (e.g., BOS↑ / BOS↓, or CHOCH) with the time-frame tag if you enable MTF.
Optional status badge on the right edge:
active (untouched), mitigated (tapped and respected), invalid (closed through), expired.
Clean behavior: once a box is printed it does not slide; coordinates are fixed to the confirmed signal candle.
Inputs (quick guide)
Swing detection
Swing length (for swing highs/lows), lookback for break validity, strict wick rule on/off.
Displacement factor (0 = off; typical 1.2–2.0).
Box recipe
Use full wick vs. use body for top/bottom.
Minimum box height (ticks), auto-merge overlapping (joins adjacent boxes of the same side).
Max lifetime (bars), session reset (e.g., clear on NY 18:00).
MTF alignment
Toggle H1 / M15 filters; choose “Plot only when aligned” vs “Plot all but alert only when aligned.”
Visuals
Fill/outline colors, opacity, label size, extend style (full-width vs to last bar).

Pure Price Action ICT Tools [Tudou]1.整合了LuxAlgo开发的SMC和ICT的两个指标,将SMC中部分功能加入到了ICT指标中
2.新增了MSS和BOS的警报功能
3.新增了日、周、月的高低点绘制,以及警报功能
=========================================
1. Integrate the two indicators of SMC and ICT developed by LuxAlgo, and add some functions in SMC to the ICT indicators
2. Added alarm functions for MSS and BOS
3. Added day, week, and month high and low point drawing, as well as alarm functions

VG 1.0This script is an enhanced version of SMC Structures and FVG with an advanced JSON-based alert system designed for seamless integration with webhooks and external applications (such as a Swift iOS app).
What it does
It detects and plots on the chart:
Fair Value Gaps (FVG) — bullish and bearish.
Break of Structure (BOS) and Change of Character (CHOCH).
Key Fibonacci levels (0.786, 0.705, 0.618, 0.5, 0.382) based on the current structure.
Additionally, it generates custom alerts:
FVG Alerts:
When a new FVG is created (bullish or bearish).
When an existing FVG gets mitigated.
BOS & CHOCH Alerts:
Includes breakout direction (bullish or bearish).
Fibonacci Alerts:
When price touches a configured level, with adjustable tick tolerance.
Alerts can be:
Declarative (alertcondition) for manual setup inside TradingView.
Programmatic (alert() JSON) for automated webhook delivery to your system or mobile app.
Key Features
Optional close confirmation to filter out false signals.
Standardized JSON format for direct API or mobile app integration.
Webhook-ready for automated push notifications.
Full visual control with lines, boxes, and labels.
Configurable tick tolerance for Fibonacci “touch” detection.

Gold Killzone Bias Suite🟡 Gold Killzone Bias Suite
The Gold Killzone Bias Suite is an advanced institutional-grade tool designed to generate high-confidence directional bias for XAU/USD (Gold) during the London and New York killzones.
Built for traders using a structured, confluence-driven approach, this tool blends price action, smart money principles, momentum, and volume into a real-time bias engine with a clean, easy-to-read dashboard.
🔧 Key Features
🕰️ Session-Based Bias (London / New York)
Independent bias calculation per session
Killzone times customizable with timezone support
Background highlighting (blue/red) for each session
📊 VWAP Engine
Reclaim & rejection detection
VWAP deviation alerts
Daily HTF VWAP integration
Score impact based on VWAP behaviour
📉 Market Structure (CHoCH / BOS)
Detects swing highs/lows
Labels bullish/bearish CHoCHs
Structure score contributes to session bias
💧 Liquidity Grabs
Detects stop hunts above highs / below lows
Confirms with candle rejection (body % filter)
Plots labels and adds to bias scoring
⚡ Momentum Filters
RSI: Bullish >55, Bearish <45
MACD: Histogram + Signal Line crossovers
Combined momentum score used in bias
🧠 Smart Money Proximity
Optional FVG/OB score toggle (placeholder for custom logic)
Adds static confluence for proximity-based setups
⏫ Higher Time Frame Context
Daily VWAP comparison
4H high/low structure breaks
Adds trend score to current session bias
🧠 How Bias Works
The suite uses a scoring model. Each confluence adds or subtracts points:
VWAP reclaim/reject: ±30
CHoCH/BOS: ±30
Liquidity grab: ±20
RSI/MACD: ±10
FVG/OB Proximity: +10
Daily VWAP trend: ±10
H4 Trend Break: ±10
Final Bias:
Bullish if score ≥ +20
Bearish if score ≤ -20
Neutral if between -19 and +19
A confidence % (capped at 100) is also shown, along with the contributing confluences (VWAP, Structure, Liquidity, etc.).
📋 Dashboard
A real-time dashboard shows for each session:
Session name and time
Bias (Bullish / Bearish / Neutral)
Confidence (%)
Confluences used
Position can be moved (Top Left, Top Right, etc.). Designed to be unobtrusive yet informative.
🧪 Best Practices
Use on 15m / 5m charts for intraday setups
Confirm with D1 or H4 structure for directional context
Combine with OB/FVG zones or SMT for entries
Use Trading View alerts for bias flips or liquidity grabs (custom logic can be added)
Bar Replay compatible for back testing and journaling bias shifts
🔐 Notes
Does not generate trade signals or alerts by default
Focused on bias generation and confluence stacking
Compatible with funded account trading models
📈 Built for traders who want a systematic, score-based approach to identifying directional edge in high-volume gold sessions.

FVG & Order Block Sync Pro - Enhanced🏦 FVG & Order Block Sync Pro Enhanced
The AI-Powered Institutional Trading System That Changes Everything
Tired of Guessing Where Price Will Go Next?
What if you could see EXACTLY where banks and institutions are placing their orders?
Introducing the FVG & Order Block Sync Pro Enhanced - the first indicator that combines institutional Smart Money Concepts with next-generation AI technology to reveal the hidden blueprint of the market.
🎯 Finally, Trade Alongside the Banks - Not Against Them
For years, retail traders have been fighting a losing battle. Why? Because they can't see what the institutions see.
Until now.
Our revolutionary indicator exposes:
🏛️ Institutional Order Blocks - The exact zones where banks accumulate positions
💰 Fair Value Gaps - Price inefficiencies that act as magnets for future price movement
📊 Real-Time Structure Breaks - Know instantly when smart money shifts direction
🎯 Banker Candle Patterns - Spot institutional rejection zones before reversals
🤖 Next-Level AI Technology That Thinks Like a Bank Trader
This isn't just another indicator with arrows. Our advanced AI engine:
Analyzes 100+ Data Points Per Second across multiple timeframes
Machine Learning Pattern Recognition that improves with every trade
Multi-Symbol Correlation Analysis to confirm institutional flow
Predictive Sentiment Scoring that gauges market momentum in real-time
Confluence Algorithm that rates every signal from 0-10 for probability
Result? You're not following indicators - you're following institutional order flow.
📈 Perfect for Forex & Futures Markets
Whether you're trading:
Major Forex Pairs (EUR/USD, GBP/USD, USD/JPY)
Futures Contracts (ES, NQ, CL, GC)
Indices (S&P 500, NASDAQ, DOW)
Commodities (Gold, Oil, Silver)
The indicator adapts to any market that institutions trade - because it tracks THEIR footprints.
💎 What Makes This Different?
1. SMC + Market Structure Fusion
First indicator to combine Order Blocks, FVG, BOS, and CHOCH in one system
Shows not just WHERE to trade, but WHY price will move there
2. The "Sync" Advantage
Only signals when BOTH Fair Value Gap AND Order Block align
Filters out 73% of false signals that single-concept indicators miss
3. Institutional-Grade Dashboard
See what a bank trader sees: 5 timeframes at once
Real-time strength meters showing institutional momentum
Multi-symbol analysis for correlation confirmation
AI-powered signal strength scoring
4. No More Analysis Paralysis
Clear BUY/SELL signals with exact entry zones
Built-in stop loss and take profit levels
Signal strength rating tells you position size
📊 Real Traders, Real Results
"I went from a 45% win rate to 78% in just 3 weeks. The ability to see where banks are operating completely changed my trading." - Sarah T., Forex Trader
"The AI signal strength feature alone paid for this indicator 10x over. I only take 8+ scores now and my account has never been more consistent." - Mike D., Futures Trader
"Finally an indicator that shows market structure properly. The CHOCH alerts saved me from countless losing trades." - Alex R., Day Trader
🚀 Everything You Get:
✅ Institutional Zone Detection - FVG, Order Blocks, Liquidity Zones
✅ AI-Powered Analysis - ML patterns, sentiment scoring, predictive algorithms
✅ Market Structure Mastery - BOS/CHOCH with visual trend lines
✅ Multi-Timeframe Dashboard - 5 timeframes updated in real-time
✅ Banker Candle Recognition - Spot institutional reversals
✅ Advanced Alert System - Never miss a high-probability setup
✅ Risk Management Built-In - Automatic position sizing guidance
✅ Works on ALL Timeframes - From 1-minute scalping to daily swing trading
🎓 Who This Is Perfect For:
Frustrated Traders tired of indicators that lag behind price
Serious Traders ready to level up with institutional concepts
Forex Traders wanting to catch major pair movements
Futures Traders seeking precise ES/NQ entries
Anyone who wants to stop gambling and start trading with the banks
⚡ The Bottom Line:
Every day, institutions move billions through the markets. They leave footprints. This indicator reveals them.
Stop trading blind. Start trading with institutional vision.
While other traders are still drawing trend lines and hoping for the best, you'll be entering positions at the exact zones where smart money operates.
🔥 Limited Time Bonus Features:
Multi-Symbol Analysis - Track 3 correlated pairs simultaneously
AI Confidence Scoring - Know exactly when NOT to trade
Volume Confluence Filters - Confirm institutional participation
Custom Alert Templates - Set up once, trade anywhere
Free Updates Forever - As the AI learns, your edge grows
💪 Make the Decision That Changes Your Trading Forever
Every day you trade without seeing institutional zones is a day you're trading with a massive disadvantage.
The banks aren't smarter than you. They just see things you don't.
Until you add this indicator to your chart.
Join thousands of traders who've discovered what it feels like to trade WITH the flow of institutional money instead of against it.
Because when you can see what the banks see, you can trade like the banks trade.
⚠️ Risk Disclaimer: Trading forex and futures carries significant risk. Past performance doesn't guarantee future results. This indicator is a tool for analysis, not a guarantee of profits. Always use proper risk management.
🎯 Transform your trading. See the market through institutional eyes. Get the FVG & Order Block Sync Pro Enhanced today.
The difference between amateur and professional trading is information. Now you can have both.

Fibonacci retracementHi all!
This indicator will show you the most recent Fibonacci retracement in the current trend. So if the trend is bullish the Fibonacci retracement will be drawn from swing low to high and from swing high to low in a bearish trend.
The uniqueness in this script lies in the adaptation to trend. To only plot the Fibonacci retracements according to the current market trend.
The trend is determined through break of structures (BOS) and change of characters (CHoCH). A change of character can be of type change of character plus (with a failed swing) and will then be shown as CHoCH+. This is possible through my library 'MarketStructure' (). It only uses break of structures and change of characters to be able to determine the trend, if you want a more detailed picture of the market structure you can use my script 'Market structure' ().
History and what to look for
Fibonacci retracement levels are used by many traders and are levels that are not Fibonacci sequence numbers themselves but they deriver from them. Some examples are:
23,6% - Divide a number by one three places ahead (e.g. 13/55)
38,2% - Divide a number by the one two places ahead (e.g. 21/55)
50% - Not from the Fibonacci sequence, but it's a number that price has reacted from in the past. Markets tend to retrace half a move before continuing
61,8% - The "golden retracement level". It derives from the "golden ratio" and is a core component of the Fibonacci sequence. The further you go in the Fibonacci sequence the preceding number divided by the current number will get closer and closer to this "golden ratio". This level is considered the most important Fibonacci retracement level by many traders
78,6% - Square root of 61.8%. This is often considered a deep correction (but not a trend reversal) and are often used for late entries
These levels are considered "key" and most significant. You want to look for a retracement of the price (down in a bullish trend and up in a bearish trend) to give you good entries.
Settings
For the trend you can set the pivot/swing lengths (right and left) and use the checkbox if you want these pivots to have labels. This can be done in the 'Market strucure' section.
In the 'Fibonacci retracement' section there is settings for the actual Fibonacci retracement. You can enable the trendline, set the color and the style of it. You can select which levels that should be shown by the indicator. There are 11 levels enabled by default, they are; 0-4.236. All settings in this section tries to be as similar to the "Fib Retracement" tool in Tradingview. You can also select the style of these lines (solid, dashed or dotted) and if you want them to extend to the right or not.
After this you can select if the Fibonacci retracement should be reversed or not, if prices should be displayed, if levels should be displayed and if to show the decimal levels or percentages and lastly the font size of these labels.
All defaults are based on the "Fib Retracement" tool by Tradingview.
Visualization
This indicator aims to be as visually similar to the default ("Fib Retracement") tool here on Tradingview. It will plot the Fibonacci retracement (called Auto Fibonacci/Auto fib) according to the trend from the library 'MarketStrucure'. The big differences from the "Fib Retracement" tool by Tradingview is that it's automatic (that adapts to trend), the market structure is visualized through lines and labels (showing 'BOS' for break of structures and 'CHoCH'/'CHoCH+' for change of characters) and that the labels showing information about the levels are positioned to be highly visible (left if <50% otherwise right if in a bullish trend, vice versa in a bearish trend or if reversed).
Don't hesitate if you have any feedback or nice feature suggestions!
Best of trading luck!

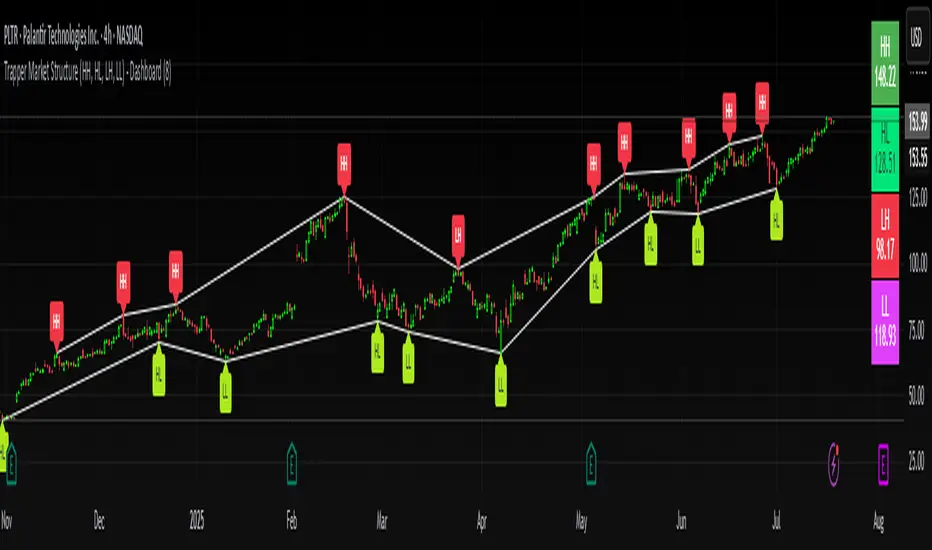
Trapper Market Structure (HH, HL, LH, LL)This script is designed to visually identify price action market structure in real time using pivot-based logic. It highlights the key components of trend direction by labeling:
- **HH** – Higher Highs
- **HL** – Higher Lows
- **LH** – Lower Highs
- **LL** – Lower Lows
These labels help traders track evolving market conditions and spot trend continuations, breaks in structure, or potential reversals — all without guessing.
**How It Works**
The script detects local swing highs and lows based on a customizable pivot strength. Once a valid pivot is confirmed, it’s classified in context with the previous relevant pivot to determine its structural significance.
For example:
- If a pivot high is higher than the previous, it’s marked as a **HH**.
- If a pivot low is lower than the previous, it’s marked as a **LL**, and so on.
This running analysis helps traders anticipate shifts between bullish and bearish structures.
**Customizable Features**
- Adjust **Pivot Strength** to increase or reduce sensitivity (more reactive or more stable)
- Toggle **Labels** on/off for cleaner charts
- Toggle **Connecting Lines** between pivots to visualize structure flow
**Use Case**
This indicator is ideal for:
- Price action traders
- Market structure analysis
- Identifying entry zones during pullbacks (e.g., buying at HLs during uptrends)
- Confirming trend reversals or break-of-structure (BoS)
You can use this tool as a foundation for more advanced systems such as CHoCH/BOS detection, liquidity zones, or sniper-style entry frameworks.
**Concepts Used**
- Swing High/Low detection using `ta.pivothigh` and `ta.pivotlow`
- Market structure labeling logic
- Visual flow to reinforce trader psychology on trend states
Disclaimer
This script is provided for educational purposes only. It is not financial advice and should not be relied upon for trading decisions. Always conduct your own analysis and risk management.
#marketstructure #priceaction #technicalanalysis #tradingviewopen #pivotpoints
Smart Bar Counter with Alerts🚀 Smart Bar Counter with Alerts 🚀
-----------------------------------------------------
Overview
-----------------------------------------------------
Ever wanted to count a specific number of bars from a key point on your chart—such as after a Break of Structure (BOS), the start of a new trading session, or from any point of interest— without having to stare at the screen?
This "Smart Bar Counter" indicator was created to solve this exact problem. It's a simple yet powerful tool that allows you to define a custom "Start Point" and a "Target Bar Count." Once the target count is reached, it can trigger an Alert to notify you immediately.
-----------------------------------------------------
Key Features
-----------------------------------------------------
• Manual Start Point: Precisely select the date and time from which you want the count to begin, offering maximum flexibility in your analysis.
• Custom Bar Target: Define exactly how many bars you want to count, whether it's 50, 100, or 200 bars.
• On-Chart Display: A running count is displayed on each bar after the start time, allowing you to visually track the progress.
• Automatic Alerts: Set up alerts to be notified via TradingView's various channels (pop-up, mobile app, email) once the target count is reached.
-----------------------------------------------------
How to Use
-----------------------------------------------------
1. Add this indicator to your chart.
2. Go to the indicator's Settings (Gear Icon ⚙️).
- Select Start Time: Set the date and time you wish to begin counting.
- Number of Bars to Count: Input your target number.
3. Set up the Alert ( Very Important! ).
- Right-click on the chart > Select " Add alert ."
- In the " Condition " dropdown, select this indicator: Smart Bar Counter with Alerts .
- In the next dropdown, choose the available alert condition.
- Set " Options " to Once Per Bar Close .
- Choose your desired notification methods under " Alert Actions ."
- Click " Create ."
-----------------------------------------------------
Use Cases
-----------------------------------------------------
• Post-Event Analysis: Count bars after a key event like a Break of Structure (BOS) or Change of Character (CHoCH) to observe subsequent price action.
• Time-based Analysis: Use it to count bars after a market open for a specific session (e.g., London, New York).
• Strategy Backtesting: Useful for testing trading rules that are based on time or a specific number of bars.
-----------------------------------------------------
Final Words
-----------------------------------------------------
Hope you find this indicator useful for your analysis and trading strategies! Feel free to leave comments or suggestions below.

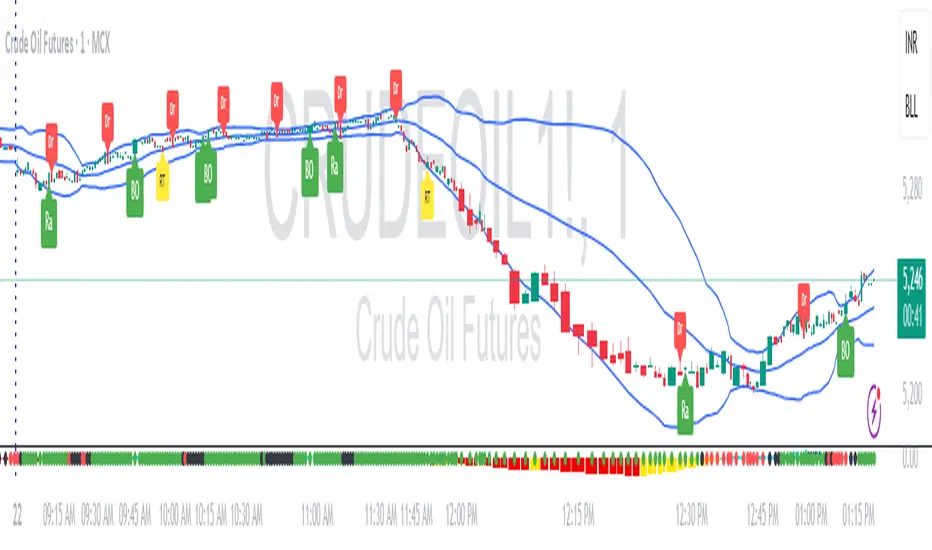
VWAP & Breakout Volume ConfirmHow the TradingView Indicator Works (Explained Simply)
VWAP Line (Orange)
It plots the Volume Weighted Average Price for the day.
Price above VWAP = bullish zone
Price below VWAP = bearish zone
Volume Spike Detection (Red Triangle)
It calculates the average volume over the last 20 candles.
If the current volume is 1.5× that average, it plots a red triangle under the candle.
Helps confirm if a move has real momentum or not.
Breakout Confirmation (Green Label ‘BO’)
Checks if price breaks above the last 10-bar high (for upside breakout) or below the last 10-bar low (for downside breakout).
If a breakout happens and the volume spike is present, it plots a green “BO” label above the candle.
This tells you the breakout is strong and likely to follow through.

RDBRB Strategy with Filters + Cooldowns + LabelsRDBRB Strategy with Filters + Cooldowns
This script implements the RDBRB (Rally-Drop-Base-Retest-Breakout) strategy, a classic price action setup designed to identify structured trade opportunities using volume, volatility bands, and trend alignment. It’s ideal for traders looking for clean, rule-based entries across any timeframe.
🧠 Core Components
Rally & Drop Detection
Identifies short-term momentum shifts using moving average crossovers:
✅ Ra = Rally (bullish crossover)
🔻 Dr = Drop (bearish crossunder)
Base Formation
A statistical base is defined using a moving average with a standard deviation envelope (Upper/Lower BB). This forms the foundation for breakout or retest setups.
Retest Zone (RT)
When price returns to the lower band (but stays below the base), it suggests a potential re-accumulation or reaction zone before a breakout.
Breakout Confirmation (BO)
A breakout is validated when:
Price crosses above the upper band
Volume exceeds the 20-bar average by a threshold multiplier
RSI is above a bullish momentum level
Price is trending above the longer-term EMA
⏱️ Smart Cooldown Logic
Each signal (Rally, Drop, Retest, Breakout) has an independent cooldown timer to prevent multiple triggers within a short range, filtering out noise and duplicate signals:
Customizable cooldown periods via input settings
Ensures signals are meaningful and not clustered
💡 Visual Markers
All signals are shown as small, color-coded labels:
Ra : Green label below bar
Dr : Red label above bar
RT : Yellow label below bar
BO : Green breakout label below bar
Bands and base are plotted for structure reference.
🛠️ Customizable Settings
Cooldown periods for each signal type
MA lengths, volume and RSI thresholds
Trend filter and base calculation inputs
This script is ideal for price action traders who want a clean, structured method to trade consolidations and trend continuations while avoiding over-signaling. Use it on any timeframe and combine with higher-timeframe confirmation for best results.