Relative Aggregate Strength OscillatorCredits to
@wolneyyy - "Mean Deviation Detector - Throw Out All Other Indicators"
And
@algomojo - "Responsive Coppock Curve"
And the default Relative Strength Index
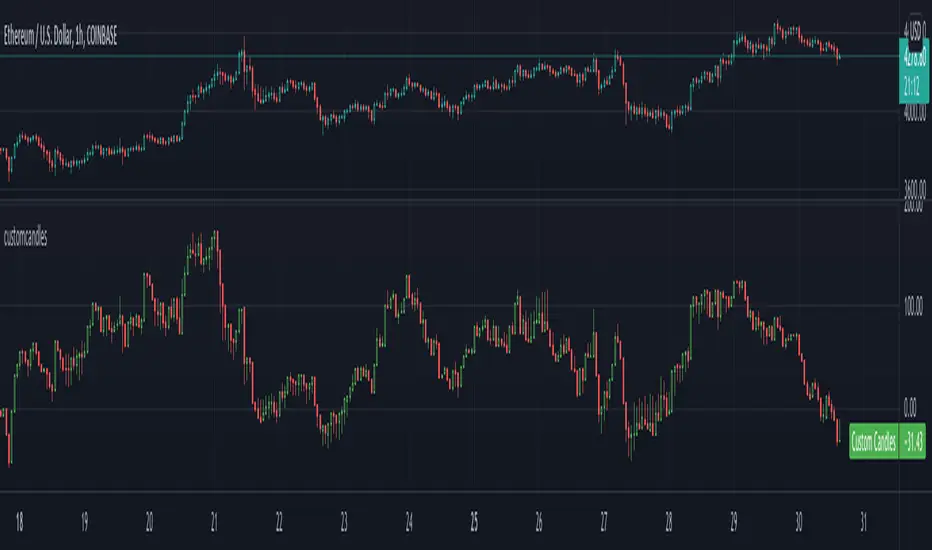
The candles are the average of the MFI ,CCI ,MOM and RSI values presented as candles, they seemed similar enough in style to me so I created candles out of each and the took the sum of all the candle's OHLC values and divided by 4 to get an average.
In the Background we have @wolneyyy's - "Mean Deviation Detector - Throw Out All Other Indicators" in blue
along with @algomojo's - "Responsive Coppock Curve" in red and green.
Cerca negli script per "CCI"

Ehlers Adaptive Relative Strength Index (RSI) [Loxx]Ehlers Adaptive Relative Strength Index (RSI) is an implementation of RSI using Ehlers Autocorrelation Periodogram Algorithm to derive the length input for RSI. Other implementations of Ehers Adaptive RSI rely on the inferior Hilbert Transformer derive the dominant cycle.
In his book "Cycle Analytics for Traders Advanced Technical Trading Concepts", John F. Ehlers describes an implementation for Adaptive Relative Strength Index in order to solve for varying length inputs into the classic RSI equation.
What is an adaptive cycle, and what is the Autocorrelation Periodogram Algorithm?
From his Ehlers' book mentioned above, page 135:
"Adaptive filters can have several different meanings. For example, Perry Kaufman’s adaptive moving average (KAMA) and Tushar Chande’s variable index dynamic average (VIDYA) adapt to changes in volatility. By definition, these filters are reactive to price changes, and therefore they close the barn door after the horse is gone.The adaptive filters discussed in this chapter are the familiar Stochastic, relative strength index (RSI), commodity channel index (CCI), and band-pass filter.The key parameter in each case is the look-back period used to calculate the indicator.This look-back period is commonly a fixed value. However, since the measured cycle period is changing, as we have seen in previous chapters, it makes sense to adapt these indicators to the measured cycle period. When tradable market cycles are observed, they tend to persist for a short while.Therefore, by tuning the indicators to the measure cycle period they are optimized for current conditions and can even have predictive characteristics.
The dominant cycle period is measured using the autocorrelation periodogram algorithm. That dominant cycle dynamically sets the look-back period for the indicators. I employ my own streamlined computation for the indicators that provide smoother and easier to interpret outputs than traditional methods. Further, the indicator codes have been modified to remove the effects of spectral dilation.This basically creates a whole new set of indicators for your trading arsenal."
What is Adaptive RSI?
From his Ehlers' book mentioned above, page 137:
"The adaptive RSI starts with the computation of the dominant cycle using the autocorrelation periodogram approach. Since the objective is to use only those frequency components passed by the roofing filter, the variable "filt" is used as a data input rather than closing prices. Rather than independently taking the averages of the numerator and denominator, I chose to perform smoothing on the ratio using the SuperSmoother filter. The coefficients for the SuperSmoother filters have previously been computed in the dominant cycle measurement part of the code."
Happy trading!

RSI MTF Ob+OsHello Traders,
This indicator use the same concept as my previous indicator "CCI MTF Ob+Os".
It is a simple "Relative Strength Index" ( RSI ) indicator with multi-timeframe (MTF) overbought and oversold level.
It can detect overbought and oversold level up to 5 timeframes, which help traders spot potential reversal point more easily.
There are options to select 1-5 timeframes to detect overbought and oversold.
Aqua Background is "Oversold" , looking for "Long".
Orange Background is "Overbought" , looking for "Short".
Have fun :)

Bogdan Ciocoiu - MoonshotDescription
Moonshot is an indicator that encapsulates the value delivered by the TSI, MACD, Awesome Oscillator and CCI algorithms to produce signals to enable users to enter positions in ideal market conditions. Moonshot integrates the value delivered by the above four algorithms into one script.
This indicator is particularly useful when trading continuation/reversal divergence strategies.
Uniqueness
The Moonshot's uniqueness stands from integrating the above algorithms into the same visual area and leveraging preconfigured parameters suitable for 1-3 minute scalping techniques.
In addition, Moonshot allows swapping or furthermore configuring the above four algorithms in such a way to align signals by colour-coding or shape thickness to aid the users with identifying any emerging patterns quicker.
Furthermore, Moonshot's uniqueness is also reflected in the way it has standardised the outputs of each algorithm to look and feel the same (including the scale at which the shapes are shown) and, in doing so, enables users to plug them in/out as needed.
Open-source
The indicator leverages the following open-source scripts/algorithms:
www.tradingview.com
www.tradingview.com
www.tradingview.com
www.tradingview.com

[VDB]TrendScalp-FractalBox-3EMAThere are many indicators with William’s Fractal and Alligator. As many use EMA’s it may be useful to define a 3-EMA ribbon and combining Fractal Levels/Box (filling background between top and bottom fractals) for trend scalping. I searched for this kind of indicator in community – some show fractals, some just levels, some with alligator etc. but couldn't find the one needed. Hence thought of this indicator which may be of interest to other users too.
Key Points:
EMA ribbon is created using 3 EMA’s 35/70/105. Users can change these as per their preference. This is used for trend identification – 1. Bullish bias if Price > EMA1 > EMA2 > EMA3. 2. Bearish bias if Price < EMA1 < EMA2 < EMA3.
Background is marked during crossing of EMA1 and EMA2 to alert possible trend change.
5-bar fractals are used to mark the Fractal levels and background between top and bottom fractals are filled to create a Fractal Box.
Fractal levels are marked only when the fractal formation is complete. Given offset is used this is lagging.
How to Use:
Sloping EMA ribbon is used for identifying the trend.
Fractal box break-out/ break-downs are used to trigger the trade with fractal high/low for entry/SL. Waiting for price contraction towards EMA ribbon resulting in smaller boxes is key to initiate trade. Avoid bigger boxes as SL’s will be big and price may move within. To draw the vertical lines of FractalBox change fractal level0 style to step-line.
This indicator combined with the cycle high/low (overbought/oversold) indicators such as CCI/Stochastic/RSI etc. can make it a good trend scalping setup while trading in the direction of momentum in higher timeframe.
This setup could be used for any timeframes. Do your back-testing before using it in live market.
This indicator was achieved by combing some fractal ideas from “Fractal and Alligator Alerts by JustUncleL”
DISCLAIMER : This indicator has been created for educational reference only and do not constitute investment advice. This indicator should not be relied upon as a substitute for extensive independent market research before making your actual trading decisions. Market data or any other content is subject to change at any time without notice. Liability for any loss or damage, including without limitation any loss of profit, which may arise directly or indirectly from use of this indicator is accountability of user using it.

KINSKI Multi Trend OscillatorThe Multi Trend Oscillator is a tool that combines the ratings of several indicators to facilitate the search for profitable trades. I was inspired by the excellent indicator "Technical Ratings" from Team TradingView to create an alternative with a technically new approach. Therefore, it is not a modified copy of the original, but newly conceived and implemented.
The recommendations of the indicator are based on the calculated ratings from the different indicators included in it. The special thing here is that all settings for the individual indicators can be changed according to your own needs and displayed as a histogram and MA line. This provides an excellent visual control of your own settings. Alarms are also triggered.
Criteria for determining the rating
Relative Strength Index (RSI)
Buy - Crossover oversold level and indicator < oversold level and rising
Sell - Crossunder oversold level and indicator >= oversold level and falling
Neutral - neither Buy nor Sell
Relative Strength Index (RSI) Laguerre
Buy - Crossover Oversold Level and Indicator < Oversold Level and rising
Sell - Crossunder oversold level and indicator >= oversold level and falling
Neutral - neither Buy nor Sell
Noise free Relative Strength Index (RSX)
Buy - Crossover Oversold Level and Indicator < Oversold Level and rising
Sell - Crossunder oversold level and indicator >= oversold level and falling
Neutral - neither Buy nor Sell
Money Flow Index (MFI)
Buy - Crossover Oversold Level and Indicator < Oversold Level and rising
Sell - Crossunder oversold level and indicator >= oversold level and falling
Neutral - neither Buy nor Sell
Commodity Channel Index (CCI)
Buy - Crossover Oversold Level and Indicator < Oversold Level and rising
Sell - Crossunder oversold level and indicator >= oversold level and falling
Neutral - neither Buy nor Sell
Moving Average Convergence/Divergence (MACD)
Buy - values of the main line > values of the signal line and rising
Sell - values of the main line < values of the signal line and falling
Neutral - neither Buy nor Sell
Klinger
Buy - indicator >= 0 and rising
Sell - indicator < 0 and falling
Neutral - neither Buy nor Sell
Average Directional Index (ADX)
Buy - indicator > 20 and +DI line crosses over the -DI line and rising
Sell - indicator > 20 and +DI line crosses below the -DI line and falling
Neutral - neither Buy nor Sell
Awesome Oscillator
Buy - Crossover 0 and values are greater than 0, or exceed the zero line
Sell - Crossunder 0 and values are lower than 0, or fall below the zero line
Neutral - neither Buy nor Sell
Ultimate Oscillator
Buy - Crossover oversold level and indicator < oversold level and rising
Sell - Crossunder oversold level and indicator >= oversold level and falling
Neutral - neither Buy nor Sell
Williams Percent Range
Buy - Crossover Oversold Level and Indicator < Oversold Level and rising
Sell - Crossunder Oversold Level and Indicator >= Oversold Level and falling
Neutral - neither Buy nor Sell
Momentum
Buy - Crossover 0 and indicator levels rising
Sell - Crossunder 0 and indicator values falling
Neutral - neither Buy nor Sell
Total Ratings
The numerical value of the rating "Sell" is 0, "Neutral" is 0 and "Buy" is 1. The total rating is calculated as the average of the ratings of the individual indicators and are determined according to the following criteria:
MaxCount = 12 (depending on whether other oscillators are added).
CompareSellStrong = MaxCount * 0.3
CompareMid = MaxCount * 0.5
CompareBuyStrong = MaxCount * 0.7
value <= CompareSellStrong - Strong Sell
value < CompareMid and value > CompareSellStrong - Sell
value == 6 - Neutral
value > CompareMid and value < CompareBuyStrong - Buy
value >= CompareBuyStrong - Strong Buy
Understanding the results
The Multi Trend Oscillator is designed so that its values fluctuate between 0 and currently 12 (maximum number of integrated indicators). Its values are displayed as a histogram with green, red and gray bars. The bars are gray when the value of the indicator is at half of the number of indicators used, currently 12. Increasingly saturated green bars indicate increasing values above 6, and increasingly saturated red bars indicate increasingly decreasing values below 6.
The table at the end of the histogram shows details (can be activated in the settings) about the overall rating and the individual indicators. Its color is determined by the rating value: gray for neutral, green for buy or strong buy, red for sell or strong sell.
The following alarms are triggered:
Multi Trend Oscillator: Sell
Multi Trend Oscillator: Strong Sell
Multi Trend Oscillator: Buy
Multi Trend Oscillator: Strong Buy

AlphaTrendAlphaTrend is a brand new indicator which I've personally derived from Trend Magic and still developing:
In Magic Trend we had some problems, Alpha Trend tries to solve those problems such as:
1-To minimize stop losses and overcome sideways market conditions.
2-To have more accurate BUY/SELL signals during trending market conditions.
3- To have significant support and resistance levels.
4- To bring together indicators from different categories that are compatible with each other and make a meaningful combination regarding momentum, trend, volatility, volume and trailing stop loss.
according to those purposes Alpha Trend:
1- Acts like a dead indicator like its ancestor Magic Trendin sideways market conditions and doesn't give many false signals.
2- With another line with 2 bars offsetted off the original one Alpha Trend have BUY and SELL signals from their crossovers.
BUY / LONG when Alpha Trend line crosses above its 2 bars offsetted line and there would be a green filling between them
SELL / SHORT when Alpha Trend line crosses below its 2 bars offsetted line and filling would be red then.
3- Alpha Trend lines
-act as support levels when an uptrend occurs trailing 1*ATR (default coefficient) distance from bar's low values
-conversely act as resistancelevels when a downtrend occurs trailing 1*ATR (default coefficient) distance from bar's high values
and acting as trailing stop losses
the more Alpha Trend lines straighter the more supports and resistances become stronger.
4- Trend Magic has CCI in calculation
Alpha Trend has MFI as momentum, but when there's no volume data MFI has 0 values, so there's abutton to change calculation considering RSI after checking the relevant box to overcome this problem when there is no volume data in that chart.
Momentum: RSI and MFI
Trend: Magic Trend
Volatility: ATR,
Trailing STOP: ATR TRAILING STOP
Volume: MFI
Alpha trend is really a combination of different types...
default values:
coefficient: 1 which is the factor of trailing ATR value
common period: 14 which is the length of ATR MFI and RSI
Wish you all use AlphaTrend in profitable trades.
Kıvanç Özbilgiç

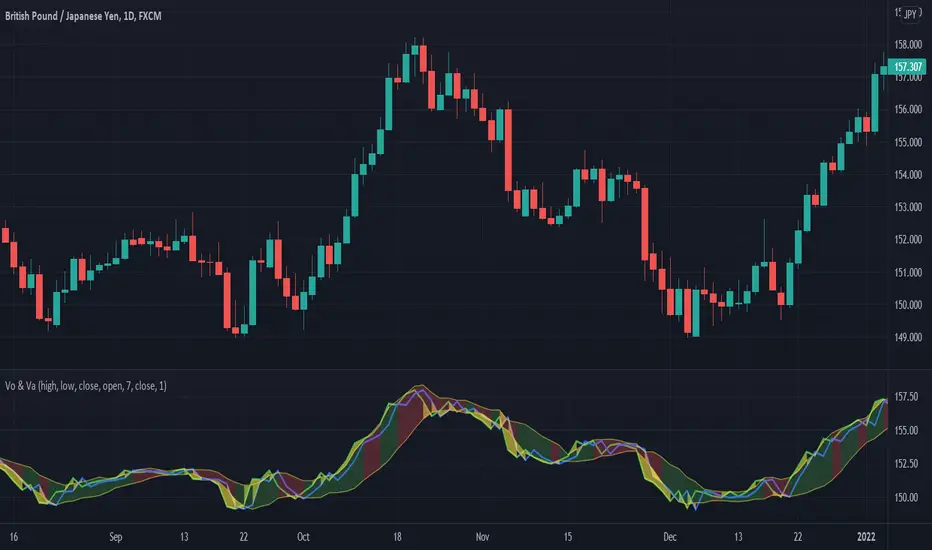
Volume + VolatilityBefore I begin I want to mention:
1. This is a variation of the 'CCI & BB' made by matsu_bitmex (Link: ) and SigmaDraconis's 'On Balance Volume Oscillator + Bollinger Bands' (Link: )
2. While using this sometimes you may not notice the crossover so I've added the Line 'x' outside 'x' BB to only see if Line 3 and 4 crossed over
The indicator:
1. When the background is green and the 2 lines are going up it means uptrend
2. When the background is red and the 2 lines are going down it means downtrend
3. When there is a crossover and the background outside BB turns yellow, it means there is a lot of volatility or volume
How to use (Or how I use this):
1. All trades based on the yellow color MUST be during a trend
2. When the color changes to yellow for the 1st time in the direction of a trend it is advisable to enter
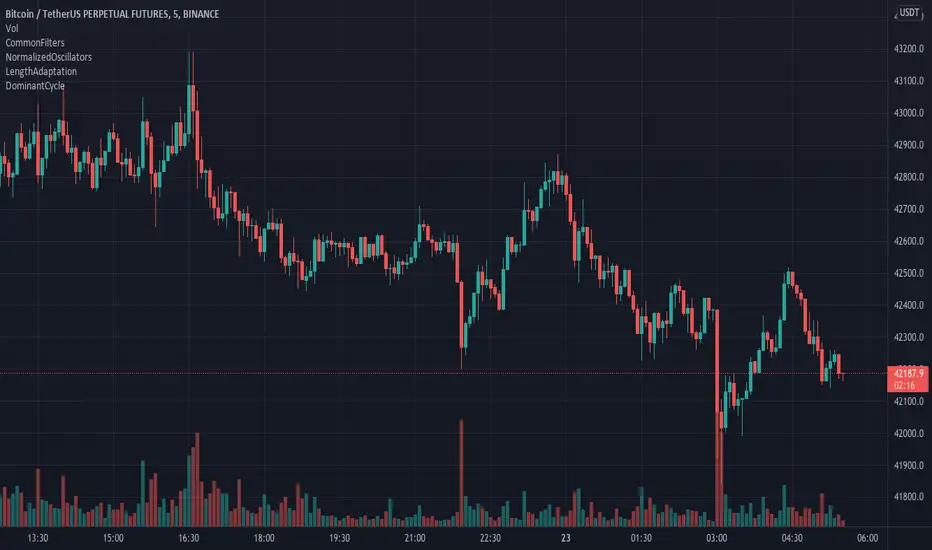
DominantCycleCollection of Dominant Cycle estimators. Length adaptation used in the Adaptive Moving Averages and the Adaptive Oscillators try to follow price movements and accelerate/decelerate accordingly (usually quite rapidly with a huge range). Cycle estimators, on the other hand, try to measure the cycle period of the current market, which does not reflect price movement or the rate of change (the rate of change may also differ depending on the cycle phase, but the cycle period itself usually changes slowly). This collection may become encyclopaedic, so if you have any working cycle estimator, drop me a line in the comments below. Suggestions are welcome. Currently included estimators are based on the work of John F. Ehlers
mamaPeriod(src, dynLow, dynHigh) MESA Adaptation - MAMA Cycle
Parameters:
src : Series to use
dynLow : Lower bound for the dynamic length
dynHigh : Upper bound for the dynamic length
Returns: Calculated period
Based on MESA Adaptive Moving Average by John F. Ehlers
Performs Hilbert Transform Homodyne Discriminator cycle measurement
Unlike MAMA Alpha function (in LengthAdaptation library), this does not compute phase rate of change
Introduced in the September 2001 issue of Stocks and Commodities
Inspired by the @everget implementation:
Inspired by the @anoojpatel implementation:
paPeriod(src, dynLow, dynHigh, preHP, preSS, preHP) Pearson Autocorrelation
Parameters:
src : Series to use
dynLow : Lower bound for the dynamic length
dynHigh : Upper bound for the dynamic length
preHP : Use High Pass prefilter (default)
preSS : Use Super Smoother prefilter (default)
preHP : Use Hann Windowing prefilter
Returns: Calculated period
Based on Pearson Autocorrelation Periodogram by John F. Ehlers
Introduced in the September 2016 issue of Stocks and Commodities
Inspired by the @blackcat1402 implementation:
Inspired by the @rumpypumpydumpy implementation:
Corrected many errors, and made small speed optimizations, so this could be the best implementation to date (still slow, though, so may revisit in future)
High Pass and Super Smoother prefilters are used in the original implementation
dftPeriod(src, dynLow, dynHigh, preHP, preSS, preHP) Discrete Fourier Transform
Parameters:
src : Series to use
dynLow : Lower bound for the dynamic length
dynHigh : Upper bound for the dynamic length
preHP : Use High Pass prefilter (default)
preSS : Use Super Smoother prefilter (default)
preHP : Use Hann Windowing prefilter
Returns: Calculated period
Based on Spectrum from Discrete Fourier Transform by John F. Ehlers
Inspired by the @blackcat1402 implementation:
High Pass, Super Smoother and Hann Windowing prefilters are used in the original implementation
phasePeriod(src, dynLow, dynHigh, preHP, preSS, preHP) Phase Accumulation
Parameters:
src : Series to use
dynLow : Lower bound for the dynamic length
dynHigh : Upper bound for the dynamic length
preHP : Use High Pass prefilter (default)
preSS : Use Super Smoother prefilter (default)
preHP : Use Hamm Windowing prefilter
Returns: Calculated period
Based on Dominant Cycle from Phase Accumulation by John F. Ehlers
High Pass and Super Smoother prefilters are used in the original implementation
doAdapt(type, src, len, dynLow, dynHigh, chandeSDLen, chandeSmooth, chandePower, preHP, preSS, preHP) Execute a particular Length Adaptation or Dominant Cycle Estimator from the list
Parameters:
type : Length Adaptation or Dominant Cycle Estimator type to use
src : Series to use
len : Reference lookback length
dynLow : Lower bound for the dynamic length
dynHigh : Upper bound for the dynamic length
chandeSDLen : Lookback length of Standard deviation for Chande's Dynamic Length
chandeSmooth : Smoothing length of Standard deviation for Chande's Dynamic Length
chandePower : Exponent of the length adaptation for Chande's Dynamic Length (lower is smaller variation)
preHP : Use High Pass prefilter for the Estimators that support it (default)
preSS : Use Super Smoother prefilter for the Estimators that support it (default)
preHP : Use Hann Windowing prefilter for the Estimators that support it
Returns: Calculated period (float, not limited)
doEstimate(type, src, dynLow, dynHigh, preHP, preSS, preHP) Execute a particular Dominant Cycle Estimator from the list
Parameters:
type : Dominant Cycle Estimator type to use
src : Series to use
dynLow : Lower bound for the dynamic length
dynHigh : Upper bound for the dynamic length
preHP : Use High Pass prefilter for the Estimators that support it (default)
preSS : Use Super Smoother prefilter for the Estimators that support it (default)
preHP : Use Hann Windowing prefilter for the Estimators that support it
Returns: Calculated period (float, not limited)
Oscillators Overlay w/ Divergencies/Alerts by DGTAn oscillator is a technical analysis tool that, simply said, gauge momentum, determine market trend direction and duration. For some oscillators, fluctuations are bounded by some upper and lower band, and traders use them to discover short-term overbought or oversold conditions.
Oscillators are often combined with moving average indicators to signal trend breakouts or reversals
Histogram, is the difference between the oscillator and signal lines, which oscillates above and below a center line and is used as a good indication of an asset's momentum
What to look for
- Signal Line Crossover is the most common signal produced by the oscillators
- Zero Line Crossovers have a very similar premise to Signal Line Crossovers
- Divergence , when the oscillator and actual price are not in agreement, is another signal created by the oscillators
- Overbought and Oversold , with any range-bound oscillator, conditions are a primary signal generated
Oscillators Overlay study
* Presents oscillators on top of the mian chart (price chart)
* A single indicator for many well known and custom oscillators
* Divergence detection
* Alerts for various condtions
The list of oscillators included;
- Awesome Oscillator (AO)
- Chaikin Oscillator (Chaikin Osc)
- Commodity Channel Index (CCI)
- Distance Oscillator
- Elder-Ray Bear and Bull Power
- Elliott Wave Oscillator (EWO)
- Klinger Oscillator
- Money Flow Index (MFI)
- Moving Average Convergence Divergence (MACD)
- Rate Of Change (ROC)
- Relative Strength Index (RSI)
- Stochastic (Stoch)
- Stochastic RSI (Stoch RSI)
- Volume Oscillator (Volume Osc)
- Wave Trend
In technical analysis, investors find oscillators to be important technical tools and consider them more effective when used in conjunction with other means of technical analysis
Disclaimer : Trading success is all about following your trading strategy and the indicators should fit within your trading strategy, and not to be traded upon solely
The script is for informational and educational purposes only. Use of the script does not constitutes professional and/or financial advice. You alone the sole responsibility of evaluating the script output and risks associated with the use of the script. In exchange for using the script, you agree not to hold dgtrd TradingView user liable for any possible claim for damages arising from any decision you make based on use of the script

Co-relation and St-deviation Strategy - BNB/USDT 15minThis indicator based on statistical analysis. it uses standard deviation and its co-relation to price action to generate signals. and following indicators has been used to calculate standard deviation and its co-relation values. finally it is capable to identify market changes in bottoms to pic most suitable points.
1. Parabolic SAR (parabolic stop and reverse)
2. Supertrend
3. Relative strength index (RSI)
4. Money flow index (MFI)
5. Balance of Power
6. Chande Momentum Oscillator
7. Center of Gravity (COG)
8. Directional Movement Index (DMI)
9. Stochastic
10. Symmetrically weighted moving average with fixed length
11. True strength index (TSI)
12. Williams %R
13. Accumulation/distribution index
14. Intraday Intensity Index
15. Negative Volume Index
16. Positive Volume Index
17. On Balance Volume
18. Price-Volume Trend
19. True range
20. Volume-weighted average price
21. Williams Accumulation/Distribution
22. Williams Variable Accumulation/Distribution
23. Simple Moving Average
24. Exponential Moving Average
25. CCI (commodity channel index)
26. Chop Zone
27. Ease of Movement
28. Detrended Price Oscillator
29. Advance Decline Line
30. Bull Bear Power

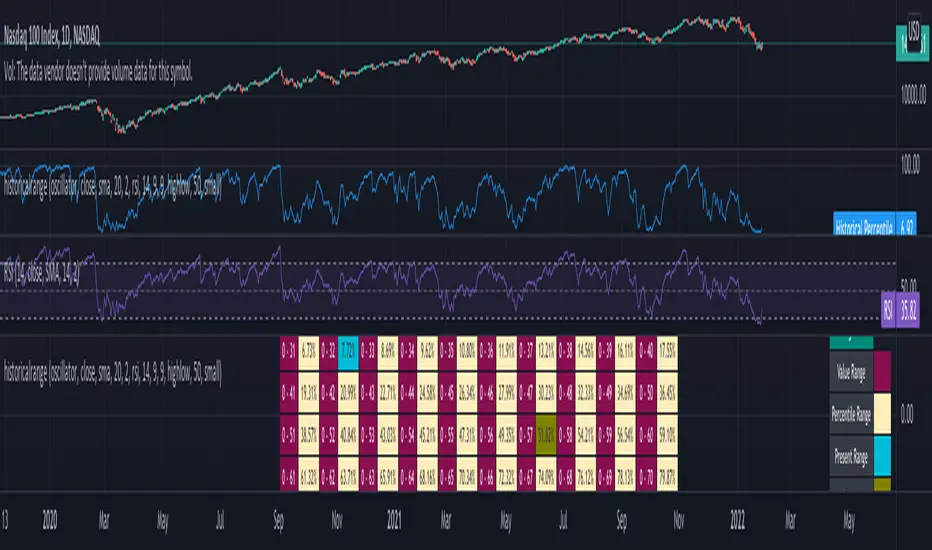
historicalrangeLibrary "historicalrange"
Library provices a method to calculate historical percentile range of series.
hpercentrank(source) calculates historical percentrank of the source
Parameters:
source : Source for which historical percentrank needs to be calculated. Source should be ranging between 0-100. If using a source which can beyond 0-100, use short term percentrank to baseline them.
Returns: pArray - percentrank array which contains how many instances of source occurred at different levels.
upperPercentile - percentile based on higher value
lowerPercentile - percentile based on lower value
median - median value of the source
max - max value of the source
distancefromath(source) returns stats on historical distance from ath in terms of percentage
Parameters:
source : for which stats are calculated
Returns: percentile and related historical stats regarding distance from ath
distancefromma(maType, length, source) returns stats on historical distance from moving average in terms of percentage
Parameters:
maType : Moving Average Type : Can be sma, ema, hma, rma, wma, vwma, swma, highlow, linreg, median
length : Moving Average Length
source : for which stats are calculated
Returns: percentile and related historical stats regarding distance from ath
bpercentb(source, maType, length, multiplier, sticky) returns percentrank and stats on historical bpercentb levels
Parameters:
source : Moving Average Source
maType : Moving Average Type : Can be sma, ema, hma, rma, wma, vwma, swma, highlow, linreg, median
length : Moving Average Length
multiplier : Standard Deviation multiplier
sticky : - sticky boundaries which will only change when value is outside boundary.
Returns: percentile and related historical stats regarding Bollinger Percent B
kpercentk(source, maType, length, multiplier, useTrueRange, sticky) returns percentrank and stats on historical kpercentk levels
Parameters:
source : Moving Average Source
maType : Moving Average Type : Can be sma, ema, hma, rma, wma, vwma, swma, highlow, linreg, median
length : Moving Average Length
multiplier : Standard Deviation multiplier
useTrueRange : - if set to false, uses high-low.
sticky : - sticky boundaries which will only change when value is outside boundary.
Returns: percentile and related historical stats regarding Keltener Percent K
dpercentd(useAlternateSource, alternateSource, length, sticky) returns percentrank and stats on historical dpercentd levels
Parameters:
useAlternateSource : - Custom source is used only if useAlternateSource is set to true
alternateSource : - Custom source
length : - donchian channel length
sticky : - sticky boundaries which will only change when value is outside boundary.
Returns: percentile and related historical stats regarding Donchian Percent D
oscillator(type, length, shortLength, longLength, source, highSource, lowSource, method, highlowLength, sticky) oscillator - returns Choice of oscillator with custom overbought/oversold range
Parameters:
type : - oscillator type. Valid values : cci, cmo, cog, mfi, roc, rsi, stoch, tsi, wpr
length : - Oscillator length - not used for TSI
shortLength : - shortLength only used for TSI
longLength : - longLength only used for TSI
source : - custom source if required
highSource : - custom high source for stochastic oscillator
lowSource : - custom low source for stochastic oscillator
method : - Valid values for method are : sma, ema, hma, rma, wma, vwma, swma, highlow, linreg, median
highlowLength : - length on which highlow of the oscillator is calculated
sticky : - overbought, oversold levels won't change unless crossed
Returns: percentile and related historical stats regarding oscillator
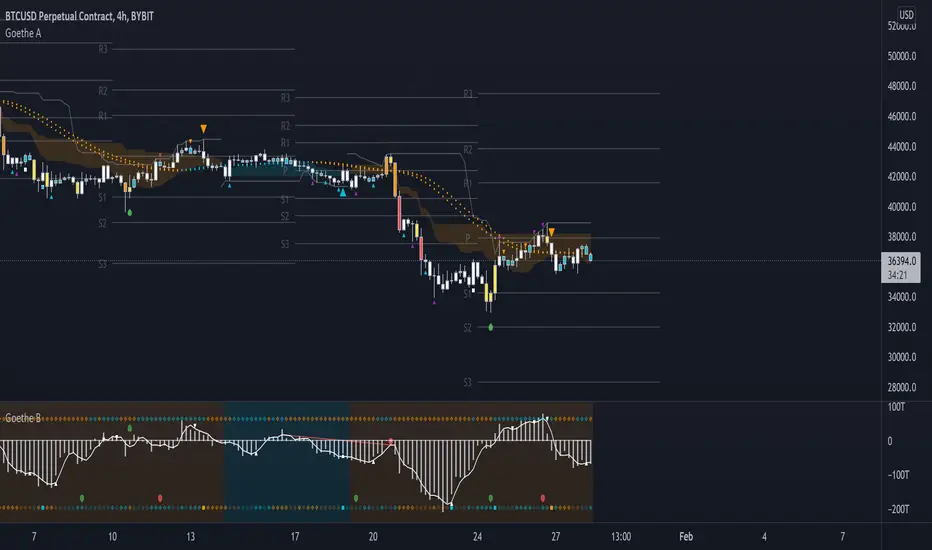
Goethe B - Mutiple Leading Indicator PackageGoethe B is an Indicator Package that contains multiple leading and lagging indicators.
The background is that shows the local trend is calculated by either two Moving Averages or by a Kumo Cloud. By default the Kumo Cloud calculation is used.
What is the main oscillator?
- The main oscillator is TSV, or time segmented volume. It is one of the more interesting leading indicators.
What is the top bar?
-The top bar shows a trend confirmation based on the wolfpack ID indicator.
What are those circles on the second top bar?
-Those are Divergences of an internally calculated PVT oscillator. Red for Regular-Bearish, Green for Regular-Bullish.
What are those circles on the main oscillator?
-These are Divergences. Red for Regular-Bearish. Orange for Hidden-Bearish. Green for Regular-Bullish. Aqua for Hidden-Bullish.
What are those circles on the second lower bar?
-Those are Divergences of an internally calculated CCI indicator. Red for Regular-Bearish, Green for Regular-Bullish.
What is the lower bar?
-The lower bar shows a trend confirmation based on the Acceleration Oscillator, in best case it showes how far in the trend the current price action is.
What are those orange or aqua squares?
- These are TSI (true strength indicator) entry signals . They are calculated by the TSI entry signal, the TSI oscillator threshold.
Most settings of the indicator package can be modified to your liking and based on your chosen strategy might have to be modified. Please keep in mind that this indicator is a tool and not a strategy, do not blindly trade signals, do your own research first! Use this indicator in conjunction with other indicators to get multiple confirmations.
Indicators Combination Framework v3 IND [DTU]Hello All,
This script is a framework to analyze and see the results by combine selected indicators for (long, short, longexit, shortexit) conditions.
I was designed this for beginners and users to facilitate to see effects of the technical indicators combinations on the chart WITH NO CODE
You can improve your strategies according the results of this system by connecting the framework to a strategy framework/template such as Pinecoder, Benson, daveatt or custom.
This is enhanced version of my previous indicator "Indicators & Conditions Test Framework "
Currently there are 93 indicators (23 newly added) connected over library. You can also import an External Indicator or add Custom indicator (In the source)
It is possible to change it from Indicator to strategy (simple one) by just remarking strategy parts in the source code and see real time profit of your combinations
Feel free to change or use it in your source
Special thanks goes to Pine wizards: Trading view (built-in Indicators), @Rodrigo, @midtownsk8rguy, @Lazybear, @Daveatt and others for their open source codes and contributions
SIMPLE USAGE
1. SETTING: Show Alerts= True (To see your entries and Exists)
2. Define your Indicators (ex: INDICATOR1: ema(close,14), INDICATOR2: ema(close,21), INDICATOR3: ema(close,200)
3. Define Your Combinations for long & Short Conditions
a. For Long: (INDICATOR1 crossover INDICATOR2) AND (INDICATOR3 < close)
b. For Short: (INDICATOR1 crossunder INDICATOR2) AND (INDICATOR3 > close)
4. Select Strategy/template (Import strategy to chart) that you export your signals from the list
5. Analyze the best profit by changing Indicators values
SOME INDICATORS DETAILS
Each Indicator includes:
- Factorization : Converting the selected indicator to Double, triple Quadruple such as EMA to DEMA, TEMA QEMA
- Log : Simple or log10 can be used for calculation on function entries
- Plot Type : You can overlay the indicator on the chart (such ema) or you can use stochastic/Percentrank approach to display in the variable hlines range
- Extended Parametes : You can use default parameters or you can use extended (P1,P2) parameters regarding to indicator type and your choice
- Color : You can define indicator color and line properties
- Smooth : you can enable swma smooth
- indicators : you can select one of the 93 function like ema(),rsi().. to define your indicator
- Source : you can select from already defined indicators (IND1-4), External Indicator (EXT), Custom Indicator (CUST), and other sources (close, open...)
CONDITION DETAILS
- There are are 4 type of conditions, long entry, short entry, long exit, short exit.
- Each condition are built up from 4 combinations that joined with "AND" & "OR" operators
- You can see the results by enabling show alerts check box
- If you only wants to enter long entry and long exit, just fill these conditions
- If "close on opposite" checkbox selected on settings, long entry will be closed on short entry and vice versa
COMBINATIONS DETAILS
- There are 4 combinations that joined with "AND" & "OR" operators for each condition
- combinations are built up from compare 1st entry with 2nd one by using operator
- 1st and 2nd entries includes already defined indicators (IND1-5), External Indicator (EXT), Custom Indicator (CUST), and other sources (close, open...)
- Operators are comparison values such as >,<, crossover,...
- 2nd entry include "VALUE" parameter that will use to compare 1st indicator with value area
- If 2nd indicator selected different than "VALUE", value are will mean previous value of the selection. (ex: value area= 2, 2nd entry=close, means close )
- Selecting "NONE" for the 1st entry will disable calculation of current and following combinations
JOINS DETAILS
- Each combination will join wiht the following one with the JOIN (AND, OR) operator (if the following one is not equal "NONE")
CUSTOM INDICATOR
- Custom Indicator defines harcoded in the source code.
- You can call it with "CUST" in the Indicator definition source or combination entries source
- You can change or implement your custom indicator by updating the source code
EXTERNAL INDICATOR
- You can import an external indicator by selecting it from the ext source.
- External Indicator should be already imported to the chart and it have an plot function to output its signal
EXPORTING SIGNAL
- You can export your result to an already defined strategy template such as Pine coders, Benson, Daveatt Strategy templates
- Or you can define your custom export for other future strategy templates
ALERTS
- By enabling show alerts checkbox, you can see long entry exits on the bottom, and short entry exits aon the top of the chart
ADDITIONAL INFO
- You can see all off the inputs descriptions in the tooltips. (You can also see the previous version for details)
- Availability to set start, end dates
- Minimize repainting by using security function options (Secure, Semi Secure, Repaint)
- Availability of use timeframes
-
Version 3 INDICATORS LIST (More to be added):
▼▼▼ OVERLAY INDICATORS ▼▼▼
alma(src,len,offset=0.85,sigma=6).-------Arnaud Legoux Moving Average
ama(src,len,fast=14,slow=100).-----------Adjusted Moving Average
accdist().-------------------------------Accumulation/distribution index.
cma(src,len).----------------------------Corrective Moving average
dema(src,len).---------------------------Double EMA (Same as EMA with 2 factor)
ema(src,len).----------------------------Exponential Moving Average
gmma(src,len).---------------------------Geometric Mean Moving Average
highest(src,len).------------------------Highest value for a given number of bars back.
hl2ma(src,len).--------------------------higest lowest moving average
hma(src,len).----------------------------Hull Moving Average.
lagAdapt(src,len,perclen=5,fperc=50).----Ehlers Adaptive Laguerre filter
lagAdaptV(src,len,perclen=5,fperc=50).---Ehlers Adaptive Laguerre filter variation
laguerre(src,len).-----------------------Ehlers Laguerre filter
lesrcp(src,len).-------------------------lowest exponential esrcpanding moving line
lexp(src,len).---------------------------lowest exponential expanding moving line
linreg(src,len,loffset=1).---------------Linear regression
lowest(src,len).-------------------------Lovest value for a given number of bars back.
mcginley(src, len.-----------------------McGinley Dynamic adjusts for market speed shifts, which sets it apart from other moving averages, in addition to providing clear moving average lines
percntl(src,len).------------------------percentile nearest rank. Calculates percentile using method of Nearest Rank.
percntli(src,len).-----------------------percentile linear interpolation. Calculates percentile using method of linear interpolation between the two nearest ranks.
previous(src,len).-----------------------Previous n (len) value of the source
pivothigh(src,BarsLeft=len,BarsRight=2).-Previous pivot high. src=src, BarsLeft=len, BarsRight=p1=2
pivotlow(src,BarsLeft=len,BarsRight=2).--Previous pivot low. src=src, BarsLeft=len, BarsRight=p1=2
rema(src,len).---------------------------Range EMA (REMA)
rma(src,len).----------------------------Moving average used in RSI. It is the exponentially weighted moving average with alpha = 1 / length.
sar(start=len, inc=0.02, max=0.02).------Parabolic SAR (parabolic stop and reverse) is a method to find potential reversals in the market price direction of traded goods.start=len, inc=p1, max=p2. ex: sar(0.02, 0.02, 0.02)
sma(src,len).----------------------------Smoothed Moving Average
smma(src,len).---------------------------Smoothed Moving Average
super2(src,len).-------------------------Ehlers super smoother, 2 pole
super3(src,len).-------------------------Ehlers super smoother, 3 pole
supertrend(src,len,period=3).------------Supertrend indicator
swma(src,len).---------------------------Sine-Weighted Moving Average
tema(src,len).---------------------------Triple EMA (Same as EMA with 3 factor)
tma(src,len).----------------------------Triangular Moving Average
vida(src,len).---------------------------Variable Index Dynamic Average
vwma(src,len).---------------------------Volume Weigted Moving Average
volstop(src,len,atrfactor=2).------------Volatility Stop is a technical indicator that is used by traders to help place effective stop-losses. atrfactor=p1
wma(src,len).----------------------------Weigted Moving Average
vwap(src_).------------------------------Volume Weighted Average Price (VWAP) is used to measure the average price weighted by volume
▼▼▼ NON OVERLAY INDICATORS ▼▼
adx(dilen=len, adxlen=14, adxtype=0).----adx. The Average Directional Index (ADX) is a used to determine the strength of a trend. len=>dilen, p1=adxlen (default=14), p2=adxtype 0:ADX, 1:+DI, 2:-DI (def:0)
angle(src,len).--------------------------angle of the series (Use its Input as another indicator output)
aroon(len,dir=0).------------------------aroon indicator. Aroons major function is to identify new trends as they happen.p1 = dir: 0=mid (default), 1=upper, 2=lower
atr(src,len).----------------------------average true range. RMA of true range.
awesome(fast=len=5,slow=34,type=0).------Awesome Oscilator is an indicator used to measure market momentum. defaults : fast=len= 5, p1=slow=34, p2=type: 0=Awesome, 1=difference
bbr(src,len,mult=1).---------------------bollinger %%
bbw(src,len,mult=2).---------------------Bollinger Bands Width. The Bollinger Band Width is the difference between the upper and the lower Bollinger Bands divided by the middle band.
cci(src,len).----------------------------commodity channel index
cctbbo(src,len).-------------------------CCT Bollinger Band Oscilator
change(src,len).-------------------------A.K.A. Momentum. Difference between current value and previous, source - source . is most commonly referred to as a rate and measures the acceleration of the price and/or volume of a security
cmf(len=20).-----------------------------Chaikin Money Flow Indicator used to measure Money Flow Volume over a set period of time. Default use is len=20
cmo(src,len).----------------------------Chande Momentum Oscillator. Calculates the difference between the sum of recent gains and the sum of recent losses and then divides the result by the sum of all price movement over the same period.
cog(src,len).----------------------------The cog (center of gravity) is an indicator based on statistics and the Fibonacci golden ratio.
copcurve(src,len).-----------------------Coppock Curve. was originally developed by Edwin Sedge Coppock (Barrons Magazine, October 1962).
correl(src,len).-------------------------Correlation coefficient. Describes the degree to which two series tend to deviate from their ta.sma values.
count(src,len).--------------------------green avg - red avg
cti(src,len).----------------------------Ehler s Correlation Trend Indicator by
dev(src,len).----------------------------ta.dev() Measure of difference between the series and its ta.sma
dpo(len).--------------------------------Detrended Price OScilator is used to remove trend from price.
efi(len).--------------------------------Elders Force Index (EFI) measures the power behind a price movement using price and volume.
eom(len=14,div=10000).-------------------Ease of Movement.It is designed to measure the relationship between price and volume.p1 = div: 10000= (default)
falling(src,len).------------------------ta.falling() Test if the `source` series is now falling for `length` bars long. (Use its Input as another indicator output)
fisher(len).-----------------------------Fisher Transform is a technical indicator that converts price to Gaussian normal distribution and signals when prices move significantly by referencing recent price data
histvol(len).----------------------------Historical volatility is a statistical measure used to analyze the general dispersion of security or market index returns for a specified period of time.
kcr(src,len,mult=2).---------------------Keltner Channels Range
kcw(src,len,mult=2).---------------------ta.kcw(). Keltner Channels Width. The Keltner Channels Width is the difference between the upper and the lower Keltner Channels divided by the middle channel.
klinger(type=len).-----------------------Klinger oscillator aims to identify money flow’s long-term trend. type=len: 0:Oscilator 1:signal
macd(src,len).---------------------------MACD (Moving Average Convergence/Divergence)
mfi(src,len).----------------------------Money Flow Index s a tool used for measuring buying and selling pressure
msi(len=10).-----------------------------Mass Index (def=10) is used to examine the differences between high and low stock prices over a specific period of time
nvi().-----------------------------------Negative Volume Index
obv().-----------------------------------On Balance Volume
pvi().-----------------------------------Positive Volume Index
pvt().-----------------------------------Price Volume Trend
ranges(src,upper=len, lower=-5).---------ranges of the source. src=src, upper=len, v1:lower=upper . returns: -1 source=upper otherwise 0
rising(src,len).-------------------------ta.rising() Test if the `source` series is now rising for `length` bars long. (Use its Input as another indicator output)
roc(src,len).----------------------------Rate of Change
rsi(src,len).----------------------------Relative strength Index
rvi(src,len).----------------------------The Relative Volatility Index (RVI) is calculated much like the RSI, although it uses high and low price standard deviation instead of the RSI’s method of absolute change in price.
smi_osc(src,len,fast=5, slow=34).--------smi Oscillator
smi_sig(src,len,fast=5, slow=34).--------smi Signal
stc(src,len,fast=23,slow=50).------------Schaff Trend Cycle (STC) detects up and down trends long before the MACD. Code imported from
stdev(src,len).--------------------------Standart deviation
trix(src,len) .--------------------------the rate of change of a triple exponentially smoothed moving average.
tsi(src,len).----------------------------The True Strength Index indicator is a momentum oscillator designed to detect, confirm or visualize the strength of a trend.
ultimateOsc(len.-------------------------Ultimate Oscillator indicator (UO) indicator is a technical analysis tool used to measure momentum across three varying timeframes
variance(src,len).-----------------------ta.variance(). Variance is the expectation of the squared deviation of a series from its mean (ta.sma), and it informally measures how far a set of numbers are spread out from their mean.
willprc(src,len).------------------------Williams %R
wad().-----------------------------------Williams Accumulation/Distribution.
wvad().----------------------------------Williams Variable Accumulation/Distribution.
HISTORY
v3.01
ADD: 23 new indicators added to indicators list from the library. Current Total number of Indicators are 93. (to be continued to adding)
ADD: 2 more Parameters (P1,P2) for indicator calculation added. Par:(Use Defaults) uses only indicator(Source, Length) with library's default parameters. Par:(Use Extra Parameters P1,P2) use indicator(Source,Length,p1,p2) with additional parameters if indicator needs.
ADD: log calculation (simple, log10) option added on indicator function entries
ADD: New Output Signals added for compatibility on exporting condition signals to different Strategy templates.
ADD: Alerts Added according to conditions results
UPD: Indicator source inputs now display with indicators descriptions
UPD: Most off the source code rearranged and some functions moved to the new library. Now system work like a little bit frontend/backend
UPD: Performance improvement made on factorization and other source code
UPD: Input GUI rearranged
UPD: Tooltips corrected
REM: Extended indicators removed
UPD: IND1-IND4 added to indicator data source. Now it is possible to create new indicators with the previously defined indicators value. ex: IND1=ema(close,14) and IND2=rsi(IND1,20) means IND2=rsi(ema(close,14),20)
UPD: Custom Indicator (CUST) added to indicator data source and Combination Indicator source.
UPD: Volume added to indicator data source and Combination Indicator source.
REM: Custom indicators removed and only one custom indicator left
REM: Plot Type "Org. Range (-1,1)" removed
UPD: angle, rising, falling type operators moved to indicator library

Oversold / OverboughtMy first script. Based on RSI , CCI , RVI, and MFI . You can customize overbought or oversold thresholds for any indicator.
If you have any ideas - welcome.
Disclaimer
This is not financial advice. Trade on your own risk.

Oscillator %bOscillator %b indicator apply Bollinger Bands on Oscillator Line, and calculate %b to define Buy and Sell signal with detail as below
===
1. Oscillator Type and Parameter
1.1 RSI (56) on H1 Timeframe
1.2 Stochastic (56,3,3) on H1 Timeframe
1.3 CCI (56) on H1 Timeframe
1.4 MACD (48,104,9)) on H1 Timeframe
1.5 AO (20,136) on H1 Timeframe
===
2. Signal
2.1 Buy Signal: at least 4 periods of %b moving betwween 0.0 and 0.2
2.2 Sell Signal: at least 4 periods of %b moving betwween 0.8 and 1.0

customcandlesLibrary "customcandles"
customcandles: Contains methods which can send custom candlesticks based on the input
macandles(maType, length, o, h, l, c) macandles: Provides OHLC of moving average candles
Parameters:
maType : - Moving average Type. Can be sma, ema, hma, rma, wma, vwma, swma, linreg, median
length : - Defaulted to 20. Can chose custom length
o : - Optional different open source. By default is set to open
h : - Optional different high source. By default is set to high
l : - Optional different low source. By default is set to low
c : - Optional different close source. By default is set to close
Returns: : Custom Moving Average based OHLC values
hacandles() hacandles: Provides Heikin Ashi OHLC values
Returns: : Custom Heikin Ashi OHLC values
ocandles(type, length, shortLength, longLength, method, highlowLength, sticky, percentCandles) macandles: Provides OHLC of moving average candles
Parameters:
type : - Oscillator Type. Can be cci, cmo, cog, mfi, roc, rsi, tsi, mfi
length : - Defaulted to 14. Can chose custom length
shortLength : - Used only for TSI. Default is 13
longLength : - Used only for TSI. Default is 25
method : - Valid values for method are : sma, ema, hma, rma, wma, vwma, swma, highlow, linreg, median
highlowLength : - length on which highlow of the oscillator is calculated
sticky : - overbought, oversold levels won't change unless crossed
percentCandles : - candles are generated based on percent with respect to high/low instead of actual oscillator values
Returns: : Custom Moving Average based OHLC values
lib_Indicators_DTLibrary "lib_Indicators_DT"
This library functions returns some Moving averages and indicators.
Created it to feed my indicator/strategy "INDICATOR & CONDITIONS COMBINATOR FRAMEWORK v1 " which I will publish it as soon as possible.
Credits: Library includes some public indicators, snippets from tradingview & @03.freeman's ("All MAs displayed") scripts.
(I hope, I dont break Tradingview's House Rules on Script Publishing)
f_plotPrep(src_, src_, src_, src_) Prepare Indicator Plot Type
Parameters:
src_ : Source
src_ : plotingType_ "Original, Stochastic, Percent"
src_ : stochlen_ Stochasting plottingtype length
src_ : plotSWMA_ Use SWMA for the output
Returns: Return the prepared indicator
f_funcPlot(string, float, simple, string, simple, bool) f_funcPlot(string f, float src_, simple int length_, string plotingType_ = "Original", simple int stochlen_=50, bool plotSWMA=false) Return selected indicator value with different parameters
Parameters:
string : f indicator-> options=
float : src_ close,open.....
simple : int length_ indicator length
string : plotingType return param-> options= ['Original', 'Stochastic', 'PercentRank')
simple : int stochlen_ length for return Param
bool : plotSWMA Use SWMA on Plot
Returns: float

Indicators OverlayHello All,
This script shows the indicators in separate windows on the main chart. Included indicators are RSI, CCI, OBV, Stochastic, Money Flow Index, Average True Range and Chande Momentum Oscillator. indicator windows are located at the top or bottom of the chart according to last moves of the Closing price. Different colors are used for each indicator. Horizontal levels are shown as dashed line and label as well.
Using the options;
You can enable/disable the indicators you want to see or not
You can change source and length for each indicator
You can set window length. using this length indicator windows are located on the chart
After you added this indicator to your chart I recommend: right click on any of the indicator windows => "Visual Order" => "Bring to front" as seen screenshot below:
in this example only 3 indicators enabled and period is set as 80:
indicator windows moves to the top or bottom of the chart according to the close price:
P.S. if you want to see any other indicator in the options then leave a comment under the indicator ;)
Enjoy!

WMA Combo Crossover V2Before I begin I want to mention:
1. This is an upgrade of my indicator WMA Combo Crossover. (Link: www.tradingview.com)
2. The upgrade was inspired from the CCI and Bollinger Bands indicator by matsu_bitmex. (Link: www.tradingview.com)
3. I have combined the indictor with Bollinger Bands , coloring those sections as yellow, to increase winning trades as well as avoid losing trades by spotting potential reversals with the aid of news avoidance
4. This indicator is designed primarily for NNFX (No Nonsense Forex) though it can be used for any type of trading style
5. Also, I want to thank kurtisbu for helping me out. Thank you!
The indicator:
1. When WMA 25 is blue and is going upwards, it means there is an uptrend
2. When WMA 25 is red and is going down, it means there is a downtrend
3. During a trend, the color may switch to red and blue occasionally. When the color switches back to the direction of the trend, it can be used for re-entries
4. All trades based on the yellow color MUST be during a trend
5. When the color changes to yellow that means price is very volatile and only on the 1st candle is it advisable to enter a trade. (I have not backtested entering on the 2nd candle of a yellow color change)
6. During a trend, when the color changes to yellow and there is an incoming news event, then the chances of a reversal increase and I recommended avoid entering

Multi-ZigZag Multi-Oscillator Trend DetectorThis table is intended to give you snapshot of how price and oscillators are moving along with zigzag pivots.
This is done in the same lines of Zigzag-Trend-Divergence-Detector
But, here are the differences
Table shows multiple oscillator movements at a same time instead of one selected oscillator
Divergence is not calculated and also supertrend based trend. Trend can be calculated based on zigzag movements. However, lets keep this for future enhancements.
This system also uses multiple zigzags instead of just one.
⬜ Process
▶ Derive multiple zigzags - Code is taken from Multi-ZigZag
▶ Along with zigzags - also calculate different oscillators and attach it to zigzag pivot.
▶ Calculate directions of zigzag pivots and corresponding oscillators.
▶ Plot everything in the table on last bar.
⬜ Table components
Table contains following data:
Directional legends are:
⇈ - Higher High (Green)
⇊ - Lower Low (Red)
⭡- Lower High (Orange)
⭣ - Higher Low (Lime)
⬜ Input Parameters
▶ Source : Default is close. If Unchecked - uses high/low data for calculating pivots. Can also use external input such as OBV
▶ Stats : Gives option to select the depth of output (History) and also lets you chose text size and table position.
▶ Oscillators : Oscillator length is derived by multiplying multiplier to zigzag length. For example, for zigzag 5, with 4 as multiplier, all oscillators are calculated with length 20. But, same for zigzag 8 will be 32 and so on.
▶ Available oscillators :
CCI - Commodity Channel Index
CMO - Chande Momentum Oscillator
COG - Center Of Gravity
MFI - Money Flow Index (Shows only if volume is present)
MOM - Momentum oscillator
ROC - Rate Of Change
RSI - Relative Strength Index
TSI - Total Strength Index
WPR - William Percent R
BB - Bollinger Percent B
KC - Keltner Channel Percent K
DC - Donchian Channel Percent D
ADC - Adoptive Donchian Channel Percent D ( Adoptive-Donchian-Channel )
⬜ Challenges
There are 12 oscillators and each zigzag has different length. Which means, there are 48 combinations of the ocillators.
First challenge was generating these values without creating lots of static initialization. Also, note, if the functions are not called on each bar, then they will not yield correct result. This is achieved through initializer function which runs on every bar and stores the oscillator values in an array which emulates multi dimensional array oscillator X zigzag length.
Next challenge was getting these values within function when we need it. While doing so I realized that values stored in array also have historical series and calling array.get will actully get you the entire series and not just the value. This is an important takeaway for me and this can be used for further complex implementations.
Thanks to @LonesomeTheBlue and @LucF for some timely suggestions and interesting technical discussions :)

Trend System Oscillator Averages RatingThis is a trend system made with multiple oscillator averages designed especially for trending markets such as stocks or crypto.
It can be used with any timeframe.
Its made of multiple moving oscillators such as
RSI
Stochastic
ADX
CCI
AO
MACD
MOM
STOCH RSI
WPR
BP
UO
Avg of all oscillators
It has also a rating, making an avg from all of the oscillators , going from -100 (all ma's are telling to go short ) to 100 ( all ma are telling to go long).
If you have any questions let me know !

Zigzag Trend/Divergence DetectorPullbacks are always hardest part of the trade and when it happen, we struggle to make decision on whether to continue the trade and wait for recovery or cut losses. Similarly, when an instrument is trending well, it is often difficult decision to make if we want to take some profit off the table. This indicator is aimed to make these decisions easier by providing a combined opinion of sentiment based on trend and possible divergence.
⬜ Process
▶ Use any indicator to find trend bias. Here we are using simple supertrend
▶ Use any oscillator. I have added few inbuilt oscillators as option. Default used is RSI.
▶ Find divergence by using zigzag to detect pivot high/low of price and observing indicator movement difference between subsequent pivots in the same direction.
▶ Combine divregence type, divergence bias and trend bias to derive overall sentiment.
Complete details of all the possible combinations are present here along with table legend
⬜Chart Legend
C - Continuation
D - Divergence
H - Hidden Divergence
I - Indeterminate
⬜ Settings
▶ Zigzag parameters : These let you chose zigzag properties. If you check "Use confirmed pivots", then unconfirmed pivot will be ignored in the table and in the chart
▶ Oscillator parameters : Lets you select different oscillators and settings. Available oscillators involve
CCI - Commodity Channel Index
CMO - Chande Momentum Oscillator
COG - Center Of Gravity
DMI - Directional Movement Index (Only ADX is used here)
MACD - Moving average convergence divergence (Can chose either histogram or MACD line)
MFI - Money Flow Index
MOM - Momentum oscillator
ROC - Rate Of Change
RSI - Relative Strength Index
TSI - Total Strength Index
WPR - William Percent R
BB - Bollinger Percent B
KC - Keltner Channel Percent K
DC - Donchian Channel Percent D
ADC - Adoptive Donchian Channel Percent D ( Adoptive-Donchian-Channel )
▶ Trend bias : Supertrend is used for trend bias. Coloring option color candles in the direction of supertrend. More option for trend bias can be added in future.
▶ Stats : Enables you to display history in tabular format.
Overview of settings present here:
⬜ Notes
Trend detection is done only with respect to previous pivot in the same direction. Hence, if chart has too many zigzags in short period, try increasing the zigzag length or chart timeframe. Similarly, if there is a steep trend, use lower timeframe charts to dig further.
Oscillators does not always make pivots at same bar as price. Due to this some the divergence calculation may not be correct. Hence visual inspection is always recommended.
⬜ Possible future enhancements
More options for trend bias
Enhance divergence calculation. Possible options include using oscillator based zigzag as primary or using close prices based zigzag instead of high/low.
Multi level zigzag option - Can be messy to include more than one zigzag. Option can be added to chose either Level1 or Level2 zigzags.
Alerts - Alerts can only be added for confirmed pivots - otherwise it will generate too many unwanted alerts. Will think about it :)
If I get time, I will try to make a video.
