Bitcoin: Price Action Integral BandsThis indicator tries to display absolute tops and bottoms for Bitcoin. The price action gets integrated with two custom functions resulting in the blue top and red bottom price action integrals. From those integral values we allow 5% deviation in up and down direction, leading to price action integral bands of some non-zero width.
Even in the current liquidity crisis with abnormal price movements, Bitcoin had no weekly candle close below the support band. One thing to note is that in the here presented model, up until now only one single weekly candle touches the blue band in each of Bitcoin's cycles. For longer-term trades it might be a good idea to buy BTC when price is around the red band, and sell/go short when BTC is around the blue band, although this is no financial advice and one should always cross-check with other indicators/informations.
There's the option to plot or hide the bands individually.
The integral bands are specifically designed for the Bitcoin BLX (BraveNewCoin Liquid Index) ticker on weekly timeframe. For other assets, tickers and timeframes the functionality of this indicator cannot be guaranteed and will most probably not deliver meaningful results.
Cerca negli script per "Cycle"

TOP & BOTTOM Cycle [aamonkey]Works best on BTC and only on the daily timeframe!
This is a TOP / BOTTOM indicator for big market cycles.
These tops and bottoms are based on the difference between the 200MA on the daily and the price.

Recursive StochasticThe Self Referencing Stochastic Oscillator
The stochastic oscillator bring values in range of (0,100). This process is called Feature scaling or Unity-Based Normalization
When a function use recursion you can highlights cycles or create smoother results depending on various factors, this is the goal of a recursive stochastic.
For example : k = s(alpha*st+(1-alpha)*nz(k )) where st is the target source.
Using inputs with different scale level can modify the result of the indicator depending on which instrument it is applied, therefore the input must be normalized, here the price is first passed through a stochastic, then this result is used for the recursion.
In order to control the level of the recursion, weights are distributed using the alpha parameter. This parameter is in a range of (0,1), if alpha = 1, then the indicator act as a normal stochastic oscillator, if alpha = 0, then the indicator return na since the initial value for k = 0. The smaller the alpha parameter, the lower the correlation between the price and the indicator, but the indicator will look more periodic.
Comparison
Recursive Stochastic oscillator with alpha = 0.1 and bellow a classic oscillator (alpha = 1)
The use of recursion can both smooth the result and make it more reactive as well.
Filter As Source
It is possible to stabilize the indicator and make it less affected by outliers using a filter as input.
Lower alpha can be used in order to recover some reactivity, this will also lead to more periodic results (which are not inevitably correlated with price)
Hope you enjoy
For any questions/demands feel free to pm me, i would be happy to help you

Spooky Time (10/31/25) [VTB]Get ready to add some eerie fun to your charts this Halloween! "Spooky Time" is a lighthearted indicator that draws a festive, animated Halloween scene right on your TradingView chart. Perfect for traders who want to celebrate the spooky season without missing a beat on the markets. Whether you're analyzing stocks, crypto, or forex, this overlay brings a touch of holiday spirit to your setup.
#### Key Features:
- **Jack-o'-Lantern Pumpkin**: A detailed, glowing pumpkin with carved eyes, nose, and a jagged mouth. The eyes and mouth cycle through black (off), yellow, and red glows for a subtle animation effect, giving it that classic haunted vibe.
- **Flickering Candle**: A wax candle with a wick and an animated flame that shifts positions slightly across three frames, mimicking a real flickering light. The flame color changes between yellow, red, and orange for added dynamism.
- **Spider Web and Spider**: A spiral web with radial lines, complete with a creepy-crawly spider. The spider's legs animate with small movements, as if it's ready to pounce—perfect for that extra spooky touch!
- **Customization Options**: Toggle the "Desiringmachine" label on/off, choose its position on the chart (e.g., Bottom Center), and select the text color. The entire scene is positioned relative to the chart's open price and ATR for better scaling.
- **Animation Cycle**: The whole setup uses a simple 3-frame animation based on bar_index, making it feel alive without overwhelming your chart.
This indicator is purely visual and non-intrusive—it doesn't plot any trading signals or data, so it won't interfere with your strategies. Just add it to your chart for some Halloween cheer during your trading sessions!
**Date Note**: Timed for Halloween 2025 (10/31/25)—feel the spooky energy!
**Happy Halloween!!!** 🎃👻🕸️

Seasonality Forecast 4H A seasonality indicator shows recurring patterns in data that occur at the same time each year, such as retail sales peaking during the holidays or demand for ice cream rising in the summer. These indicators are used in fields like business, economics, and finance to identify predictable, time-based fluctuations, allowing for better forecasting and strategic planning, like adjusting inventory or staffing levels. In trading, a seasonality indicator can show historical patterns, like an asset's tendency to rise or fall in a specific month, to provide additional context for decision-making.
Seasonality reasoning basically seasonality works most stably on the daily frame with the input parameter being trading day 254 or calendar day 365, ..
Use seasonal effects such as sell in May, buy Christmas season, or exploit factors such as sell on Friday, ... to track the price movement.
The lower the time frame, the more parameters need to be calculated and the more complicated. I have tried to code the version with 1 hour, 15 minutes and 4 hours time frames
On the statistical language R and Python, Pine script
Tradingview uses the exclusive and unique Pine language. There is a parameter limit, just need to change the number of forecast days or calculate shorter or only calculate the basic end time value, we seasonality still works
but the overall results are easily noisy and related to controlling the number of orders per week/month and risk management.
The 4-hour frame version works well because we exploit the seasonal factor according to the 4-hour trading session as a trading session
Every 4 hours we have an input value that corresponds to the Asian, European, and American trading sessions
4 hours - half a morning Asian session.4 hours - half an afternoon Asian session, 4 hours - half a morning European session, 4 hours - half an afternoon European session, similar to the US and repeat the cycle.
Input Parameter Declaration
Tradingview does not exist declaration form day_of_year = dayofyear(time) Pine Script v5:
Instead of using dayofyear, we manually calculate the number of days in a year from the time components.
// Extract year, month, day, hour
year_now = year(time)
month_now = month(time)
day_now = dayofmonth(time)
hour_now = hour(time)
// Precomputed cumulative days per month (non-leap year)
days_before_month = array.from(0, 31, 59, 90, 120, 151, 181, 212, 243, 273, 304, 334)
// Calculate day-of-year
day_of_year = array.get(days_before_month, month_now - 1) + day_now
Input parameter customization window
Lookback period years default is 10, max - the number of historical bars we have, should only be 5 years, 10 years, 15 years, 20 years, 30 years.
Future project bar default is 180 bars - 1 month. We can adjust arbitrarily 6*24*254 - day/month/year
smoothingLength Smooth the data (1 = no smoothing)
offsetBars Move the forecast line left/right to check the past
How to use
Combine seasonality with Supply Demand, Footprint volume profile to find long-term trends or potential reversal points
day_of_year := day_of_year + ((is_leap and month_now > 2) ? 1 : 0)
// Compute bin index
binIndex = (day_of_year * sessionsPerDay) + math.floor(hour_now / 4)
binIndex := binIndex % binsPerYear // Keep within array bounds
The above is the manual code to replace day of year

Swing Oracle Stock 2.0- Gradient Enhanced# 🌈 Swing Oracle Pro - Advanced Gradient Trading Indicator
**Transform your technical analysis with stunning gradient visualizations that make market trends instantly recognizable.**
## 🚀 **What Makes This Indicator Special?**
The **Swing Oracle Pro** revolutionizes traditional technical analysis by combining advanced NDOS (Normalized Distance from Origin of Source) calculations with a sophisticated gradient color system. This isn't just another indicator—it's a complete visual trading experience that adapts colors based on market strength, making trend identification effortless and intuitive.
## 🎨 **10 Professional Gradient Themes**
Choose from carefully crafted color schemes designed for optimal visual clarity:
- **🌅 Sunset** - Warm oranges and purples for classic elegance
- **🌊 Ocean** - Cool blues and teals for calm analysis
- **🌲 Forest** - Natural greens and browns for organic feel
- **✨ Aurora** - Ethereal greens and magentas for mystique
- **⚡ Neon** - Vibrant electric colors for high-energy trading
- **🌌 Galaxy** - Deep purples and cosmic hues for night sessions
- **🔥 Fire** - Intense reds and golds for volatile markets
- **❄️ Ice** - Cool whites and blues for clear-headed decisions
- **🌈 Rainbow** - Full spectrum for comprehensive analysis
- **⚫ Monochrome** - Professional grays for focused trading
## 📊 **Core Features**
### **Advanced NDOS System**
- Normalized Distance from Origin of Source calculation with 231-period length
- Smoothed with customizable EMA for reduced noise
- Multi-timeframe confirmation with H1 filter option
- Dynamic gradient coloring based on oscillator position
### **Intelligent Visual Feedback**
- **Primary Gradient Line** - Main NDOS plot with dynamic color transitions
- **Gradient Fill Zones** - Beautiful color-coded areas for bullish, neutral, and bearish regions
- **Smart Transparency** - Colors adjust intensity based on market volatility
- **Dynamic Backgrounds** - Subtle gradient backgrounds that respond to market conditions
### **Enhanced EMA Projection System**
- 75/760 period EMA normalization with 50-period lookback
- Gradient-colored projection line for trend forecasting
- Toggleable display with advanced gradient controls
- Price tracking for precise level identification
### **Multi-Timeframe Analysis Table**
- Real-time trend analysis across 6 timeframes (1m, 3m, 5m, 15m, 1H, 4H)
- Gradient-colored cells showing trend strength
- Customizable table size and position
- Professional emoji indicators (🚀 UP, 📉 DOWN, ➡️ FLAT)
### **Signal System**
- **Gradient Buy Signals** - Triangle up arrows with intensity-based coloring
- **Gradient Sell Signals** - Triangle down arrows with strength indicators
- **Alert Conditions** - Built-in alerts for all signal types
- **7-Day Cycle Tracking** - Tuesday-to-Tuesday weekly cycle visualization
## ⚙️ **Customization Controls**
### **🎨 Gradient Controls**
- **Gradient Intensity** - Adjust color vibrancy (0.1-1.0)
- **Gradient Smoothing** - Control color transition smoothness (1-10 periods)
- **Dynamic Background** - Toggle animated background gradients
- **Advanced Gradients** - Enable/disable EMA projection and enhanced features
### **🛠️ Custom Color System**
- **Bullish Colors** - Define custom start/end colors for bull markets
- **Bearish Colors** - Set personalized bear market gradients
- **Full Theme Override** - Create completely custom color schemes
- **Real-time Preview** - See changes instantly on your chart
## 📈 **How to Use**
1. **Choose Your Theme** - Select from 10 professional gradient themes
2. **Configure Levels** - Adjust high/low levels (default 60/40) for your timeframe
3. **Set Smoothing** - Fine-tune gradient smoothing for your trading style
4. **Enable Features** - Toggle background gradients, candlestick coloring, and advanced EMA projection
5. **Monitor Signals** - Watch for gradient buy/sell arrows and multi-timeframe confirmations
## 🎯 **Trading Applications**
- **Swing Trading** - Perfect for identifying medium-term trend changes
- **Scalping** - Multi-timeframe table provides quick trend confirmation
- **Position Sizing** - Gradient intensity shows signal strength for risk management
- **Market Analysis** - Beautiful visualizations make complex data instantly understandable
- **Education** - Ideal for learning market dynamics through visual feedback
## ⚡ **Performance Optimized**
- **Smart Rendering** - Colors update only on significant changes
- **Efficient Calculations** - Optimized algorithms for smooth performance
- **Memory Management** - Minimal resource usage even with complex gradients
- **Real-time Updates** - Responsive to market changes without lag
## 🚨 **Alert System**
Built-in alert conditions notify you when:
- NDOS crosses above high level (Buy Signal)
- NDOS crosses below low level (Sell Signal)
- Multi-timeframe confirmations align
- Customizable alert messages with emoji indicators
## 🔧 **Technical Specifications**
- **PineScript Version**: v6 (Latest)
- **Overlay**: True (plots on main chart)
- **Calculations**: NDOS, EMA normalization, volatility-based transparency
- **Timeframes**: Compatible with all timeframes
- **Markets**: Stocks, Forex, Crypto, Commodities, Indices
## 💡 **Why Choose Swing Oracle Pro?**
This isn't just another technical indicator—it's a complete visual transformation of your trading experience. The gradient system provides instant visual feedback that traditional indicators simply can't match. Whether you're a beginner learning to read market trends or an experienced trader seeking clearer signals, the Swing Oracle Pro delivers professional-grade analysis with unprecedented visual clarity.
**Experience the future of technical analysis. Your charts will never look the same.**
---
*⚠️ Disclaimer: This indicator is for educational and informational purposes only. Past performance does not guarantee future results. Always conduct your own research and consider risk management before making trading decisions.*
**🔔 Like this indicator? Please leave a comment and boost! Your feedback helps improve future updates.**
---
**📝 Tags:** #GradientTrading #SwingTrading #NDOS #MultiTimeframe #TechnicalAnalysis #VisualTrading #TrendAnalysis #ColorCoded #ProfessionalCharts #TradingToo

Bullish Divergence SMI Base & Trigger with ATR FilterDescription:
A bullish divergence indicator combining the Stochastic Momentum Index (SMI) and Average True Range (ATR) to pinpoint high-probability entries:
1. Base Arrow (Orange ▲):
• Marks every SMI %K / %D bullish crossover where %K < –70 (deep oversold)—the first half of the divergence setup.
• Each new qualifying crossover replaces the previous base, continuously “arming” the divergence signal.
• Configurable SMI lookbacks, oversold threshold, and a base timeout (default 100 days) to clear stale bases.
2. Trigger Arrow (Green ▲):
• Completes the bullish divergence: fires on the next SMI bullish crossover where %K > –60 and price has dropped below the base arrow’s close by at least N × ATR (default 1 × 14-day ATR).
• A dashed green line links the base and trigger to visually confirm the divergence.
• Resets after triggering, ready for a new divergence cycle.
Inputs:
• SMI %K Length, EMA Smoothing, %D Length
• Oversold Base Level (–70), Trigger Level (–60)
• ATR Length (14), ATR Multiplier (1.0)
• Base Timeout (100 days)
Ideal for any market, this study highlights genuine bullish divergences—oversold momentum crossovers that coincide with significant price reactions—before entering long trades.

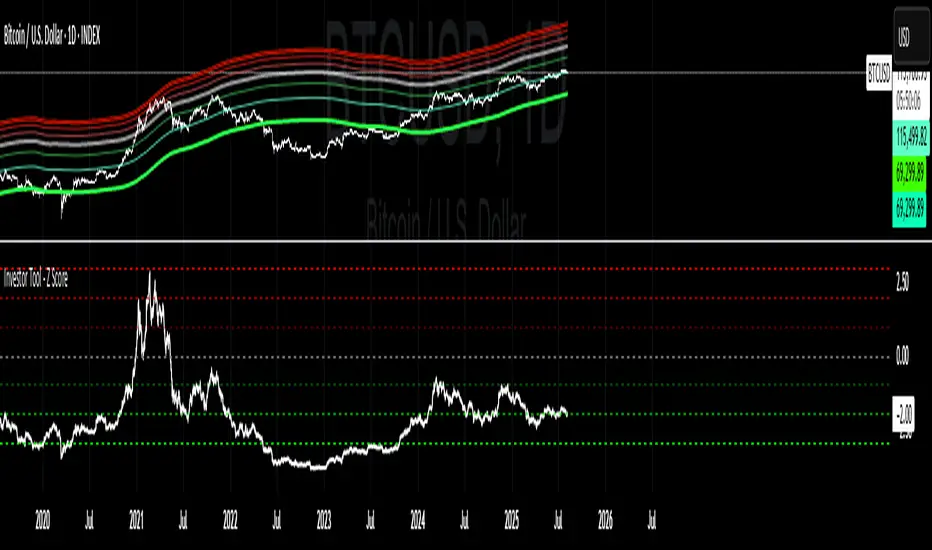
Investor Tool - Z ScoreThe Investor Tool is intended as a tool for long term investors, indicating periods where prices are likely approaching cyclical tops or bottoms. The tool uses two simple moving averages of price as the basis for under/overvalued conditions: the 2-year MA (green) and a 5x multiple of the 2-year MA (red).
Price trading below the 2-year MA has historically generated outsized returns, and signalled bear cycle lows.
Price trading above the 2-year MA x5 has been historically signalled bull cycle tops and a zone where investors de-risk.
Just like the Glassnode one, but here on TV and with StDev bands
Now with Z-SCORE calculation:
The Z-Score is calculated to be -3 Z at the bottom bands and 3 Z at the top bands
mean = (upper_sma + bottom_sma) / 2
bands_range = upper_sma - bottom_sma
stdDev = bands_range != 0 ? bands_range / 6 : 0
zScore = stdDev != 0 ? (close - mean) / stdDev : 0
Created for TRW
Gann Ultimate Time-Price Squares Method V 1.0This Script is an outcome of my Passion towards Gann Theory and his Methodology towards Trading.
The Script is still Evolving.So wait for more updates....
# Complete Trading Guide: Gann Time-Price Squares Indicator
## 🎯 Core Trading Philosophy
**Gann's Key Principle**: "When time and price come together, a change in trend occurs."
Your indicator identifies these critical moments where **Time = Price**, creating high-probability trading opportunities.
---
## 📊 Setup & Configuration
### Recommended Settings by Timeframe
| Timeframe | Pivot Lookback | Min Price Move | Tolerance | Use Case |
|-----------|---------------|----------------|-----------|----------|
| **1-5 min** | 5-8 bars | 0.5-1.0 | 1.0-2.0 | Scalping |
| **15-30 min** | 8-12 bars | 1.0-3.0 | 1.5-2.5 | Day Trading |
| **1-4 hour** | 10-15 bars | 2.0-5.0 | 2.0-3.0 | Swing Trading |
| **Daily** | 15-25 bars | 5.0-20.0 | 3.0-5.0 | Position Trading |
### Initial Setup Steps
1. **Add indicator** to your chart
2. **Set lookback period** based on your timeframe
3. **Adjust tolerance** - start with 2.0 and fine-tune
4. **Enable all visualizations** initially
5. **Position info table** where it doesn't block price action
---
## 🚀 Trading Strategies
### Strategy 1: Square Completion Reversal Trading
#### **Long Entry Setup**
```
CONDITIONS:
✅ Bullish square completes (green box appears)
✅ Info table shows "✅ COMPLETED" status
✅ Price bounces off square's bottom edge
✅ Volume increases on bounce
✅ RSI < 30 (oversold confirmation)
ENTRY: Market buy when price breaks above square's top edge
STOP: Below square's bottom edge (-2 ATR)
TARGET: Next resistance level or 1:2 Risk/Reward
```
#### **Short Entry Setup**
```
CONDITIONS:
✅ Bearish square completes (red box appears)
✅ Info table shows "✅ COMPLETED" status
✅ Price rejects square's top edge
✅ Volume increases on rejection
✅ RSI > 70 (overbought confirmation)
ENTRY: Market sell when price breaks below square's bottom edge
STOP: Above square's top edge (+2 ATR)
TARGET: Next support level or 1:2 Risk/Reward
```
### Strategy 2: Gann Angle Trend Following
#### **1x1 Angle (45°) - The Master Angle**
- **Most Important**: This is Gann's primary trend line
- **Bullish**: Price above 1x1 = uptrend intact
- **Bearish**: Price below 1x1 = downtrend intact
- **Break**: 1x1 angle break = major trend change
#### **Multi-Angle Confluence Trading**
```
STRONG BULLISH SIGNAL:
✅ Price above 1x1 angle (45°)
✅ Bouncing off 2x1 angle (support)
✅ Volume increasing
✅ Multiple angles pointing up
ENTRY: Buy on 2x1 angle bounce
STOP: Below 1x2 angle
TARGET: Next angle resistance
```
### Strategy 3: Projection Trading (Forming Squares)
#### **Anticipation Strategy**
```
SETUP IDENTIFICATION:
👀 Info table shows "⚡ FORMING" status
👀 Progress bar > 70%
👀 P/T Ratio approaching 1.00
👀 Price approaching projected completion zone
ENTRY PREPARATION:
- Set alerts for projected completion levels
- Prepare for reversal at projection zone
- Watch for volume confirmation
- Monitor momentum indicators
```
## 📈 Step-by-Step Trading Process
### Phase 1: Market Analysis (Before Trading)
1. **Check Market Trend**: Look at info table trend indicator
2. **Identify Active Pivots**: Note last significant high/low
3. **Assess Volatility**: High volatility = larger stops needed
4. **Review Completed Squares**: These become support/resistance zones
### Phase 2: Trade Setup Identification
1. **Monitor Forming Squares**: Watch progress bars in info table
2. **Check Gann Angles**: Are they supporting or opposing your bias?
3. **Confirm with Volume**: Look for volume spikes at key levels
4. **Set Alerts**: Use TradingView alerts for completion zones
### Phase 3: Trade Execution
1. **Wait for Confirmation**: Don't trade on projections alone
2. **Enter on Breakout**: Price breaking square boundaries
3. **Set Stops Immediately**: Use square edges as stop levels
4. **Scale Out**: Take partial profits at angle intersections
### Phase 4: Trade Management
1. **Trail Stops**: Use Gann angles as trailing stop levels
2. **Monitor Progress**: Watch for new square formations
3. **Exit Signals**: New squares in opposite direction
4. **Review Performance**: Analyze win/loss against square accuracy
---
## 🎯 High-Probability Setups
### Setup A: Double Confirmation
```
BULLISH EXAMPLE:
1. Bullish square completes at major support
2. Price bounces off 1x1 Gann angle
3. Volume surge confirms reversal
4. RSI divergence present
PROBABILITY: 75-80%
RISK/REWARD: 1:3 typical
```
### Setup B: Angle Breakout
```
BEARISH EXAMPLE:
1. Price breaks below 1x1 angle
2. Bearish square forming below break
3. Multiple angles now resistance
4. Volume confirms breakdown
PROBABILITY: 70-75%
RISK/REWARD: 1:2.5 typical
```
### Setup C: Time Cycle Convergence
```
REVERSAL EXAMPLE:
1. Square completion at time cycle high/low
2. Multiple Gann angles converging
3. Momentum divergence
4. Volume climax
PROBABILITY: 80-85%
RISK/REWARD: 1:4 possible
```
---
## ⚠️ Risk Management Rules
### Position Sizing
- **Conservative**: 1-2% risk per trade
- **Aggressive**: 2-3% risk per trade
- **Never exceed**: 5% total portfolio risk
### Stop Loss Guidelines
- **Completed Squares**: Opposite edge + 1 ATR
- **Gann Angles**: Below/above angle + 0.5 ATR
- **Projections**: 50% of square height
### Take Profit Targets
- **Target 1**: Next Gann angle (1:1 R/R)
- **Target 2**: Next completed square (1:2 R/R)
- **Target 3**: Major S/R level (1:3 R/R)
---
## 📊 Reading the Info Table for Trading
### Market Trend Section
```
📈 BULLISH → Look for long setups
📉 BEARISH → Look for short setups
➡️ NEUTRAL → Wait for direction
```
### Volatility Status
```
🔥 HIGH → Larger stops needed
⚡ ELEVATED → Normal stops
😴 LOW → Tighter stops possible
📊 NORMAL → Standard approach
```
### Square Progress Monitoring
```
✅ COMPLETED → Ready to trade
⚡ FORMING → Prepare for setup
🔥 ACTIVE → Monitor closely
⏳ WAITING → No immediate action
```
### P/T Ratio Interpretation
```
🎯 Perfect (0.8-1.2) → High probability setup
⚡ Good (0.6-1.4) → Moderate probability
⚠️ Watch (outside range) → Lower probability
```
---
## 🔄 Common Trading Scenarios
### Scenario 1: Trend Continuation
**Setup**: Price pulls back to completed square in uptrend
**Action**: Buy at square support with 1x1 angle confirmation
**Management**: Trail stop below each new square formation
### Scenario 2: Reversal Trading
**Setup**: Multiple squares complete at major S/R
**Action**: Fade the move when price rejects square edges
**Management**: Quick profits, tight stops
### Scenario 3: Breakout Trading
**Setup**: Price consolidates in square, then breaks out
**Action**: Trade breakout direction with volume confirmation
**Management**: Use opposite square edge as stop
---
## 📱 Alert Setup Recommendations
### Critical Alerts
1. **Square Completion**: "Gann Square Completed - Check for reversal"
2. **1x1 Angle Break**: "Master angle broken - Trend change possible"
3. **Projection Reached**: "Forming square at 90% - Prepare for reversal"
4. **Multi-Angle Touch**: "Price at angle confluence - High probability setup"
---
Remember: **Gann analysis is both art and science**. The indicator provides the mathematical framework, but successful trading requires patience, discipline, and continuous learning. Start with small positions while you master the methodology!

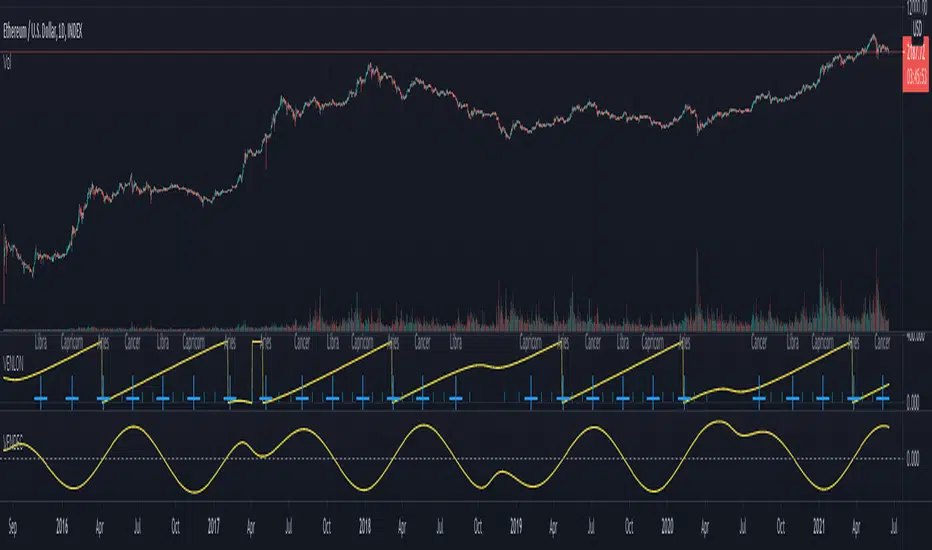
Rainbow Price Chart This indicator is a technical and on-chain analysis tool for Bitcoin, designed to help investors better understand the different phases of the market cycle and underlying sentiment. It directly overlays on the price chart (overlay=true).
Indicator Name: "Rainbow Price Chart & V/T Ratio Signals"
General Purpose:
It combines two popular methodologies for visualizing Bitcoin's value and sentiment: the classic "Rainbow Price Chart" and signals derived from the "Value per Transaction Ratio" (V/T Ratio) based on blockchain data. It is ideal for long-term investors looking for strategic entry/exit points.
Main Components:
Rainbow Price Chart:
Concept: Divides Bitcoin's price range into different market "sentiment zones" (e.g., "Bubble Zone," "FOMO Zone," "HODL Zone," "Accumulation Zone," "Buy Zone," "Fire Sale Zone") using colored bands. These bands are calculated as ascending and descending multiples of a base Exponential Moving Average (EMA), configurable by default to 200 periods.
Visualization: The zones are represented with transparent color fills on the price chart. A detailed legend in the top right corner of the chart explains the meaning of each color and sentiment zone.
Important Note: This type of chart is designed to be viewed and analyzed correctly on a logarithmic price scale. The indicator includes a visual reminder to activate this scale.
Value per Transaction (V/T) Ratio Signals:
Concept: Measures the average value per transaction on the Bitcoin blockchain by dividing the total transacted volume in USD by the number of transactions. This ratio is smoothed with an Exponential Moving Average (by default, 7 periods) and is framed within a dynamic Linear Regression Channel (LRC) based on standard deviation.
Signal Generation: Based on the position of the smoothed V/T Ratio within this LRC channel, the indicator generates signals directly on the price chart, such as:
"BOTTOM": Low price, V/T Ratio in the lower band of the LRC.
"SEMI-LOW" / "SEMI-HIGH": Intermediate phases within the channel.
"ATH" (All-Time High): Potentially overvalued price, V/T Ratio in the upper band of the LRC.
On-Chain Data: The indicator requests external daily on-chain data for total transacted volume (TVTVR) and number of transactions (NTRAN) from the Bitcoin blockchain.
Diagnostic Panes: Includes plots of the raw on-chain data (volume and number of transactions) in a separate pane, which are useful for debugging or verifying the data source. The lines for the V/T Ratio itself and its LRC channel are not plotted by default but can be activated in the code for deeper analysis.
Ideal for:
Bitcoin investors and "hodlers" who desire a visual tool that combines price-based market cycle context with fundamental signals derived from on-chain activity, to help identify key moments for accumulation or potential distribution.
Considerations:
Relies on the availability of external on-chain data (QUANDL:BCHAIN) within TradingView.
Functions best on a daily timeframe.

Schaff Trend Cycle (STC)The STC (Schaff Trend Cycle) indicator is a momentum oscillator that combines elements of MACD and stochastic indicators to identify market cycles and potential trend reversals.
Key features of the STC indicator:
Oscillates between 0 and 100, similar to a stochastic oscillator
Values above 75 generally indicate overbought conditions
Values below 25 generally indicate oversold conditions
Signal line crossovers (above 75 or below 25) can suggest potential entry/exit points
Faster and more responsive than traditional MACD
Designed to filter out market noise and identify cyclical trends
Traders typically use the STC indicator to:
Identify potential trend reversals
Confirm existing trends
Generate buy/sell signals when combined with other technical indicators
Filter out false signals in choppy market conditions
This STC implementation includes multiple smoothing options that act as filters:
None: Raw STC values without additional smoothing, which provides the most responsive but potentially noisier signals.
EMA Smoothing: Applies a 3-period Exponential Moving Average to reduce noise while maintaining reasonable responsiveness (default).
Sigmoid Smoothing: Transforms the STC values using a sigmoid (S-curve) function, creating more gradual transitions between signals and potentially reducing whipsaw trades.
Digital (Schmitt Trigger) Smoothing: Creates a binary output (0 or 100) with built-in hysteresis to prevent rapid switching.
The STC indicator uses dynamic color coding to visually represent momentum:
Green: When the STC value is above its 5-period EMA, indicating positive momentum
Red: When the STC value is below its 5-period EMA, indicating negative momentum
The neutral zone (25-75) is highlighted with a light gray fill to clearly distinguish between normal and extreme readings.
Alerts:
Bullish Signal Alert:
The STC has been falling
It bottoms below the 25 level
It begins to rise again
This pattern helps confirm potential uptrend starts with higher reliability.
Bearish Signal Alert:
The STC has been rising
It peaks above the 75 level
It begins to decline
This pattern helps identify potential downtrend starts.

IlluminateThe Illuminate script predicts the potential range of Bitcoin's top and bottom prices based on a logarithmic regression model, referencing Bitcoin's historical price trends and halvings. This script is designed to provide valuable insights into Bitcoin's price dynamics and long-term trends using principles derived from the "Bitcoin Law."
Key Features
Power Law Trend Lines
Primary Trend:
Projects the general growth trajectory of Bitcoin prices over time based on a logarithmic power law.
Resistance Line:
Identifies a potential upper limit of Bitcoin prices during market peaks.
Includes an offset trendline for an additional buffer zone.
Support Line:
Represents a possible bottom for Bitcoin prices during market downturns.
Offset trendlines highlight potential zones of price fluctuation near the support line.
Fill Zones:
Between resistance and offset: Semi-transparent Red.
Between support and offset: Semi-transparent Green/Blue.
Bitcoin Halving Events
Automatically marks significant Bitcoin halving dates with yellow vertical lines and labeled annotations.
Current and future halvings (approximate) are included.
Trending Phase Indication
A dynamic visual color fill highlights different phases of Bitcoin's price evolution based on a 4-year cycle.
Colors: Red, Green, Blue, Orange (indicating each phase).
"Trending Phase" label provides insight into the current phase.
Interactive Inputs
Show/Hide Resistance: Toggle resistance trend lines.
Show/Hide Support: Toggle support trend lines.
Show/Hide Halving Dates: Toggle visibility of halving annotations.
Customizable Parameters
Fine-tune parameters (A and n) for the main trend line to match your analysis needs.
How to Use
Overlay Analysis:
Add this script to your TradingView chart for direct overlay on Bitcoin's price data.
Interpret the Zones:
Use the resistance and support lines as potential upper and lower bounds for price movements.
Analyze fill zones for areas of likely price oscillation.
Halving Significance:
Observe price behavior before and after halving dates, which historically influence market trends.
Long-Term Perspective:
The model is optimized for long-term projections, making it suitable for strategic, rather than short-term, trading decisions.
Disclaimer:
This indicator is for educational purposes only and should not be used as investment advice. Always do your own research and consult with a financial advisor before making trading decisions.

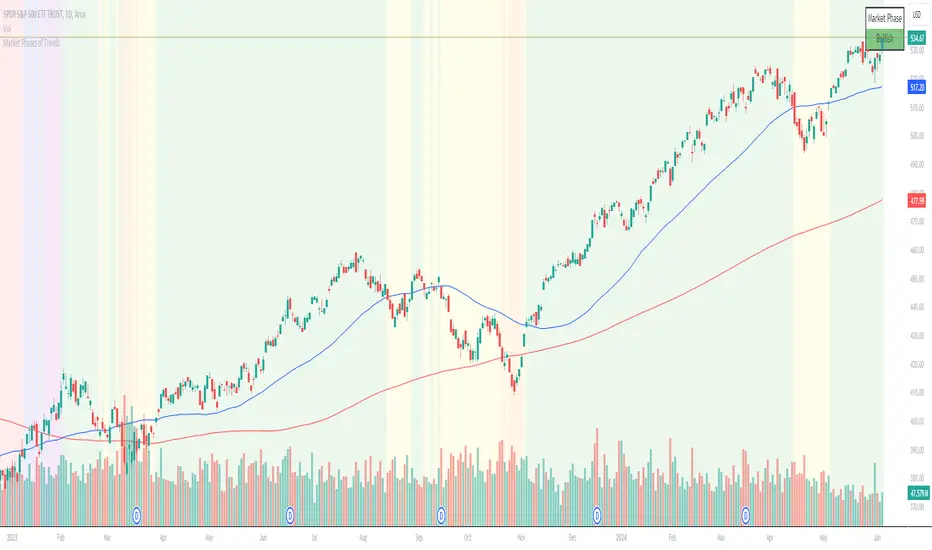
Chuck Dukas Market Phases of Trends (based on 2 Moving Averages)This script is based on the article “Defining The Bull And The Bear” by Chuck Duckas, published in Stocks & Commodities V. 25:13 (14-22); (S&C Bonus Issue, 2007).
The article “Defining The Bull And The Bear” discusses the concepts of “bullish” and “bearish” in relation to the price behavior of financial instruments. Chuck Dukas explains the importance of analyzing price trends and provides a framework for categorizing price activity into six phases. These phases, including recovery, accumulation, bullish, warning, distribution, and bearish, help to assess the quality of the price structure and guide decision-making in trading. Moving averages are used as tools for determining the context preceding the current price action, and the slope of a moving average is seen as an indicator of trend and price phase analysis.
The six phases of trends
// Definitions of Market Phases
recovery_phase = src > ma050 and src < ma200 and ma050 < ma200 // color: blue
accumulation_phase = src > ma050 and src > ma200 and ma050 < ma200 // color: purple
bullish_phase = src > ma050 and src > ma200 and ma050 > ma200 // color: green
warning_phase = src < ma050 and src > ma200 and ma050 > ma200 // color: yellow
distribution_phase = src < ma050 and src < ma200 and ma050 > ma200 // color: orange
bearish_phase = src < ma050 and src < ma200 and ma050 < ma200 // color red
Recovery Phase : This phase marks the beginning of a new trend after a period of consolidation or downtrend. It is characterized by the gradual increase in prices as the market starts to recover from previous losses.
Accumulation Phase : In this phase, the market continues to build a base as prices stabilize before making a significant move. It is a period of consolidation where buying and selling are balanced.
Bullish Phase : The bullish phase indicates a strong upward trend in prices with higher highs and higher lows. It is a period of optimism and positive sentiment in the market.
Warning Phase : This phase occurs when the bullish trend starts to show signs of weakness or exhaustion. It serves as a cautionary signal to traders and investors that a potential reversal or correction may be imminent.
Distribution Phase : The distribution phase is characterized by the market topping out as selling pressure increases. It is a period where supply exceeds demand, leading to a potential shift in trend direction.
Bearish Phase : The bearish phase signifies a strong downward trend in prices with lower lows and lower highs. It is a period of pessimism and negative sentiment in the market.
These rules of the six phases outline the cyclical nature of market trends and provide traders with a framework for understanding and analyzing price behavior to make informed trading decisions based on the current market phase.
60-period channel
The 60-period channel should be applied differently in each phase of the market cycle.
Recovery Phase : In this phase, the 60-period channel can help identify the beginning of a potential uptrend as price stabilizes or improves. Traders can look for new highs frequently in the 60-period channel to confirm the trend initiation or continuation.
Accumulation Phase : During the accumulation phase, the 60-period channel can highlight that the current price is sufficiently strong to be above recent price and longer-term price. Traders may observe new highs frequently in the 60-period channel as the slope of the 50-period moving average (SMA) trends upwards while the 200-period moving average (SMA) slope is losing its downward slope.
Bullish Phase : In the bullish phase, the 60-period channel showing a series of higher highs is crucial for confirming the uptrend. Additionally, traders should observe an upward-sloping 50-period SMA above an upward-sloping 200-period SMA for further validation of the bullish phase.
Warning Phase : When in the warning phase, the 60-period channel can provide insights into whether the current price is weaker than recent prices. Traders should pay attention to the relationship between the price close, the 50-period SMA, and the 200-period SMA to gauge the strength of the phase.
Distribution Phase : In the distribution phase, traders should look for new lows frequently in the 60-period channel, hinting at a weakening trend. It is crucial to observe that the 50-period SMA is still above the 200-period SMA in this phase.
Bearish Phase : Lastly, in the bearish phase, the 60-period channel reflecting a series of lower lows confirms the downtrend. Traders should also note that the price close is below both the 50-period SMA and the 200-period SMA, with the relationship of the 50-period SMA being less than the 200-period SMA.
By carefully analyzing the 60-period channel in each phase, traders can better understand market trends and make informed decisions regarding their investments.
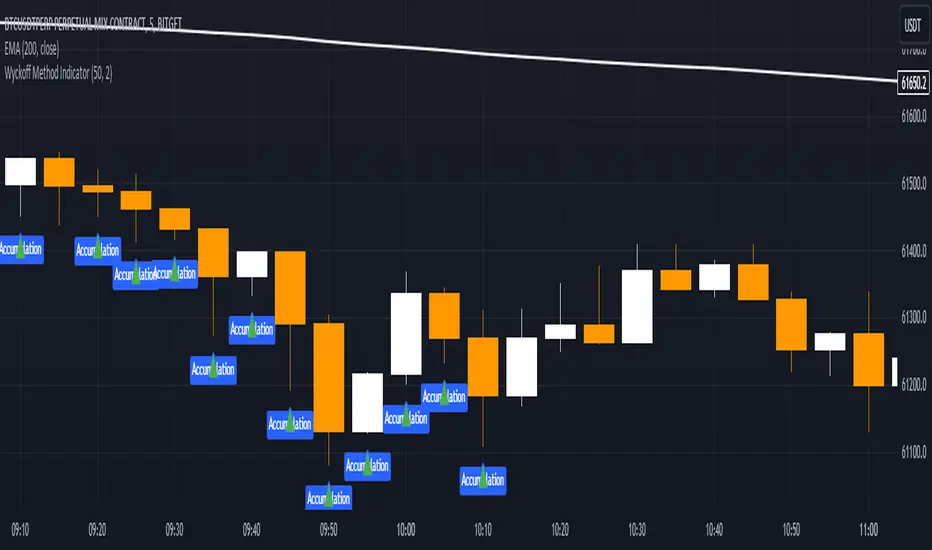
Wyckoff Method IndicatorThe Wyckoff Method Market Cycle Indicator is a powerful tool designed to help traders identify the current market phase based on the principles of the Wyckoff Method. This indicator analyzes price action and volume patterns to determine whether the market is in an accumulation, markup, distribution, or markdown phase.
The Wyckoff Method, developed by Richard D. Wyckoff, is a time-tested approach to understanding market dynamics and identifying potential trading opportunities. By studying the interaction between price and volume, the Wyckoff Method aims to provide insight into the actions of market participants and the potential direction of the market.
This indicator automatically detects the key market phases as defined by the Wyckoff Method:
Accumulation: This phase occurs when large institutional investors are quietly accumulating positions, often leading to a period of consolidation with low volatility and decreasing volume.
Markup: Following the accumulation phase, the markup phase is characterized by a breakout above the accumulation range, accompanied by increasing volume. This indicates a potential bullish trend.
Distribution: After a significant price advance, the distribution phase emerges. It is marked by high volatility and increasing volume as large investors begin to distribute their holdings to the public.
Markdown: The markdown phase follows the distribution phase and is characterized by a breakdown below the distribution range, accompanied by increasing volume. This suggests a potential bearish trend.
The indicator plots the detected market phases on the chart using the following signals:
Green triangle pointing upwards: Accumulation phase
Blue triangle pointing downwards: Markup phase
Red triangle pointing downwards: Distribution phase
Orange triangle pointing upwards: Markdown phase
By utilizing this indicator, traders can gain valuable insights into the underlying market structure and make more informed trading decisions. However, it is important to note that the Wyckoff Method Market Cycle Indicator should be used in conjunction with other technical analysis tools and risk management strategies.
The indicator provides two input parameters:
Lookback Period: The number of bars used to calculate the volatility and determine the market phases. The default value is 50.
Volume Condition Multiple: The multiple used to compare the current volume with the volume of the lookback period. The default value is 2.
Traders can adjust these parameters to suit their specific trading style and the characteristics of the asset being analyzed.
Please note that this indicator is intended for educational and informational purposes only. It does not constitute financial advice. Always conduct your own analysis and exercise proper risk management when trading.
Happy trading!
Daye Quarterly Theory ~ DQT [Liquidity_Pro]Thanks
This indicator puts the time-based research of trader Daye on your chart. Daye studied the ICT killzones and macro times and presented his findings, as “Quarterly Theory” on YouTube. Thank you Daye for sharing!
This indicator is not the first, so S/O to @toodegrees, @a1tmaniac and @joshuuu for their own excellent Quarterly Theory indicators. Last but not least, huge thanks go to ICT for his trading innovation and generous free price action education and to @twingall for his insight, attention to detail and great teamwork coding this indicator.
Daye’s Quarterly Theory
First, the fundamental concept is that all units of time can be divided by four into quarters -- just as we look at the year’s corporate reporting cycle of Q1, Q2, Q3, and Q4.
Dividing the day by four, into six hour quarters and again into 90 minute quarters and again into 22.5 minute ‘Micro’ quarters we reach the smallest unit shown by this indicator. Apply it to your NQ1! or ES1! charts and you may see remarkable confluence with the ICT macro times!
Why would we want to do this? It helps us understand, visualize and predict ICT’s PO3 concept:
• A - Accumulation (required for a cycle to occur)
• M - Manipulation
• D - Distribution
• X - Reversal/Continuation
The bottom line - we want to sell after a manipulation (M) up, or buy after a manipulation down and Quarterly Theory plots times on your chart where this may occur. Every asset is different, so back-test and research it.
Note, this indicator always shows Q1 as the accumulation quarter (by color), but the order is not fixed and instead of AMDX may appear as XAMD, where Q1 is the Reversal/Continuation quarter. We may eventually offer an update to this indicator which would automatically transpose the quarter colors for you.
The Quarters
Yearly:
• Q1 - Jan, Feb, Mar
• Q2 - Apr, May, Jun
• Q3 - Jul, Aug, Sep
• Q4 - Oct, Nov, Dec
Monthly (starts with the first month’s Monday regardless of the date):
• Q1 - Week 1, first Monday of the month
• Q2 - Week 2, second Monday of the month
• Q3 - Week 3, third Monday of the month
• Q4 - Week 4, fourth Monday of the month
Weekly (Daye ignores Friday and Sunday’s price action):
• Q1 - Mon
• Q2 - Tue
• Q3 - Wed
• Q4 - Thu
Daily (times are all EST / New York):
• Q1 - 18:00 - 00:00 Asia
• Q2 - 00:00 - 06:00 London
• Q3 - 06:00 - 12:00 NY AM
• Q4 - 12:00 - 18:00 NY PM
90 Minute:
• Q1 - 18:00 - 19:30
• Q2 - 19:30 - 21:00
• Q3 - 21:00 - 22:30
• Q4 - 22:30 - 00:00
Micro (22.5 minute quarters, DQT only displays Micros on 7 minute TF or lower)
• Q1 - 18:00 - 18:22:30
• Q2 - 18:22:30 - 18:45
• Q3 - 18:45 - 19:07:30
• Q4 - 19:07:30 - 19:30
About the DQT Indicator
This indicator plots the quarterly time boxes in a panel which can be placed above or below your chart. It allows you to add labels with the opening time and dates and also place time of day markers which can be useful for anyone who wants to mark lunch, and of the trading day or perhaps a favorite ICT macro time. It also works on GOLD (CAPITALCOM), DXY (TVC), currencies and stocks in Regular Trading Hour (RTH) mode.
Note the way that the indicator displays quarters is affected by the time frame you are viewing and as a result you may notice imperfections. Also, the indicator is not tuned to work with every broker, so for example with DXY, you will see the TVC feed is displayed nicely but other feeds are not.
Settings
The DQT indicator offers a great deal of flexibility to customize the display of quarters aesthetically. But it’s designed to work out-of-the-box on both light and dark background charts. It's set up to only show 90 minute and micro quarters initially, but in the settings, you can turn on the daily, weekly, monthly, and yearly quarters. Remember you will only see the Micros on the 7 minute TF or lower.
Lastly, the DQT indicator works well with our DOB indicator allowing you to visualize the confluence of high timeframe PDAs or POIs with manipulation quarters.
If you find our indicators useful, please boost, comment and share -- it's very motivational for us to develop them further and publish new ones!

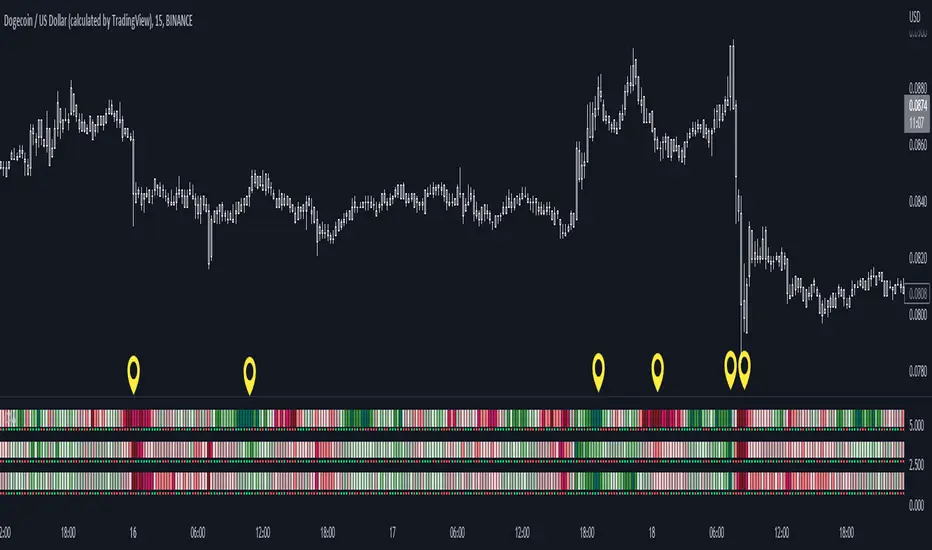
Color Agreement Aggregate (CAA)This indicator helps finding patterns within market structure in a highly intuitive manner.
It does this by painting a picture instead of presenting numerical values.
It greatly reduces noise in trend/structure analysis.
----- HOW TO USE IT -----
1) Zoom out of chart to get a clearer picture of overall color patterns.
2) Consider areas of intense reds and greens as areas of interest.
3) There is always a pattern of intense reds followed by intense greens. Consider this pattern as the start of a new cycle.
4) Key spikes and dips are shown when all 3 bands are matching of intense colors.
5) Turn on Precision in the Style tab to get more information on decisive spikes in price (See "Precision" below).
Reach (top band):
This is the fast and more volatile movement of the market. It shows the direction in which the recent price action is reaching towards.
Energy (middle band):
This is the medium speed of market movement. It shows the energy of the Reach and how influential it is to market change.
Frequent and intense change of color in this band can be a precursor of change within the Basis.
Basis (bottom band):
This is the slower, broader movement of the market. It is the basis on which the Reach and Energy sit on.
Intense colors in this band show major changes in price levels and market structure.
Precision:
Precision shows the weaker levels of colors. It does this by making bars in a band half its size.
For example, if there is a light green bar that is half, it means that the current bar is on the weaker level of the light green level.
Precision helps in identifying where there are influential moves in price action. Note, there will never be a half-sized bar in the highest and lowest levels.
This is because these levels are the limits and don't have a weaker half.
See notes in chart for more information. Note, you can turn off the labels in the Style tab.
----- HOW THIS INDICATOR IS ORIGINAL; WHAT IT DOES AND HOW IT DOES IT -----
This indicator has an original, unique ability to paint the overall market structure in a highly intuitive manner. It "paints" an image instead of showing numbers.
It does this by color-coding different levels of varying speeds of market movement. It then presents these levels as simple bars.
Finally, it stacks them all and creates an overall image of clear breaks and/or repeats within market structure.
This greatly reduces noise in pattern finding, finding breaks in market structure, and in confirming repeated patterns.
----- VERSION -----
The only significant information from this indicator are the colors themselves and the patterns, agreement, and aggregate of the colors.
This indicator does not provide any numerical information of the underlying, mathematical calculations.
The levels for the Reach are made by the KPAM; for the Energy, the CCI; and for the Basis, the RSI.
However, this indicator is not a variant, replacement, or presentation of the KPAM, CCI, or the RSI in any way, shape, or form -- this indicator does not present itself as such.
The 3 indicators are only useful to this indicator in as much as they are what the colors are derived from -- nothing more.
They are needed in order to obtain, visualize, and create the overall aggregate and agreement of colors.
Thus, the KPAM, CCI, and RSI cannot be adjust nor are they plotted. They are not, in any way, a focus of this indicator.
Financial Astrology Venus DeclinationVenus crossing zero declination towards the south direction until the minima is reached seems to produce that the price change slows down and calms the volatility. This also coincides with few small corrections in ETHUSD, looks that Venus moving from South to North declination path produce much more strong trends.
This Venus declination pattern needs more research in others markets, I have analysed BTCUSD and was not able to see any clear cycle with Venus declination, will be great to get the participation from more financial astrologers that could research this declination cycle in other markets and share feedback with us.
Note: The Venus declination indicator is based on an ephemeris array that covers years 2010 to 2030, prior or after this years the declination is not available, this daily ephemeris are based on UTC time so in order to align properly with the price bars times you should set UTC as your chart reference timezone.
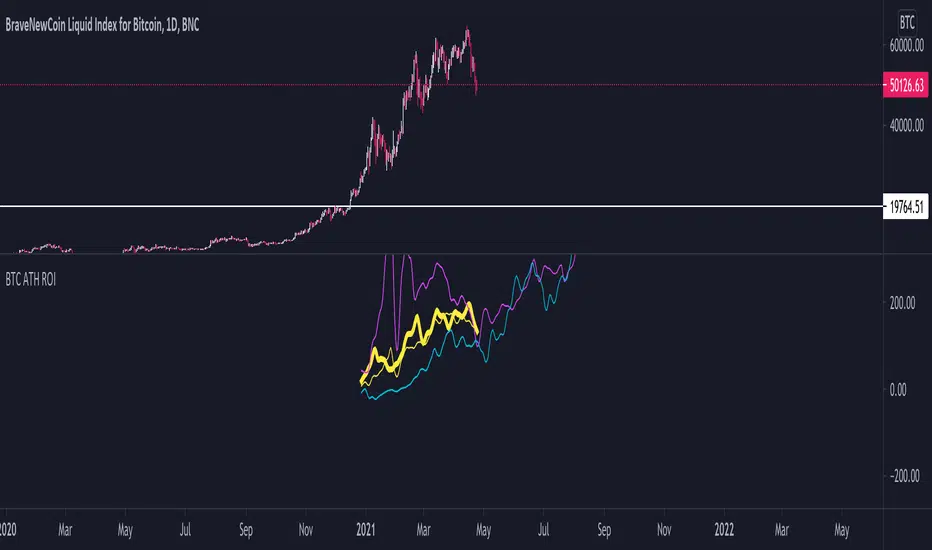
BTC ATH ROIThis indicator shows the ROI % of Bitcoin from when it passed its ATH of the previous bull cycle. I found it interesting that each time it crossed its ATH it took around 260-280 days to peak for each one. This bull run seems to follow between both of the previous bull runs including this recent dip.
There are a couple issues I want to fix but can't figure out:
1. You need to completely scroll out and move towards 2013 on the Daily chart for all 3 lines to show up. Would be nice to load all of that data at the start.
2. I can't query the value of the plots after they have been offset. This would be useful to create a prediction bias for the current plot so would could see where btc might go.
If you peeps know of a way to load all data or query plot values after offsets, please share. That would be awesome.
OFA - Order Flow AnalysisThe script analyzes order flow based on fractal structure breaks. Every time there is a fractal breakout in the opposite direction of the dominant side in control a new leg ( bullish or bearish ) forms. This script comes with the added value of displaying the velocity and the magnitude of each leg/cycle.
Order flow leaves a trail of the future market intentions via the ability or lack thereof of the aggregated flow to keep consuming liquidity provided by market makers and find or not equilibrium in price. The proper reading of order flow can provide information advantage. Flows can be read via two main venues:
1 - Magnitude: A major clue that will help determine the health of a trend is the type of progress by the dominant side in control of the trend. We need to ask the following question: Are the new legs in the active buy-sell side campaign as identified by the script increasing or decreasing in magnitude?
2. Velocity: When it comes to the distance the price moves, the magnitude is only ½ the equation. The other ½ has to do with the velocity of the move or the speed. Was the new leg created after a fast and impulsive move? Or did price make a new low or high with the movement being sluggish, compressive and taking too long to form? A good rule of thumb is to count the number of candles it took to achieve a new leg.

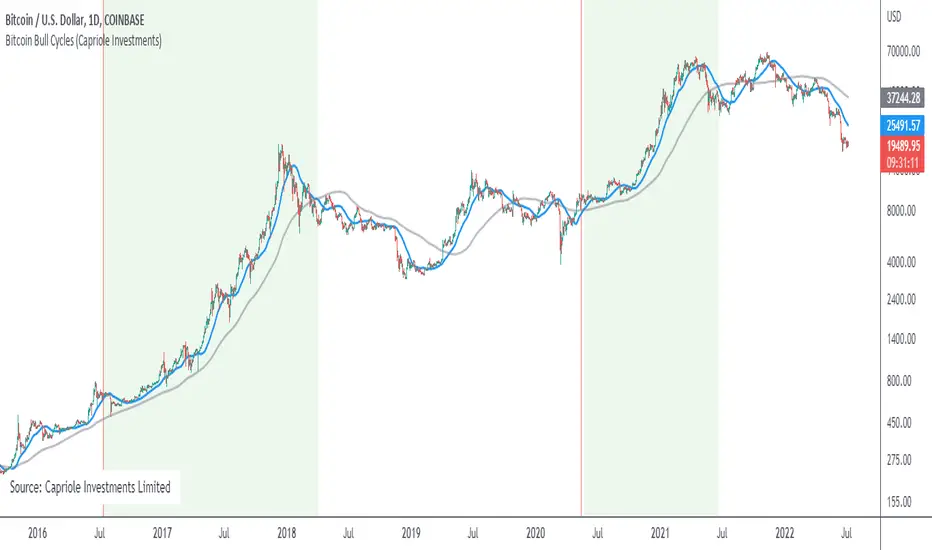
Bitcoin Bull CyclesA simple indicator that identifies the primary upswing of Bitcoin following each Halving, the "Bull Cycle".
A "Bull Cycle" is identified as the first period of positive momentum after each Halving date, defined as the 50 Daily Moving Average (DMA) being above the 200 DMA.
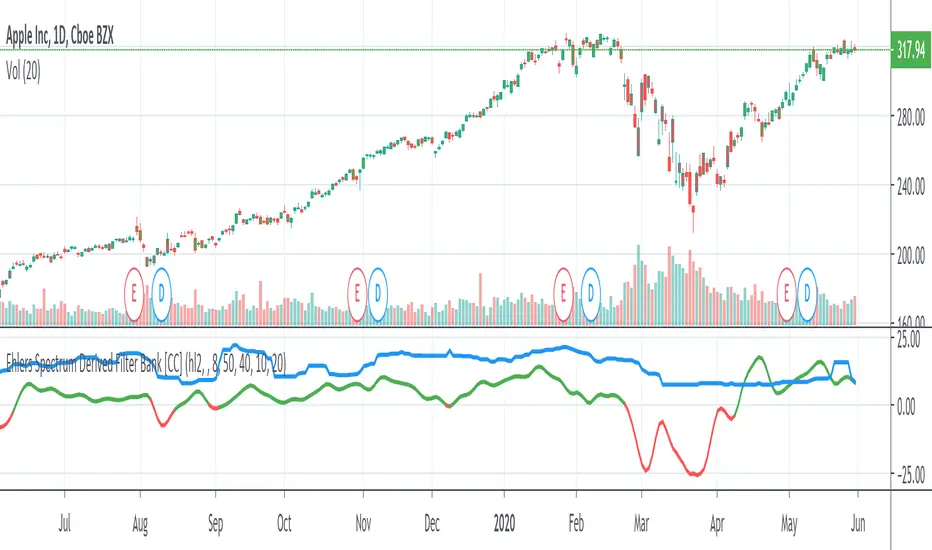
Ehlers Spectrum Derived Filter Bank [CC]The Spectrum Derived Filter Bank was created by John Ehlers (Stocks & Commodities V. 26:3 (16-22)) and this is technically two indicators in one. This will let you know the current cycle period which is in blue and the other indicator will let you know if you should buy the stock or not. Buy when it is green and sell when it is red.
Let me know if you would like me to publish other scripts or if you want something custom done!
Note: I'm republishing this because the original script couldn't be found in searches so this will fix that.
Schaff Trend CycleWhat is STC?
This is an open source indicator but I added a few improvements to its code and a more friendly UI.
The STC indicator is a forward-looking, leading indicator, that generates faster, more accurate signals than earlier indicators, such as the MACD because it considers both time (cycles) and moving averages. Like any chart indicator, the tool is best used with other forms of analysis and its performance will surely vary as market conditions change.
Know more about STC here: Investopedia .
How to Read STC :
1. Main use
--look if momentum is bullish or bearish
--Bullish = Above 75
--Bearish = Below 25
--Neutral = negligible movement inside here
2. If flat at extremes (100 and 0), it means that the momentum is strong
3. Pivots
--To show if there’s a shift of momentum
Access and Documentation:
Message or PM me to know how to get access.

Ehler Stochastic Cyber Cycle Signals/AlertsThis script works based on @everget's version of Ehler Stochastic Cyber Cycle. Unlike @everget's work, my adaptation prints only crossovers into the chart that occur above or below the overbought/oversold zone.
You can find @everget's script with all related documentation here
I didn't change the calculation, I only reinvented how it is presented on the chart and added alerts.
