unRekt - The MachineThis is a combined script of Welcome to the Machine and Kiss Cross. A moving average crossover was added with the golden cross '50 n 200' being most noticeable.
Up to 5 editable moving averages can be selected on their own or all displayed with varying type of your choice SMA, EMA, WMA, VWMA and LSMA.
Bollinger bands can be disabled to just show the moving average.
Image of bollinger bands off:
Cerca negli script per "GOLD"

Moving Averages CrossThis Indicator helps you spot crosses between moving averages.
Thought to combine short term and long term strategies.
A complementary element for your trading tool belt.
The First study (short term):
Helps you visualise the relation between two simple moving averages (9,21) by default.
The Second study (long term):
Helps you identify the relation between three simple moving averages (50,100, 200) by default.
Spot Golden Crosses and Death Crosses from far.

FUSIONGAPS V5Market bullish/bearish phase indicator , with trend-reversal and golden/death cross indicators.
This the re-implementation of my old script, now allowing the selection between different moving-averaging modes.
Note: In no way is this intended as a financial/investment/trading advice. You are responsible for your own investment decisions and/or trades.
~ JuniAiko
(=^~^=)v~

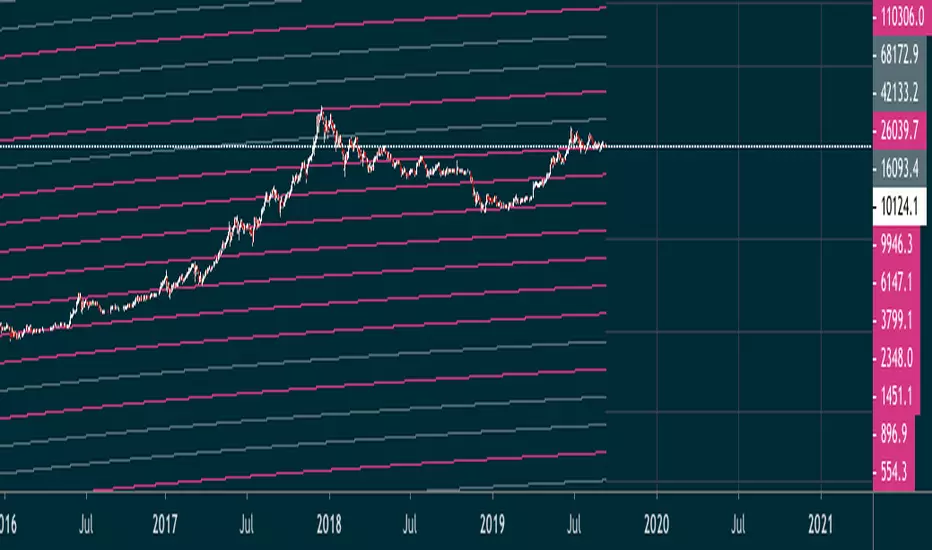
LIB: Golden Ratio MultiplierIndicator Overview
The Golden Ratio Multiplier explores Bitcoin's adoption curve and market cycles to understand how price may behave on medium to long term time frames.
To do this it uses multiples of the 350 day moving average (350DMA) of Bitcoin's price to identify areas of potential resistance to price movements. Note: multiples are of the 350DMA's price values rather than its number of days.
The multiples reference the Golden Ratio (1.6) and the Fibonacci sequence (0, 1, 1, 2, 3, 5, 8, 13, 21). These are important mathematical numbers.
These specific multiplications of the 350DMA have been very effective over time at picking out intracycle highs for Bitcoin price and also the major market cycle highs.
As Bitcoin becomes adopted over time, it's market cycle highs hit decreasing Fibonacci sequence multiples of the 350DMA. This is because the explosive growth of Bitcoin on a logarithmic scale is slowing over time. As it's market cap increases it becomes more difficult for the same growth rates to continue.
If this decreasing Fibonacci sequence pattern continues to play out as it has done over the course of the past 9 years, then the next market cycle high will be when price is in the area of the 350DMA x3.
The Golden Ratio Multiplier is an effective tool because it is able to demonstrate when the market is likely overstretched within the context of Bitcoin's adoption curve growth and market cycles.

Bollinger Band Strategy (Basic) Version 1 This strategy is for learning purposes only. Pay special attention to these strategies on longer aggregation periods (like 1 hr chart or more). Don't expect accurate results when you set a limit to 10 cents above your entry to be accurate. For example if you set the chart to 1 day, the price may move down and hit a stop 10 times then tag your limit. If this doesn't make sense, just don't use strategies here. Learn more first. That being said, I don't have specific recommendations for each aggregation period, backtesting isn't always perfect.
Now then, this strategy can be used as the traditional BB method by setting the "Stop" and "Limit Out" to like 10000, check "Reversal Entry" and uncheck "Limit Time of Day" This will keep the strategy running just reverse your position when price crosses outside each band.
INPUTS:
Length - length of WMA that I used for mean of Bollinger Band (this may suppose to be SMA, too bad)
Source - O-H-L-C basis for WMA
Deviation - normal Standard deviation that would be set when using Bollinger Band
Trailing stop check box - your stop value will be either a hard stop or trailing stop for an exit
Stop - the stop value - remember you can set this really high and it won't stop out
Limit Out - the limit value for exit
Reversal Entry check box - This changes each entry from a reversal (traditional idea of BB) to enter a trend trade - hopefully version 2 will have choice to trend one direction and reversal in the other.
Limit Time of Day - Especially when trading futures, you may want to only trade a specific time of day, when this box is checked, you can set the entry times below, exit will still only occur based on limit/stop or a flip entry order (the opposite entry condition is met)
Tips:
when I don't know a thing about a price range, like gold. I can set the limit out to 10000 and play with a trailing stop to get a better idea of what is even possible before tuning further.

Bitcoin Golden Ratio Multiplier FibonacciA Script based on the wonderful article by Philip Swift (@PositiveCrypto) "The Golden Ratio Multiplier - Unlocking the mathematically organic nature of Bitcoin adoption"
Please read article for understanding use.
Best used on Daily

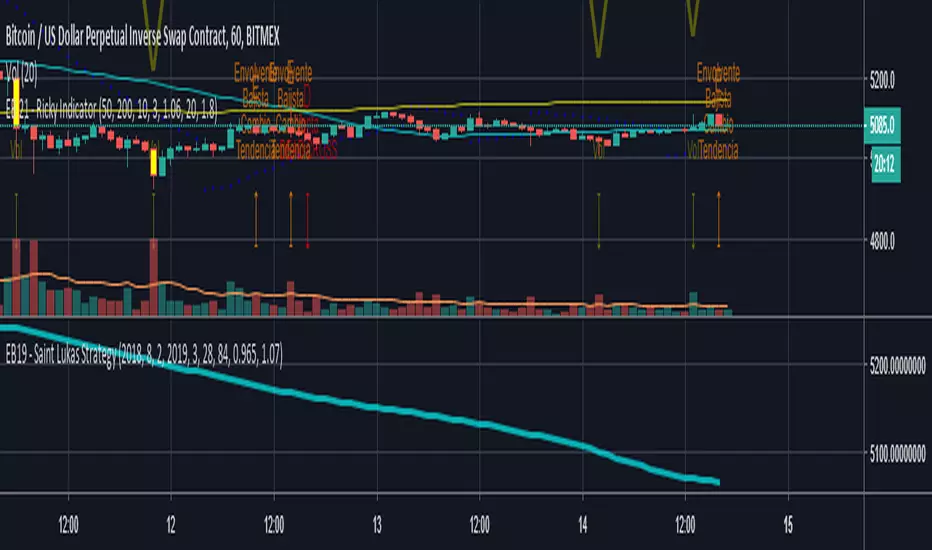
EB 21 - Ricky IndicatorIndicates multiple signals:
SAR
2 SMA
MAST Detector
Bullish Engulfing
Bear Engulfing
Gold and Dead Cross
Volume Increment
Gold24fx IndicatorGold24fx
Class : hybrid – trend oscillator
Trading type : scalping
Time frame : 5 min
Purpose : detection of optimal buy entry points
Level of aggressiveness : high
Indicator « Gold24fx » was developed for scalping trading in Gold market. It can be used to define optimal buy entry points when the bullish sentiments prevail.
Indicator « Gold24fx » is based on unique author algorithm. It allows to provide quantitative assessments of current market sentiments as well as to visualize them. Also «Gold24fx» can detect divergences between current market price and fair value of the Gold for a specific moment of time. Local undervaluation of the Gold is a reason to generate a buy signal in situation when market is controlled by the bulls.
Thus Indicator «Gold24fx» provides sufficient data to the trader for the successful trading in the Gold market.
Structure of the indicator
Indicator consists of the following elements:
- Market sentiments curve – is presented with 3 color gammas: blue color (bullish sentiments are dominating), red color (bearish sentiments are dominating), green color (flat is present in the market),
- Red cross on the curve – a signal in favor of contraindications for buy trades. Can be related with bearish sentiments in the market or local overbought of the Gold;
- Green triangle on the curve – is a buy signal for short term Gold trades. It appears when the bullish market sentiments are prevail and asset is temporarily undervalued.
Rules of trading
Rules of trading are very simple. Blue color of the curve evidences in favor of bullish market sentiments. When the buy signal appears (green triangle on the curve) long position in Gold should be opened.


DEMA Crossover Strategy_01_SARThis is used to do trade based on golden cross and death cross. It uses SAR.

Kringold2[WOZDUX] gold equivalentThe indicator is a tool for global analysis. The default is the price of gold. The price of the instrument from the main window is divided by the price of gold. The result is the price of the instrument in units of gold. The screen uses the Dow Jones index as an example. In the indicator window, the price of the index in units of gold or the so-called gold Dow Jones. The use of the gold equivalent makes it possible to see more truthful trends. The Indicator has the ability to change gold to any other equivalent. It is enough to change the name of the exchange and the name of the instrument in the options tool and exchange. In addition, in the settings, the second box on top allows you to view the graph in a linear or logarithmic scale. The first box at the top switches the line chart or the CCI =WT indicator to this chart.
-------------------------------------------
Индикатор это инструмент для глобального анализа. По умолчанию используется цена золота. Цена инструмента из основного окна делится на цену золота. В результате получается цена инструмента в единицах золота. На экране для примера используется индекс Доу джонса. В окне индикатора цена индекса в единицах золота или так называемый золотой Доу Джонс. Использование золотого эквивалента дает возможность видеть более правдивые тенденции движения. В Индикаторе есть возможность поменять золото на любой другой эквивалент. Достаточно в опциях инструмент и биржа изменить название биржи и название инструмента. Кроме того, в настройках, второй бокс сверху дает возможность смотреть график в линейном или логарифмическом масштабе. Первый бокс сверу переключает линейный график или индикатор CCI =WT к данному графику.

Profit Maximizer 90%-95% IntraDayTrade Strategy WithTester Developed for Intraday and for very very Lesser Time Frame Trading. Note: Invite only Script .Request to me Access permission to test this.
Strategy tester enabled .All you can test this in live market in any segment.
Lesser the time frame greater the success rates as the test results.
This can be used : Crypto Currency/Bitcoins ,Forex,currencies ,Index ,Commodity Gold/silver ,Oil Market and in Equity /Futures
It will work for BINARY OPTION ,BINARY DIGITAL to enter and hold the position in right direction, User test it and confirm .
How to Use:
Three Main Zone BackGrounds: 1. Green Zone 2. LightRed Zone 3. Yellow Zone
1.Long only when Bar Color changed from Red or Black to BLUE and BackGround in Green, Hold the position until opposite color comes.
2.Short when BAR become Black and BackGround Red Exit when opposite color come.
3.Yellow Back Ground : Risk Trade Zone : When Red BARs Cautious Short , Yellow Zone LightGreen Bars (Avoid Trade) .In Yellow Zone Close the previous Entered postions.
Time Frame : Lesser Time Frame and holding for longer time will give Good Result . 1min-1Hrs . This will not work >1Hr Strategy and Candle will disappear >1hr TimeFrame.
Strategy Tester : Choose any Date Month Year to Current Date and check the results below in the Strategy Tester.
REPAINT/NO REPAINT : No Repaint ,Previous candles and Background Color wont change. In the current candle position wait for the candle to close to see the stability.Current candle color might oscillate bit However it will not change from Blue to Black or Black to Blue or Black to Red.
Note : Last Bar will be a actual Green or Red Bar by Default Do not Confuse with this.It is trading view default strategy design working way.Once Bar closes actual strategy color will appear.
ALERT /AUTOVIEW capabilities : Strategy Tester does not support ALERT by default as you all know.In the Indicator version Alert will be added for all Buy Sell and cover entries.
Test the strategy.
SCRIPT : Access must be given by me to test this .Once access given you can test ,Request for access .Without access Study Not Auth error will come.
Review and Feedback.Thank you!
Refer the Release notes for any updates and my posts below and in my idea page for more details. Thank you!
Any issues report to me to Fix.Thank you!

Cyatophilum Golden X - RSI [INDICATOR] [ALERT SETUP]This indicator is a custom combo of Ema crosses, RSI divergences and Support/resistance, designed to make the most profit possible.
It is a pretty solid indicator for trading BTC in 4H.
There are two kind of buy signals : Green and Blue triangles, that are two great Buy/Long entries.
There are also two kind of sell signals: Red and Orange triangles, that are two great Sell/Short entries.
The indicator comes with automatic Alerts that trigger on Green and Blue triangles for a Buy Alert, or that trigger on Red and Orange triangles for a Sell Alert.
If you are interested in purchasing the indicator and want to try it, then please leave a comment.
A strategy version should follow on my profile soon.
-----------------------------------------------------------------------------------------
I am also available for PineScript Development and Reverse Engineering.
Join my discord:
discord.gg

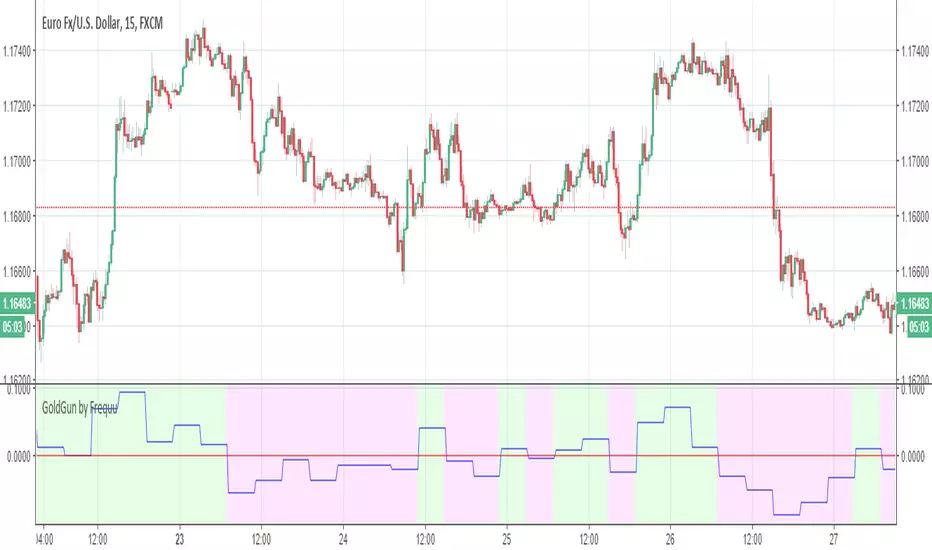
GoldGun by Frequu
Hi, I would like to present you the best script for manual / automatic trading
NO REPAINT
ALERT FIX
ALERT NO DOUBLE!
- ALL PAIR STOX (over 90%)
- GOLD (80-85%)
- and more more more ..
Script i`m testing on 1BROKER, binance and pepperstone, working brilliant !
Bottom finder v8_visBottom finder script with adjustable RSI, found bottom prices for EOS and SNGLS. Works on most crypto coins. Generally price goes up after the blue spike indicator signal the bottom has reached. If you want to try it out, message me in comment section below. Bottom finder versions for gold, forex, stocks also available.

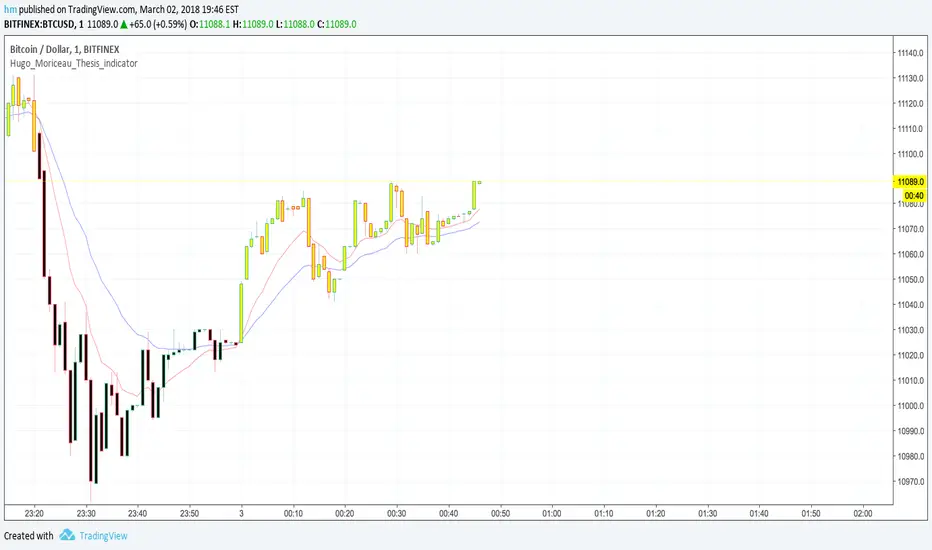
min_Crypto_Thesis_indicator_MoriceauThis indicator is for minute candlestick and this back test work perfectly with Bitcoin and Gold.
The indicator tells you when you need to buy and sell your position. The backtest work at 86% of the last year.

Macd_Reader_Signal_Moriceau_Thesis_indicatorThe idea is to create a MACD "Reader" that can tell you when you should buy (yellow candle sticks) and when to Sell (black one) you have also strong signal of with B and S write on graphic automatically. This indicator is set and back tested with BTCUSD and Gold. I used also for french equities and it works really good.
Let me know if you want any change or have comments.
Hugo Moriceau
Fractal Regression Bands [DW]This study is an experimental regression curve built around fractal and ATR calculations.
First, Williams Fractals are calculated, and used as anchoring points.
Next, high anchor points are connected to negative sloping lines, and low anchor points to positive sloping lines. The slope is a specified percentage of the current ATR over the sampling period.
The median between the positive and negative sloping lines is then calculated, then the best fit line (linear regression) of the median is calculated to generate the basis line.
Lastly, a Golden Mean ATR is taken of price over the sampling period and multiplied by 1/2, 1, 2, and 3. The results are added and subtracted from the basis line to generate the bands.
Williams Fractals are included in the plots. The color scheme indicated whether each fractal is engulfing or non-engulfing.
Custom bar color scheme is included.

MGQ EMA GOLD PARIS Indicator MGQ EMA GOLD PARIS Indicator is a discretionary trend-following indicator designed for XAUUSD, optimized for the M15 timeframe.
It uses EMA (9, 21, 200) structure with RSI confirmation to identify high-probability BUY and SELL zones during the London and New York sessions (Paris time).
The indicator provides clear visual guidance including BUY/SELL icons and optional SL, TP1, TP2, TP3, and Break-Even (BE) guide levels based on R-multiple logic.
This indicator is intended for manual trade execution and risk-managed trading.
No financial advice. Use proper risk management.

KORVEX TRADING - GOLDKORVEX Keylevel Must-Move Trading is a precise approach focused on identifying Must-Move-Levels to generate high-quality trades at clearly defined Keylevels. The strategy targets reversals and pullbacks at prominent Keylevels, resulting in a high hit rate with fewer, but highly qualitative signals.
Core Idea & Market Logic
KORVEX is not a classic continuous-signal indicator, but a targeted Must-Move finder for GOLD, DAX, S&P500, and EURUSD.
The strategy aims to trade reversals and pullbacks at clearly identifiable Keylevels (Daily High/Low, Previous High/Low, Daily Pivot, relevant Fibonacci zones such as 0.5, 0.618, 0.786).
Trading primarily takes place on the M15 timeframe, optionally also on M30 or H1, to find the best combination of signal quality and trading time.
Advantages of the Strategy
Fewer, but high-quality trades instead of continuous trading, which strengthens discipline and focus.
The use of clear Keylevels increases the probability of sustainable moves and reduces the risk of erroneous trades.
Combining technical levels with Fibonacci zones provides an objective decision basis and prevents subjective interpretations.
This approach creates a clear market logic based on quality and precise entries – ideal for traders aiming for sustainable results with fewer, but targeted trades.
