Gold & EUR/USD LTF liquidity Sweep + Market structure shift on a lower time frame for sniper entries
Cerca negli script per "GOLD"

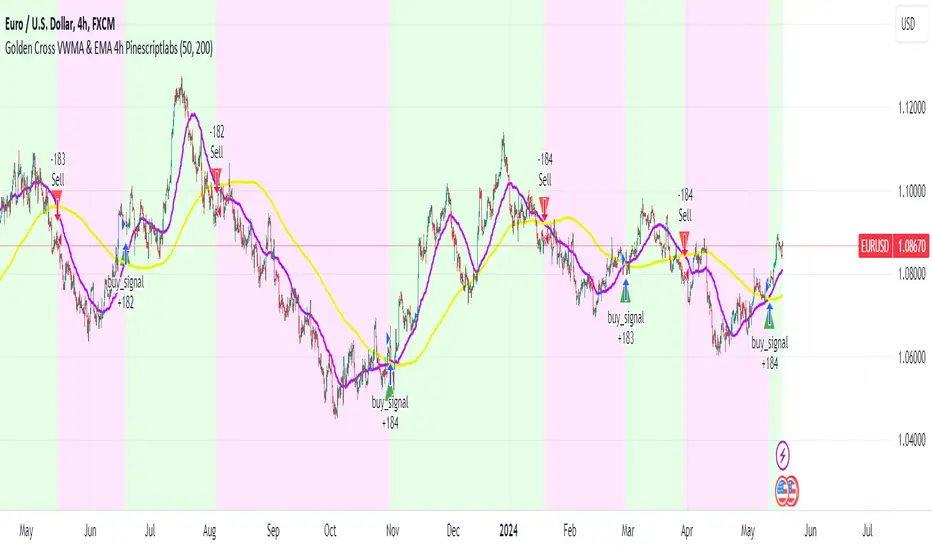
Golden Cross VWMA & EMA 4h PinescriptlabsThis strategy combines the 50-period Volume-Weighted Moving Average (VWMA) on the current timeframe with a 200-period Simple Moving Average (SMA) on the 4-hour timeframe. This combination of indicators with different characteristics and time horizons aims to identify strong and sustained trends across multiple timeframes.
The VWMA is a variant of the moving average that assigns greater weight to periods of higher volatility, helping to avoid misleading signals. On the other hand, the 4-hour SMA is used as an additional trend filter in a shorter-term horizon. By combining these two indicators, the strategy can leverage the strength of the VWMA to capture the main trend, but only when confirmed by the SMA in the lower timeframe.
Buy signals are generated when the VWMA crosses above the 4-hour SMA, indicating a potential bullish trend aligned in both timeframes. Sell signals occur on a bearish cross, suggesting a possible reversal of the main trend.
The default parameters are a 50-period VWMA and a 200-period 4-hour SMA. It is recommended to adjust these lengths according to the traded instrument and the desired timeframe. It is also crucial to use stop losses and profit targets to properly manage risk.
By combining indicators of different types and timeframes, this strategy aims to provide a more comprehensive view of trend strength.
Español:
Esta estrategia combina la Volume-Weighted Moving Average (VWMA) de 50 períodos en el timeframe actual con una Simple Moving Average (SMA) de 200 períodos en el timeframe de 4 horas. Esta combinación de indicadores de distinta naturaleza y horizontes temporales busca identificar tendencias fuertes y sostenidas en múltiples timeframes.
La VWMA es una variante de la media móvil que asigna mayor ponderación a los períodos de mayor volatilidad, lo que ayuda a evitar señales engañosas. Por otro lado, la SMA de 4 horas se utiliza como un filtro adicional de tendencia en un horizonte de corto plazo. Al combinar estos dos indicadores, la estrategia puede aprovechar la fortaleza de la VWMA para capturar la tendencia principal, pero sólo cuando es confirmada por la SMA en el timeframe menor.
Las señales de compra se generan cuando la VWMA cruza al alza la SMA de 4 horas, indicando una potencial tendencia alcista alineada en ambos horizontes temporales. Las señales de venta ocurren en el cruce bajista, sugiriendo una posible reversión de la tendencia principal.
Los parámetros predeterminados son: VWMA de 50 períodos y SMA de 4 horas de 200 períodos. Se recomienda ajustar estas longitudes según el instrumento operado y el horizonte temporal deseado. También es crucial utilizar stops y objetivos de ganancias para controlar adecuadamente el riesgo.
Al combinar indicadores de diferentes tipos y timeframes, esta estrategia busca brindar una visión más completa de la fuerza de la tendencia.
Golden Swing Strategy - Souradeep DeyThis strategy is developed by Mr. Souradeep Dey. Strategy is based on RSI, Stoch, BB & Supertrend.
Coding by Rajkumar

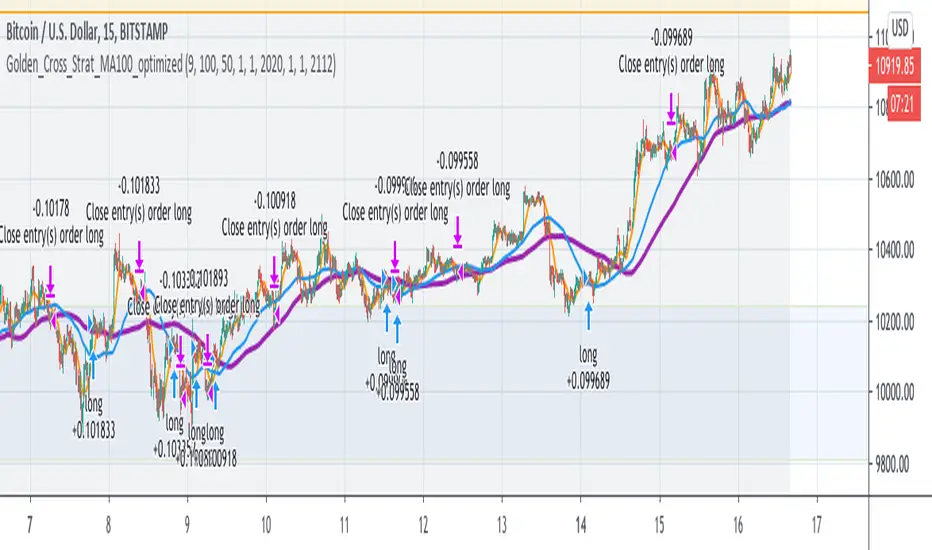
Golden Cross Optimised For Reversal (by Coinrule)A moving average crossing is a common and widely adopted trading strategy. A short-term MA crossing above a long-term one provides the buy-signal. The opposite generates a sell-signal for the strategy.
Although very popular, this strategy has some limitations that lead to frequent "false signals" and only a few very profitable trades. If the strategy provides two many trades, that generates
the risk for more potential losses
more transaction fees paid
capital allocated to the strategy, thus the impossibility of catching other potential opportunities.
Applying an additional filter to the strategy, consisting of the crossing happening below a longer-term moving average, allows increasing the chances of catching the first crossing signaling a reversal.
The indicator is set to work with three moving averages.
Buy signal: The MA(9) to cross above the MA(50), which must be below the MA(100)
Sell Signal: The MA(9) to cross below the MA(50)
This indicator works significantly better on lower time frames, where it can reduce the noise of getting too many non-profitable signals from a conventional crossing strategy.
The indicator has been backtested mostly on cryptocurrencies.
GoldFinger .007Goldfinger.
He's the man, the man with the midas touch.
A spider's touch.
Such a cold finger.
Beckons you to enter his web of sin
But don't go in.

SuperTrade ST1 StrategyOverview
The SuperTrade ST1 Strategy is a long-only trend-following strategy that combines a Supertrend indicator with a 200-period EMA filter to isolate high-probability bullish trade setups. It is designed to operate in trending markets, using volatility-based exits with a strict 1:4 Risk-to-Reward (R:R) ratio, meaning that each trade targets a profit 4× the size of its predefined risk.
This strategy is ideal for traders looking to align with medium- to long-term trends, while maintaining disciplined risk control and minimal trade frequency.
How It Works
This strategy leverages three key components:
Supertrend Indicator
A trend-following indicator based on Average True Range (ATR).
Identifies bullish/bearish trend direction by plotting a trailing stop line that moves with price volatility.
200-period Exponential Moving Average (EMA) Filter
Trades are only taken when the price is above the EMA, ensuring participation only during confirmed uptrends.
Helps filter out counter-trend entries during market pullbacks or ranges.
ATR-Based Stop Loss and Take Profit
Each trade uses the ATR to calculate volatility-adjusted exit levels.
Stop Loss: 1× ATR below entry.
Take Profit: 4× ATR above entry (1:4 R:R).
This asymmetry ensures that even with a lower win rate, the strategy can remain profitable.
Entry Conditions
A long trade is triggered when:
Supertrend flips from bearish to bullish (trend reversal).
Price closes above the Supertrend line.
Price is above the 200 EMA (bullish market bias).
Exit Logic
Once a long position is entered:
Stop loss is set 1 ATR below entry.
Take profit is set 4 ATR above entry.
The strategy automatically exits the position on either target.
Backtest Settings
This strategy is configured for realistic backtesting, including:
$10,000 account size
2% equity risk per trade
0.1% commission
1 tick slippage
These settings aim to simulate real-world conditions and avoid overly optimistic results.
How to Use
Apply the script to any timeframe, though higher timeframes (1H, 4H, Daily) often yield more reliable signals.
Works best in clearly trending markets (especially in crypto, stocks, indices).
Can be paired with alerts for live trading or analysis.
Important Notes
This version is long-only by design. No short positions are executed.
Ideal for swing traders or position traders seeking asymmetric returns.
Users can modify the ATR period, Supertrend factor, or EMA filter length based on asset behavior.

Jimb0ws Strategy Trending Info PanelsJimb0ws Strategy — Golden Candles + Bubble Zones
A price-action/EMA strategy built for FX scalping and intraday swings. It colors Golden Candles when strong bodies touch/skim EMA20/50 in trend (“bubble”) and optionally highlights Robin Candles (break of the prior golden body). Signals are throttled per bubble and filtered by multiple higher-timeframe conditions.
How it trades
Trend bubbles: Uses EMA20/50/100/200 alignment on the chart timeframe; also reads 1H & 4H bubbles for context.
Entries: BUY/SELL labels appear only when a golden setup aligns with fractal/structure checks and all active filters pass.
Stops/Targets (strategy mode):
• Longs: SL = EMA100 if EMA200 > EMA100, else SL = EMA200.
• Shorts: SL = EMA100 if EMA200 < EMA100, else SL = EMA200.
• TP = RR × risk (default 2R).
An on-chart SL/TP info label prints the exact prices at each signal.
Risk filter options: disable beyond 1H EMA50, proximity band around 1H EMA50, wick overdrive veto, session filter (toggle on/off), max signals per bubble.
Visuals & tools
Colored EMAs (20/50/100/200), bubble zone background.
4H info panel (state, start time, duration); Prev-Day ATR panel sits above it.
Optional 1H info panel and consolidation warning.
Fractal markers (size selectable).
Alerts
1H bubble state change (Long/Short/Consolidation).
BUY/SELL signals.
Inputs worth checking
Session & timezone, min body size, pip tolerances, proximity/WOD filters, max signals per bubble, RR, SL/TP label offset.
Notes
Best on FX pairs; pip = mintick × 10. Backtest and adjust to your instrument and session. This is not financial advice.

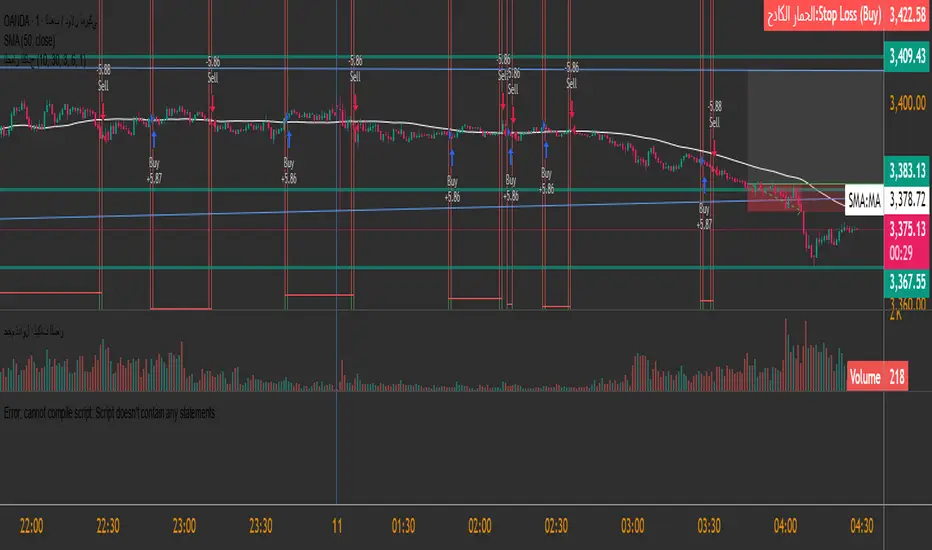
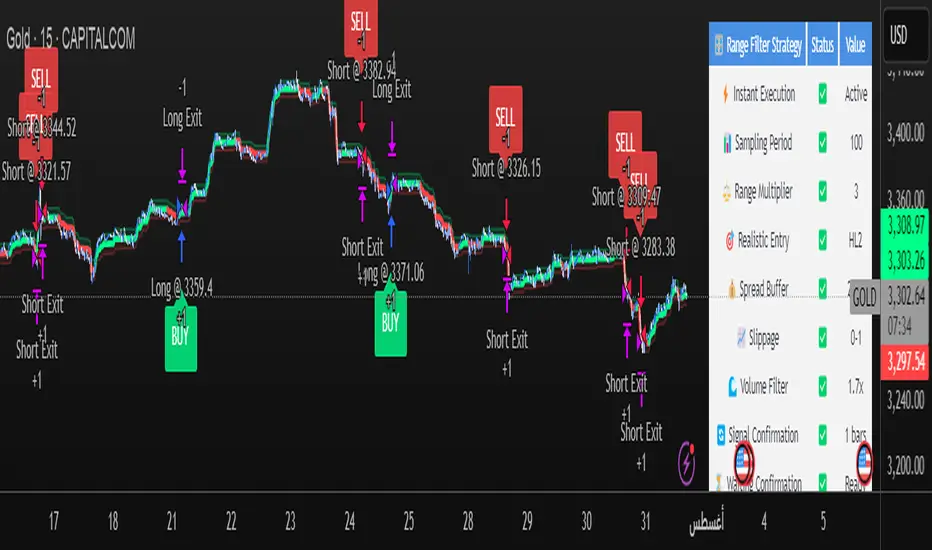
Range Filter Strategy [Real Backtest]Range Filter Strategy - Real Backtesting
# Overview
Advanced Range Filter strategy designed for realistic backtesting with precise execution timing and comprehensive risk management. Built specifically for cryptocurrency markets with customizable parameters for different assets and timeframes.
Core Algorithm
Range Filter Technology:
- Smooth Average Range calculation using dual EMA filtering
- Dynamic range-based price filtering to identify trend direction
- Anti-noise filtering system to reduce false signals
- Directional momentum tracking with upward/downward counters
Key Features
Real-Time Execution (No Delay)
- Process orders on tick: Immediate execution without waiting for bar close
- Bar magnifier integration for intrabar precision
- Calculate on every tick for maximum responsiveness
- Standard OHLC bypass for enhanced accuracy
Realistic Price Simulation
- HL2 entry pricing (High+Low)/2 for realistic fills
- Configurable spread buffer simulation
- Random slippage generation (0 to max slippage)
- Market liquidity validation before entry
Advanced Signal Filtering
- Volume-based filtering with customizable ratio
- Optional signal confirmation system (1-3 bars)
- Anti-repetition logic to prevent duplicate signals
- Daily trade limit controls
Risk Management
- Fixed Risk:Reward ratios with precise point calculation
- Automatic stop loss and take profit execution
- Position size management
- Maximum daily trades limitation
Alert System
- Real-time alerts synchronized with strategy execution
- Multiple alert types: Setup, Entry, Exit, Status
- Customizable message formatting with price/time inclusion
- TradingView alert panel integration
Default Parameters
Optimized for BTC 5-minute charts:
- Sampling Period: 100
- Range Multiplier: 3.0
- Risk: 50 points
- Reward: 100 points (1:2 R:R)
- Spread Buffer: 2.0 points
- Max Slippage: 1.0 points
Signal Logic
Long Entry Conditions:
- Price above Range Filter line
- Upward momentum confirmed
- Volume requirements met (if enabled)
- Confirmation period completed (if enabled)
- Daily trade limit not exceeded
Short Entry Conditions:
- Price below Range Filter line
- Downward momentum confirmed
- Volume requirements met (if enabled)
- Confirmation period completed (if enabled)
- Daily trade limit not exceeded
Visual Elements
- Range Filter line with directional coloring
- Upper and lower target bands
- Entry signal markers
- Risk/Reward ratio boxes
- Real-time settings dashboard
Customization Options
Market Adaptation:
- Adjust Sampling Period for different timeframes
- Modify Range Multiplier for various volatility levels
- Configure spread/slippage for different brokers
- Set appropriate R:R ratios for trading style
Filtering Controls:
- Enable/disable volume filtering
- Adjust confirmation requirements
- Set daily trade limits
- Customize alert preferences
Performance Features
- Realistic backtesting results aligned with live trading
- Elimination of look-ahead bias
- Proper order execution simulation
- Comprehensive trade statistics
Alert Configuration
Alert Types Available:
- Entry signals with complete trade information
- Setup alerts for early preparation
- Exit notifications for position management
- Filter direction changes for market context
Message Format:
Symbol - Action | Price: XX.XX | Stop: XX.XX | Target: XX.XX | Time: HH:MM
Usage Recommendations
Optimal Settings:
- Bitcoin/Major Crypto: Default parameters
- Forex: Reduce sampling period to 50-70, multiplier to 2.0-2.5
- Stocks: Reduce sampling period to 30-50, multiplier to 1.0-1.8
- Gold: Sampling period 60-80, multiplier 1.5-2.0
TradingView Configuration:
- Recalculate: "On every tick"
- Orders: "Use bar magnifier"
- Data: Real-time feed recommended
Risk Disclaimer
This strategy is designed for educational and analytical purposes. Past performance does not guarantee future results. Always test thoroughly on paper trading before live implementation. Consider market conditions, broker execution, and personal risk tolerance when using any automated trading system.
Best Settings Found for Gold 15-Minute Timeframe
After extensive testing and optimization, these are the most effective settings I've discovered for trading Gold (XAUUSD) on the 15-minute timeframe:
Core Filter Settings:
Sampling Period: 100
Range Multiplier: 3.0
Professional Execution Engine:
Realistic Entry: Enabled (HL2)
Spread Buffer: 2 points
Dynamic Slippage: Enabled with max 1 point
Volume Filter: Enabled at 1.7x ratio
Signal Confirmation: Enabled with 1 bar confirmation
Risk Management:
Stop Loss: 50 points
Take Profit: 100 points (2:1 Risk-Reward)
Max Trades Per Day: 5
These settings provide an excellent balance between signal accuracy and realistic market execution. The volume filter at 1.7x ensures we only trade during periods of sufficient market activity, while the 1-bar confirmation helps filter out false signals. The spread buffer and slippage settings account for real trading costs, making backtest results more realistic and achievable in live trading.
Range Filter Strategy [Arabic Real Backtest]استراتيجية مرشح النطاق - اختبار واقعي
نظرة عامة
استراتيجية مرشح النطاق المتقدمة مصممة للاختبار الواقعي مع توقيت تنفيذ دقيق وإدارة مخاطر شاملة. تم بناؤها خصيصًا لأسواق العملات الرقمية مع معلمات قابلة للتخصيص لأصول وفترات زمنية مختلفة.
الخوارزمية الأساسية
تقنية مرشح النطاق:
* حساب متوسط النطاق السلس باستخدام فلترة مزدوجة للـ EMA
* فلترة أسعار استنادًا إلى النطاق الديناميكي لتحديد اتجاه الاتجاه
* نظام فلترة ضد الضوضاء لتقليل الإشارات الخاطئة
* تتبع الزخم الاتجاهي مع عدادات للأعلى/للأسفل
الميزات الرئيسية
**التنفيذ الفوري (بدون تأخير)**
* معالجة الأوامر عند كل نقطة: تنفيذ فوري دون انتظار إغلاق الشمعة
* تكامل مكبر الشمعة للحصول على دقة داخل الشمعة
* الحساب في كل نقطة لضمان الاستجابة القصوى
* تجاوز OHLC القياسي لزيادة الدقة
**محاكاة الأسعار الواقعية**
* تسعير الدخول باستخدام HL2 (High+Low)/2 لملء واقعي
* محاكاة للبُعد العازل للسعر القابل للتخصيص
* إنشاء انزلاق عشوائي (من 0 إلى الحد الأقصى للانزلاق)
* التحقق من سيولة السوق قبل الدخول
**فلترة الإشارات المتقدمة**
* فلترة استنادًا إلى الحجم مع نسبة قابلة للتخصيص
* نظام تأكيد الإشارة اختياري (من 1 إلى 3 شموع)
* منطق مضاد للتكرار لمنع الإشارات المكررة
* التحكم في حد التداول اليومي
**إدارة المخاطر**
* نسب ثابتة للمخاطرة: العائد مع حساب دقيق للنقاط
* تنفيذ وقف الخسارة وجني الأرباح تلقائيًا
* إدارة حجم المركز
* تحديد الحد الأقصى للصفقات اليومية
**نظام التنبيهات**
* تنبيهات فورية متزامنة مع تنفيذ الاستراتيجية
* أنواع متعددة من التنبيهات: إعداد، دخول، خروج، حالة
* تخصيص تنسيق الرسائل مع تضمين السعر/الوقت
* تكامل مع لوحة تنبيهات TradingView
المعلمات الافتراضية
محسن لرسوم بيانية لفترة 5 دقائق لبيتكوين:
* فترة العينة: 100
* معامل النطاق: 3.0
* المخاطرة: 50 نقطة
* المكافأة: 100 نقطة (نسبة 1:2)
* بُعد الانتشار: 2.0 نقطة
* الحد الأقصى للانزلاق: 1.0 نقطة
منطق الإشارة
**شروط الدخول الطويل:**
* السعر فوق خط مرشح النطاق
* تأكيد الزخم الصاعد
* تلبية متطلبات الحجم (إذا تم تمكينها)
* اكتمال فترة التأكيد (إذا تم تمكينها)
* لم يتم تجاوز حد الصفقات اليومية
**شروط الدخول القصير:**
* السعر تحت خط مرشح النطاق
* تأكيد الزخم الهابط
* تلبية متطلبات الحجم (إذا تم تمكينها)
* اكتمال فترة التأكيد (إذا تم تمكينها)
* لم يتم تجاوز حد الصفقات اليومية
العناصر البصرية
* خط مرشح النطاق مع تلوين الاتجاه
* الأشرطة العليا والسفلى المستهدفة
* علامات إشارات الدخول
* صناديق نسبة المخاطرة/العائد
* لوحة إعدادات حية
خيارات التخصيص
**التكيف مع السوق:**
* تعديل فترة العينة لبيانات الزمن المختلفة
* تعديل معامل النطاق لمستويات التقلب المختلفة
* تكوين الانتشار/الانزلاق لوسطاء مختلفين
* تحديد النسب المناسبة للمخاطرة/العائد حسب أسلوب التداول
**ضوابط الفلترة:**
* تمكين/تعطيل فلترة الحجم
* تعديل متطلبات التأكيد
* تعيين حدود الصفقات اليومية
* تخصيص تفضيلات التنبيه
الميزات المتعلقة بالأداء
* نتائج اختبار واقعية متوافقة مع التداول المباشر
* القضاء على تحيز المستقبل
* محاكاة تنفيذ الأوامر بشكل صحيح
* إحصائيات تداول شاملة
تكوين التنبيه
**أنواع التنبيهات المتاحة:**
* إشارات الدخول مع معلومات التداول الكاملة
* تنبيهات الإعداد للتحضير المبكر
* إشعارات الخروج لإدارة المراكز
* فلترة التغيرات في الاتجاه لظروف السوق
**تنسيق الرسائل:**
رمز - الإجراء | السعر: XX.XX | الوقف: XX.XX | الهدف: XX.XX | الوقت: HH\:MM
التوصيات لاستخدام الاستراتيجية
**الإعدادات المثلى:**
* بيتكوين/العملات الرقمية الرئيسية: المعلمات الافتراضية
* الفوركس: تقليل فترة العينة إلى 50-70، المعامل إلى 2.0-2.5
* الأسهم: تقليل فترة العينة إلى 30-50، المعامل إلى 1.0-1.8
* الذهب: فترة العينة 60-80، المعامل 1.5-2.0
**تكوين TradingView:**
* إعادة الحساب: "على كل نقطة"
* الأوامر: "استخدام مكبر الشمعة"
* البيانات: يوصى باستخدام التغذية الحية
إخلاء المسؤولية
تم تصميم هذه الاستراتيجية لأغراض تعليمية وتحليلية. الأداء السابق لا يضمن النتائج المستقبلية. يجب دائمًا إجراء اختبارات شاملة على التداول الورقي قبل التنفيذ المباشر. يجب أخذ ظروف السوق، تنفيذ الوسيط، والتحمل الشخصي للمخاطر في الاعتبار عند استخدام أي نظام تداول آلي.
Range Filter Strategy - Real Backtesting
# Overview
Advanced Range Filter strategy designed for realistic backtesting with precise execution timing and comprehensive risk management. Built specifically for cryptocurrency markets with customizable parameters for different assets and timeframes.
Core Algorithm
Range Filter Technology:
- Smooth Average Range calculation using dual EMA filtering
- Dynamic range-based price filtering to identify trend direction
- Anti-noise filtering system to reduce false signals
- Directional momentum tracking with upward/downward counters
Key Features
Real-Time Execution (No Delay)
- Process orders on tick: Immediate execution without waiting for bar close
- Bar magnifier integration for intrabar precision
- Calculate on every tick for maximum responsiveness
- Standard OHLC bypass for enhanced accuracy
Realistic Price Simulation
- HL2 entry pricing (High+Low)/2 for realistic fills
- Configurable spread buffer simulation
- Random slippage generation (0 to max slippage)
- Market liquidity validation before entry
Advanced Signal Filtering
- Volume-based filtering with customizable ratio
- Optional signal confirmation system (1-3 bars)
- Anti-repetition logic to prevent duplicate signals
- Daily trade limit controls
Risk Management
- Fixed Risk:Reward ratios with precise point calculation
- Automatic stop loss and take profit execution
- Position size management
- Maximum daily trades limitation
Alert System
- Real-time alerts synchronized with strategy execution
- Multiple alert types: Setup, Entry, Exit, Status
- Customizable message formatting with price/time inclusion
- TradingView alert panel integration
Default Parameters
Optimized for BTC 5-minute charts:
- Sampling Period: 100
- Range Multiplier: 3.0
- Risk: 50 points
- Reward: 100 points (1:2 R:R)
- Spread Buffer: 2.0 points
- Max Slippage: 1.0 points
Signal Logic
Long Entry Conditions:
- Price above Range Filter line
- Upward momentum confirmed
- Volume requirements met (if enabled)
- Confirmation period completed (if enabled)
- Daily trade limit not exceeded
Short Entry Conditions:
- Price below Range Filter line
- Downward momentum confirmed
- Volume requirements met (if enabled)
- Confirmation period completed (if enabled)
- Daily trade limit not exceeded
Visual Elements
- Range Filter line with directional coloring
- Upper and lower target bands
- Entry signal markers
- Risk/Reward ratio boxes
- Real-time settings dashboard
Customization Options
Market Adaptation:
- Adjust Sampling Period for different timeframes
- Modify Range Multiplier for various volatility levels
- Configure spread/slippage for different brokers
- Set appropriate R:R ratios for trading style
Filtering Controls:
- Enable/disable volume filtering
- Adjust confirmation requirements
- Set daily trade limits
- Customize alert preferences
Performance Features
- Realistic backtesting results aligned with live trading
- Elimination of look-ahead bias
- Proper order execution simulation
- Comprehensive trade statistics
Alert Configuration
Alert Types Available:
- Entry signals with complete trade information
- Setup alerts for early preparation
- Exit notifications for position management
- Filter direction changes for market context
Message Format:
Symbol - Action | Price: XX.XX | Stop: XX.XX | Target: XX.XX | Time: HH:MM
Usage Recommendations
Optimal Settings:
- Bitcoin/Major Crypto: Default parameters
- Forex: Reduce sampling period to 50-70, multiplier to 2.0-2.5
- Stocks: Reduce sampling period to 30-50, multiplier to 1.0-1.8
- Gold: Sampling period 60-80, multiplier 1.5-2.0
TradingView Configuration:
- Recalculate: "On every tick"
- Orders: "Use bar magnifier"
- Data: Real-time feed recommended
Risk Disclaimer
This strategy is designed for educational and analytical purposes. Past performance does not guarantee future results. Always test thoroughly on paper trading before live implementation. Consider market conditions, broker execution, and personal risk tolerance when using any automated trading system.

Fibonacci + TP/SL Strategy [Backtest]✅ Key Features Added and Adjusted:
Fibonacci Retracement Levels:
Automatically calculated based on the last 100 bars' high/low
Plotted levels: 0%, 23.6%, 38.2%, 50%, 61.8%, 78.6%, 100%
Extension targets: 161.8%, 261.8%, 423.6%
Buy/Sell Signal Logic:
Buy: Price is between 78.6% and 38.2% levels
Sell: Price is between 61.8% and 23.6% levels
Both depend on a can_trade time filter to avoid overtrading
ATR-based Stop-Loss:
Stop-loss dynamically adapts to market volatility:
SL = Entry - ATR * 1.5 (long)
SL = Entry + ATR * 1.5 (short)
Fixed Take-Profit:
Configurable via input: default is 4%
Can be changed in TradingView UI
Golden/Death Cross Indicator (Visual Only):
EMA 50 crossing EMA 200 plotted on chart:
Golden Cross = Buy signal (green triangle)
Death Cross = Sell signal (red triangle)
Weekly Profit Cap:
Prevents new trades if weekly profit exceeds 15%
Resets at the start of every week
Visual Elements:
All Fibonacci levels are plotted
Buy/Sell signals are labeled on the chart (BUY, SELL)

Advanced Multi-Timeframe Trading System (Risk Managed)Description:
This strategy is an original approach that combines two main analytical components to identify potential trade opportunities while simulating realistic trading conditions:
1. Market Trend Analysis via an Approximate Hurst Exponent
• What It Does:
The strategy computes a rough measure of market trending using an approximate Hurst exponent. A value above 0.5 suggests persistent, trending behavior, while a value below 0.5 indicates a tendency toward mean-reversion.
• How It’s Used:
The Hurst exponent is calculated on both the chart’s current timeframe and a higher timeframe (default: Daily) to capture both local and broader market dynamics.
2. Fibonacci Retracement Levels
• What It Does:
Using daily high and low data from a selected timeframe (default: Daily), the script computes key Fibonacci retracement levels.
• How It’s Used:
• The 61.8% level (Golden Ratio) serves as a key threshold:
• A long entry is signaled when the price crosses above this level if the daily Hurst exponent confirms a trending market.
• The 38.2% level is used to identify short-entry opportunities when the price crosses below it and the daily Hurst indicates non-trending conditions.
Signal Logic:
• Long Entry:
When the price crosses above the 61.8% Fibonacci level (Golden Ratio) and the daily Hurst exponent is greater than 0.5, suggesting a trending market.
• Short Entry:
When the price crosses below the 38.2% Fibonacci level and the daily Hurst exponent is less than 0.5, indicating a less trending or potentially reversing market.
Risk Management & Trade Execution:
• Stop-Loss:
Each trade is risk-managed with a stop-loss set at 2% below (for longs) or above (for shorts) the entry price. This ensures that no single trade risks more than a small, sustainable portion of the account.
• Take Profit:
A take profit order targets a risk-reward ratio of 1:2 (i.e., the target profit is twice the amount risked).
• Position Sizing:
Trades are executed with a fixed position size equal to 10% of account equity.
• Trade Frequency Limits:
• Daily Limit: A maximum of 5 trades per day
• Overall Limit: No more than 510 trades during the backtesting period (e.g., since 2019)
These limits are imposed to simulate realistic trading frequency and to avoid overtrading in backtest results.
Backtesting Parameters:
• Initial Capital: $10,000
• Commission: 0.1% per trade
• Slippage: 1 tick per bar
These settings aim to reflect the conditions faced by the average trader and help ensure that the backtesting results are realistic and not misleading.
Chart Overlays & Visual Aids:
• Fibonacci Levels:
The key Fibonacci retracement levels are plotted on the chart, and the zone between the 61.8% and 38.2% levels is highlighted to show a key retracement area.
• Market Trend Background:
The chart background is tinted green when the daily Hurst exponent indicates a trending market (value > 0.5) and red otherwise.
• Information Table:
An on-chart table displays key parameters such as the current Hurst exponent, daily Hurst value, the number of trades executed today, and the global trade count.
Disclaimer:
Past performance is not indicative of future results. This strategy is experimental and provided solely for educational purposes. It is essential that you backtest and paper trade using your own settings before considering any live deployment. The Hurst exponent calculation is an approximation and should be interpreted as a rough gauge of market behavior. Adjust the parameters and risk management settings according to your personal risk tolerance and market conditions.
Additional Notes:
• Originality & Usefulness:
This script is an original mashup that combines trend analysis with Fibonacci retracement methods. The description above explains how these components work together to provide trading signals.
• Realistic Results:
The strategy uses realistic account sizes, commission rates, slippage, and risk management rules to generate backtesting results that are representative of real-world trading.
• Educational Purpose:
This script is intended to support the TradingView community by offering insights into combining multiple analysis techniques in one strategy. It is not a “get-rich-quick” system but rather an educational tool to help traders understand risk management and trade signal logic.
By using this script, you acknowledge that trading involves risk and that you are responsible for testing and adjusting the strategy to fit your own trading environment. This publication is fully open source, and any modifications should include proper attribution if significant portions of the code are reused.

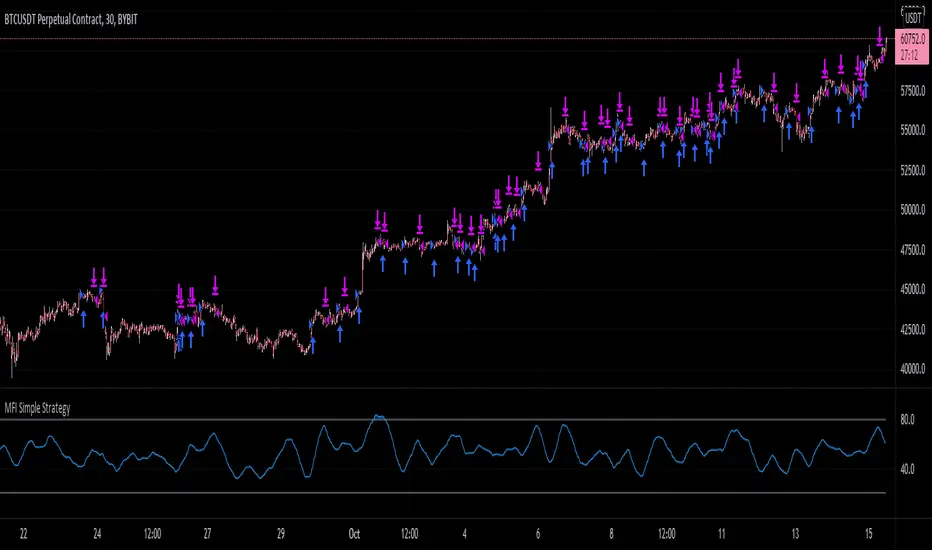
MFI Simple StrategyHere I've made a simple strategy based off a simple moving average of an MFI length.
Back tested on a BYBIT:BTCUSDT 30m chart.
Conditions:
---When the price is above the golden SMA of 200 bars---
- Buy: when MFI is moving up
- Sell: when MFI is moving down
- Stop: golden SMA of 200 bars
If you would like alerts:
1.) Add the strategy to your chart,
2.) Go to "Create Alert",
3.) Select "MFI Simple Strategy" in your alert creator,
4.) Select whatever notifications settings or message settings,
5.) Finally, click "Create" and you're good to go.
Disclaimer: Please do your own research before making any decisions financially. Past results do not guarantee future results.
Long only EMA CROSS 8/50/200 BacktestImprove EMA CROSS 8/50/200 with adjustable Exit EMA Level, and can open trade only when above EMA200

Random Entries Work!" tHe MaRkEtS aRe RaNdOm ", say moron academics.
The purpose of this study is to show that most markets are NOT random! Most markets show a clear bias where we can make such easy money, that a random number generator can do it.
=== HOW THE INDICATOR WORKS ===
The study will randomly enter the market
The study will randomly exit the market if in a trade
You can choose a Long Only, Short Only, or Bidirectional strategy
=== DEFAULT VALUES AND THEIR LOGIC ===
Percent Chance to Enter Per Bar: 10%
Percent Chance to Exit Per Bar: 3%
Direction: Long Only
Commission: 0
Each bar has a 10% chance to enter the market. Each bar has a 3% to exit the market . It will only enter long.
I included zero commission for simplification. It's a good exercise to include a commission/slippage to see just how much trading fees take from you.
=== TIPS ===
Increasing "Percent Chance to Exit" will shorten the time in a trade. You can see the "Avg # Bars In Trade" go down as you increase. If "Percent Chance to Exit" is too high, the study won't be in the market long enough to catch any movement, possibly exiting on the same bar most of the time.
If you're getting the red screen, that means the strategy lost so much money it went broke. Try reducing the percent equity on the Properties tab.
Switch the start year to avoid/minimize black swan events like the covid drop in 2020.
=== FINDINGS ===
Most markets lose money with a "Random" direction strategy.
Most markets lose ALL money with a "Short Only" strategy.
Most markets make money with a "Long Only" strategy.
Try this strategy on: Bitcoin (BTCUSD) and the NASDAQ (QQQ).
There are two popular memes right now: "Bitcoin to the moon" and "Stocks only go up". Both are seemingly true. Bitcoin was the best performing asset of the 2010's, gaining several billion percent in gains. The stock market is on a 100 year long uptrend. Why? BECAUSE FIAT CURRENCIES ALWAYS GO DOWN! This is inflation. If we measure the market in terms of others assets instead of fiat, the Long Only strategy doesn't work anymore (or works less well).
Try this strategy on: Bitcoin/GLD (BTCUSD/GLD), the Eurodollar (EURUSD), and the S&P 500 measured in gold (SPY/GLD).
Bitcoin measured in gold (BTCUSD/GLD) still works with a Long Only strategy because Bitcoin increased in value over both USD and gold.
The Eurodollar (EURUSD) generally loses money no matter what, especially if you add any commission. This makes sense as they are both fiat currencies with similar inflation schedules.
Gold and the S&P 500 have gained roughly the same amount since ~2000. Some years will show better results for a long strategy, while others will favor a short strategy. Now look at just SPY or GLD (which are both measured in USD by default!) and you'll see the same trend again: a Long Only strategy crushes even when entering and exiting randomly.
=== " JUST TELL ME WHAT TO DO, YOU NERD! " ===
Bulls always win and Bears always lose because fiat currencies go to zero.
You're not underperforming a random number generator, are you?

Multi Moving Average Crossing (by Coinrule)Moving Averages are among the most common trading indicators. They are straightforward to interpret and effective to use.
One of the limitations of using moving averages is they can provide buy and sell signals with a relatively high lag , making it very difficult to spot the lows and tops of the trend.
Moving averages calculated with a low number of periods like the MA9 (the average of the previous nine price periods) react very fast to price moves providing prompt signals. On the other side, more signals may end up with more false-signals and more trades in a loss.
On the contrary, moving averages calculated with a higher number of periods like the MA100 (which considers the previous one hundred price periods) give more reliable signals, but with a delay.
A system catching the crossing of the MA50 over the MA100 is a good compromise for successful long-term strategies. It provides, on average, reliable buy signals.
The Multi Moving Average Crossing Strategy tries to optimize the exit without waiting for the same opposite crossing (MA50 below MA100). It uses the MA9 crossing below the MA50, instead, to spot a better time for selling.
The setup is as follows.
BUY when the Moving Average 50 crosses above the Moving Average 100
SELL when the Moving Average 9 crosses below the Moving Average 50
The higher is the time frame to calculate the Moving Averages, the better is the overall performance of the strategy. The 4-hour (or 6-hour) time frame seems to be the best, even if it results in fewer trades. If you want to trade more still with good results, the 1-hour time is a good compromise.
Advantages of the strategy
This strategy seeks to catch those that are more likely relevant uptrends and close the trade relatively quickly. More trades mean more opportunities. This is especially effective if you run the strategy on all the available coins on the market, as you could do with Coinrule.
Generally, a Multi Moving Averages approach beats the classic crossing strategy involving only two Moving Averages. We backtested a sample of twenty trading pairs to assess the benefits empirically.
The results show that the Multi Moving Average Strategy
outperforms 13 out of 20 times
has 95% higher average return
has 67% higher median return
The strategy assumes each order to trade 30% of the available capital and opens a trade at a time. A trading fee of 0.1% is taken into account.

eha Moving Averages StrategyMoving Average based strategies are very popular ones among both long-term investors and short-term traders as they can be tailored to any time frame. One of the main moving average strategies are crossovers. The very simple type is a price crossover , which is when the price crosses above or below a moving average to signal a potential change in trend.
Another strategy is to apply two moving averages to a chart: one longer (or slow) and one shorter (or fast). When the shorter-term MA crosses above the longer-term MA, it's a buy signal, as it indicates that the trend is shifting up (also known as “ Golden Cross ”). Meanwhile, when the shorter-term MA crosses below the longer-term MA, it's a sell signal, as it indicates that the trend is shifting down (which is also known as “ Dead/Death Cross ”).
This is a study to find a suitable trading strategy for 4-6 hour time frames. As you can see the performance is currently very poor. It has just generated almost 90 trades in a very long period from January 2017 to the time of publishing the study for the first time.
Moving averages work quite well in strong trending conditions but poorly in choppy or ranging conditions. Adjusting the time frame can correct this problem temporarily, although, at some point, these issues are likely to occur regardless of the time frame chosen for the moving average(s).
I am working on this basic strategy to make its performance better and I will update the post in the future. So keep in touch by following the post.
Why have I republished my study?
It sounds like TradingView stores and indexes scripts based on the title of the post rather than the actual title of the scripts and if one chose general terms as the title of the post, the TradingView script search engine may be unable to find it. So I decided to repost the strategy with a more searchable and unique prefix of " eha ".
Please provide me with your precious feedback.


Moving Average Cross Strategy Simply define your fast and slow M then backtest the strategy.
*First script, work in progress. Will allow you to combine two TV indicators into one.

Line Break StrategyLine Break Strategy
Entry rule:
Long on a bullish line and short on a bearish line.
Backtest:
Profit factors are shown below for three-line break.
Daily time frame, FXCM broker.
EURUSD: 1.267, USDJPY: 1.039, GBPUSD: -0.816, AUDUSD: -0.959
S&P500: -0.783, Nikkei225: 1.099
CrudeOil: 1.03, Gold: 1.196
BTCUSD: -0.883
Reference:
Steve Nison, Beyond Candlesticks - New Japanese Charting Techniques Revealed
Note:
This strategy doesn't work properly on the linebreak chart.
A good example is shown below. The entry prices are not always correct.
If you have signal, but the next candle moves in the opposite direction, the entry price is drawn at the Open of the new candle instead of the Close of the previous candle.
The results of backtest are unreliable due to this reason.

Dynamic Swing Anchored VWAP STRAT (Zeiierman/PineIndicators)Dynamic Swing Anchored VWAP STRATEGY — Zeiierman × PineIndicators (Pine Script v6)
A pivot-to-pivot Anchored VWAP strategy that adapts to volatility, enters long on bullish structure, and closes on bearish structure. Built for TradingView in Pine Script v6.
Full credits to zeiierman.
Repainting notice: The original indicator logic is repainting. Swing labels (HH/HL/LH/LL) are finalized after enough bars have printed, so labels do not occur in real time. It is not possible to execute at historical label points. Treat results as educational and validate with Bar Replay and paper trading before considering any discretionary use.
Concept
The script identifies swing highs/lows over a user-defined lookback ( Swing Period ). When structure flips (most recent swing low is newer than the most recent swing high, or vice versa), a new regime begins.
At each confirmed pivot, a fresh Anchored VWAP segment is started and updated bar-by-bar using an EWMA-style decay on price×volume and volume.
Responsiveness is controlled by Adaptive Price Tracking (APT) . Optionally, APT auto-adjusts with an ATR ratio so that high volatility accelerates responsiveness and low volatility smooths it.
Longs are opened/held in bullish regimes and closed when the regime turns bearish. No short positions are taken by design.
How it works (under the hood)
Swing detection: Uses ta.highestbars / ta.lowestbars over prd to update swing highs (ph) and lows (pl), plus their bar indices (phL, plL).
Regime logic: If phL > plL → bullish regime; else → bearish regime. A change in this condition triggers a re-anchor of the VWAP at the newest pivot.
Adaptive VWAP math: APT is converted to an exponential decay factor ( alphaFromAPT ), then applied to running sums of price×volume and volume, producing the current VWAP estimate.
Rendering: Each pivot-anchored VWAP segment is drawn as a polyline and color-coded by regime. Optional structure labels (HH/HL/LH/LL) annotate the swing character.
Orders: On bullish flips, strategy.entry("L") opens/maintains a long; on bearish flips, strategy.close("L") exits.
Inputs & controls
Swing Period (prd) — Higher values identify larger, slower swings; lower values catch more frequent pivots but add noise.
Adaptive Price Tracking (APT) — Governs the VWAP’s “half-life.” Smaller APT → faster/closer to price; larger APT → smoother/stabler.
Adapt APT by ATR ratio — When enabled, APT scales with volatility so the VWAP speeds up in turbulent markets and slows down in quiet markets.
Volatility Bias — Tunes the strength of APT’s response to volatility (above 1 = stronger effect; below 1 = milder).
Style settings — Colors for swing labels and VWAP segments, plus line width for visibility.
Trade logic summary
Entry: Long when the swing structure turns bullish (latest swing low is more recent than the last swing high).
Exit: Close the long when structure turns bearish.
Position size: qty = strategy.equity / close × 5 (dynamic sizing; scales with account equity and instrument price). Consider reducing the multiplier for a more conservative profile.
Recommended workflow
Apply to instruments with reliable volume (equities, futures, crypto; FX tick volume can work but varies by broker).
Start on your preferred timeframe. Intraday often benefits from smaller APT (more reactive); higher timeframes may prefer larger APT (smoother).
Begin with defaults ( prd=50, APT=20 ); then toggle “Adapt by ATR” and vary Volatility Bias to observe how segments tighten/loosen.
Use Bar Replay to watch how pivots confirm and how the strategy re-anchors VWAP at those confirmations.
Layer your own risk rules (stops/targets, max position cap, session filters) before any discretionary use.
Practical tips
Context filter: Consider combining with a higher-timeframe bias (e.g., daily trend) and using this strategy as an entry timing layer.
First pivot preference: Some traders prefer only the first bullish pivot after a bearish regime (and vice versa) to reduce whipsaw in choppy ranges.
Deviations: You can add VWAP deviation bands to pre-plan partial exits or re-entries on mean-reversion pulls.
Sessions: Session-based filters (RTH vs. ETH) can materially change behavior on futures and equities.
Extending the script (ideas)
Add stops/targets (e.g., ATR stop below last swing low; partial profits at k×VWAP deviation).
Introduce mirrored short logic for two-sided testing.
Include alert conditions for regime flips or for price-VWAP interactions.
Incorporate HTF confirmation (e.g., only long when daily VWAP slope ≥ 0).
Throttle entries (e.g., once per regime flip) to avoid over-trading in ranges.
Known limitations
Repainting: Swing labels and pivot confirmations depend on future bars; historical labels can look “perfect.” Treat them as annotations, not executable signals.
Execution realism: Strategy includes commission and slippage fields, yet actual fills differ by venue/liquidity.
No guarantees: Past behavior does not imply future results. This publication is for research/education only and not financial advice.
Defaults (backtest environment)
Initial capital: 10,000
Commission value: 0.01
Slippage: 1
Overlay: true
Max bars back: 5000; Max labels/polylines set for deep swing histories
Quick checklist
Add to chart and verify that the instrument has volume.
Use defaults, then tune APT and Volatility Bias with/without ATR adaptation.
Observe how each pivot re-anchors VWAP and how regime flips drive entries/exits.
Paper trade across several symbols/timeframes before any discretionary decisions.
Attribution & license
Original indicator concept and logic: Zeiierman — please credit the author.
Strategy wrapper and publication: PineIndicators .
License: CC BY-NC-SA 4.0 (Attribution-NonCommercial-ShareAlike). Respect the license when forking or publishing derivatives.

AlphaTrend Strategy – Advanced Trend & Momentum Trading SystemThe AlphaTrend Strategy is a powerful trading system designed to capture trend-following opportunities while filtering out low-quality setups.
It combines multiple layers of confirmation, including:
✅ AlphaTrend entry & exit signals based on dynamic ATR and MFI calculations
✅ Trend filter with customizable moving averages (SMA, EMA, WMA, VWMA, HMA)
✅ Momentum filter using ADX with optional DI+ / DI– checks
✅ Session-based trading to restrict entries to specific market hours
This script supports both long & short trades, provides session highlights, and plots risk-reward levels for better trade management.
Traders can fine-tune the multipliers, lookback periods, and filters to adapt the strategy across different assets and timeframes.
⚡ Ideal for forex, crypto, and indices where trend-following strategies thrive.