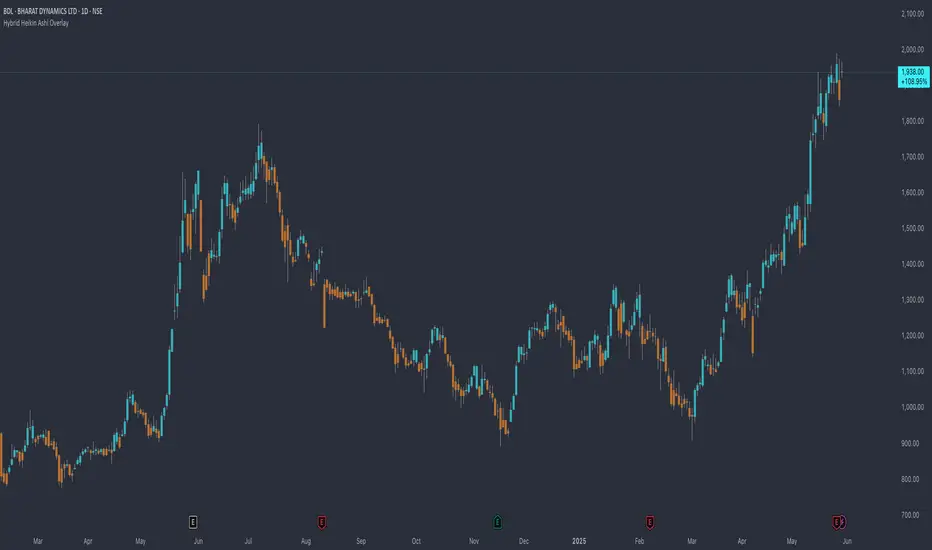
Hybrid Heikin Ashi OverlayHybrid Heikin Ashi Overlay
I personally like Heikin Ashi for its simplicity in showing clean trends. However, it tends to smooth out price action so much that we sometimes miss key signals from the actual candles.
This indicator overlays Heikin Ashi-style background colors while keeping regular candles intact — giving you the best of both worlds:
• Smoother trend visibility
• No loss of execution precision
• Customizable colors & transparency
🔹 No repainting
🔹 No strategy logic — purely visual
🔹 Designed to reduce clutter and help traders stay focused on structure
Created by: @yug_and_her
Cerca negli script per "Heikin Ashi"
[Pt] TICK + Heikin Ashi RSI IndicatorThis indicator combines NYSE TICK and RSI to aim to provide a view of NYSE market trend strength.
What is TICK
NYSE TICK, also known as the TICK index, is a technical analysis indicator that shows the number of stocks on the New York Stock Exchange (NYSE) that are trading on an uptick or a downtick in a particular period of time. The TICK index is calculated by subtracting the number of stocks trading on a downtick from the number of stocks trading on an uptick. A reading of +1000 on the TICK index, for example, would indicate that there are 1000 more stocks trading on an uptick than on a downtick. The TICK index is often used as a measure of market sentiment, as it can provide insight into whether there is more buying or selling pressure in the market at a given time. A high TICK index reading may suggest that there is strong buying pressure, while a low TICK index reading may indicate that there is more selling pressure in the market.
By default, I am using -800 and 800 for oversold and overbought levels. These are configurable. Also, this indicator includes TICK divergence signals.
The TICK index is usually very volatile, so this indicator is best suited for lower timeframes, such as 1 to 5 min charts.
Idea of TICK neutral zone
As part of this indicator I've identified what I consider as "neutral" range for the TICK. Based on my own personal experience, the market tends to be in consolidation or choppy in this range. By default, I've defined this range to be -200 to 200. This range is configurable.
Signals
In combination with RSI and Heikin Ashi RSI (HARSI), which help smooths out the RSI values and make it easier to identify trends and potential reversal points, this indicator aims to generate Bullish vs Bearish signals based on the following conditions:
- bullish / bearish HARSI candle
- Inside bar on HARSI candle
- TICK trend (above or below Neutral zone)
- RSI trend (above or below 0, but not overbought or oversold)
- RSI / HARSI convergence and divergence
When all bullish conditions are met, the signal turns bright green. Bright red when all bearish conditions are met. These generated signals aims to provide users easy to read visual cues to help with their trades.
A table is also provided in attempt to identify the trend in real time:
TICK trend:
- Bullish, Extended
- Bullish
- Neutral w/ Bullish bias
- Neutral w/ Bearish bias
- Bearish
- Bearish, Extended
RSI:
- Bullish
- Bearish
Note on scale
This indicator is based on the scale for TICK, hence the RSI and HARSI are scaled. By default, standard overbought RSI value of 70 = 800 on this scale, whereas oversold value of 30 = -800.
Credits:
Heikin Ashi RSI code was borrowed from @JayRogers - Heikin Ashi RSI Oscillator

6 Multi-Timeframe Supertrend with Heikin Ashi as Source
This is a multiple multi-timeframe version of famous supertrernd only with Heikin Ashi as source. Atr which stands in the heart of supertrend is calculated based on heikin-ashi bars which omits a great deal of noises.
with 6 multiplication of the supertrend, its simply much easier to spot trend direction or use it as trailing stop with several levels available.
this is a great tool to assess and manage your risk and calculate your position volume if you use the heikin ashi supertrend as your stoploss.

Kozlod - Heikin-Ashi Bar Color Change AlertsYou can use this script to setup alerts on Heikin-Ashi bar color change.
You have to apply this script to usual candles and not Heikin-Ashi!!!
Background color indicates HA bar color. On change you'll see green/red arrows and alert will be fired.
Also you can find in the code calculations of all HA OHLC values.

Awesome Heikin Ashi [Morty]This indicator uses Heikin Ashi candles and two EMAs to help you follow the trend and enter the trade. Heikin Ashi candles help to smooth the price and EMAs are used to detect trend. The default parameter of EMA is EMA10 and EMA20. You can use it at any timeframe. You should always adjust the EMA length according to different timeframes.
Features:
- Highlight background based on two EMAs
- Adjustable EMA length
- Adjustable Label size
- Show entry and exit signal labels
- Show stoploss price
- You can choose Long only or Short only or both signals
- Alert functions for notification
NOTE: If you use this signal to enter a trade, make sure the candle is close and enter in the next candle.

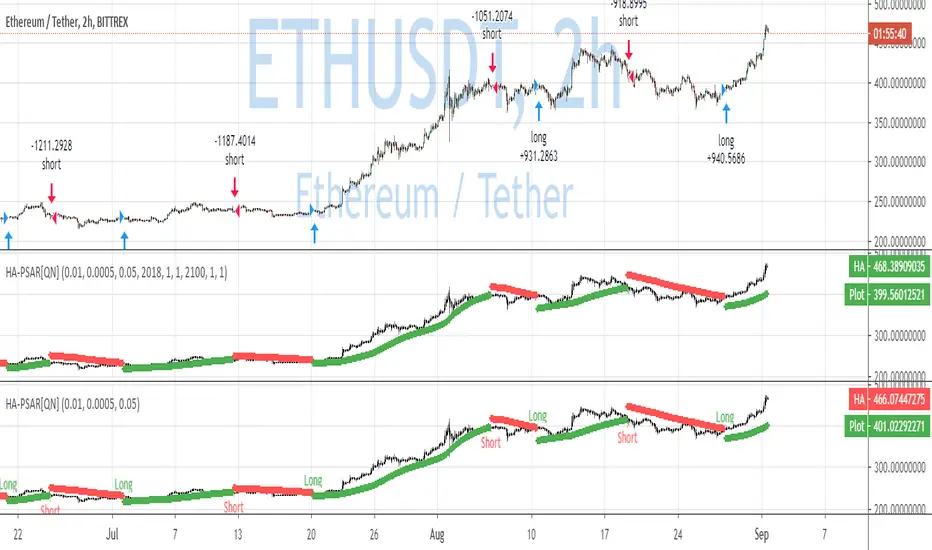
QuantNomad - Heikin-Ashi PSAR AlertsUsing this script you can create alerts for my Heikin-Ashi PSAR Strategy:
When creating alerts use "Once Per Bar Close" in parameters.
####################
Disclaimer
Please remember that past performance may not be indicative of future results.
Due to various factors, including changing market conditions, the strategy may no longer perform as good as in historical backtesting.
This post and the script don’t provide any financial advice.
SuperTrend Heikin AshiSupertrend Heikin Ashi is an indicator based on the standard calculation of the Supertrend with the difference of using the Open and Close value of the Heikin Ashi candles instead of the normal Candle Sticks.
In this way the main characteristic of the HA candles is exploited, thus filtering movements that could generate false signals.
I recommend using SPY, SPX, QQQ to be aware of the market situation, not operating (or paying great attention) long on stocks when the indicator is red and the price is below the drawn line.

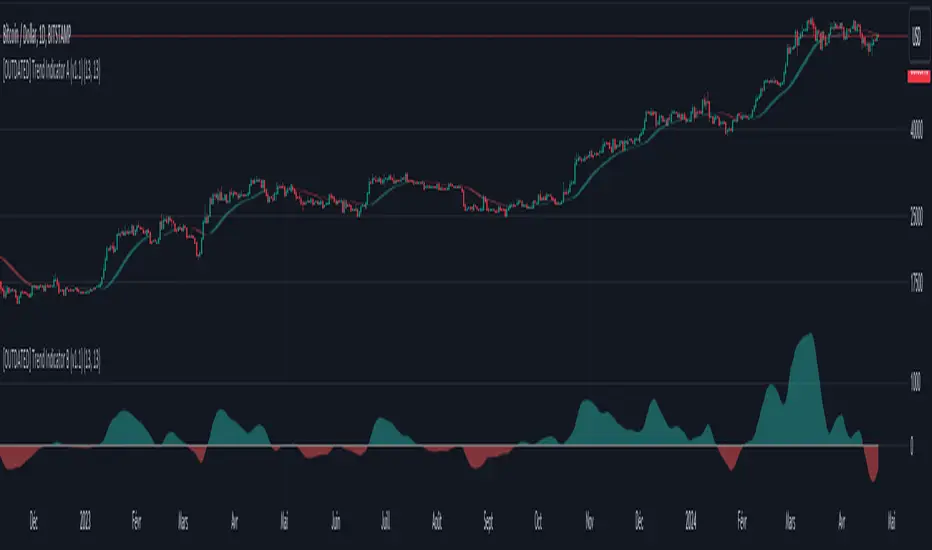
Trend Indicator A-V2 (Smoothed Heikin Ashi Cloud)"Trend Indicator A-V2" and "Trend Indicator B-V2" are updated and improved versions of my initial trend indicators. Totally rethinking the code, adding highs and lows in the calculations, including some more customisation through colour schemes.
In practice, this indicator uses EMAs and Heikin Ashi to provide an overall idea of the trend.
The "Trend Indicator A-V2" is an overlay showing “Smoothed Heikin Ashi” .
The "Trend Indicator B-V2" uses the same values in a different way to measure the momentum of the trend and identify potential trend rejections.
Please, take into account that it is a lagging indicator.

Dziwne Trend Indicator B (EMA + Heikin Ashi) V1Based on my own "Dziwne Trend Indicator A (EMA + Heikin Ashi cloud)" , I tweaked the original script to display and "measure" the overall trend.

Dziwne Trend Indicator A (EMA + Heikin Ashi cloud)First script ever publish.
It is a very simple trend indicator based on EMAs and Heikin Ashi .
Real Price for Heikin Ashi ChartsThe indicator is in the top left of the screen! That's all there is, by design.
This is a super simple indicator that allows you to see what the real price of a candle was when using Heikin Ashi charts, while not cluttering up your screen.
HA charts are a great way to help those who can be spooked by the chaos of the markets (I'm one!), but they have a big drawback in that the price you see on a HA candle is often significantly different from the real price that you would trade on. This brings issues of unrealistic expectations of profits/losses, and also makes back testing a strategy very difficult. I still wouldn't recommend ever using TradingView's "strategy" tool when using HA charts, but using this indicator you can do accurate manual back tests.
There's nothing plotted on the screen given that there's no real point in it, but you can make the lines appear if you wish - just go into settings and change the transparency.
The order of the numbers on the indicator match the OHLC (Open, High, Low, Close) format.
There's also settings to turn off one or more of the OHLC values, simply open the settings and go to Inputs. This could be useful for some people, as the High and Low values of HA candles are the same as regular candles. Only the Open and Close are different.
Any queries let me know.
DreamsDefined

External Indicator Analysis Overlay | Buy/Sell | HTF Heikin-AshiThis chart overlay offers multiple candlestick display options. The Regular (Japanese) and the Heikin-Ashi candles are well known. The Mari-Ashi (or Renko) option is something special as it should be timeframe independent, so that sideways action should be represented in one candle. That is difficult to realize as an overlay on the normal candlestick structure, but perhaps the chosen implementation is useful nonetheless. The Velocity option is experimental and is designed to show if the price has accelerated too much in a trend direction. In this case, the highs and lows do not reflect the actual highs and lows, but indicate the overshooting velocity. The opening of the candle also depends on the inherent velocity, but the close of the candle is always the actual close. Anyway, it doesn't look very useful, but the option is there.
All options can be applied to higher timeframes. A usable setting is obtained by disabling only the body of the TradingView candles in regular mode and enabling this overlay.
A large part of this overlay consists of buy/sell indication settings. For activation it is necessary to select an external source. For example the “Relative Bi-Directional Volatility Range”, specifically the Trend Shift Signal (TSS). This signal switches from 0 to 1, if the trend becomes bullish or from 0 to -1, if the trend becomes bearish. It will be automatically detected without specifying the Indication Type. Alternatively, the Volatility Moving Average (VMA) would meet the requirements for the Indication Type “Buy = positive | Sell = negative”. The Moving Average Convergence Divergence (MACD) also fulfills these conditions. Another example is to use any Moving Average with the Indication Type “Buy = rising | Sell = falling”. In the chart above the Hull Moving Average (HMA) is used. In addition, it is possible to reverse the signal, so that positive signals become negative and vice versa. The signals will be labeled as Buy or Sell on the chart.
The user can analyze whether the provided signals are good or bad indications for going long or short or simply for rebalancing a portfolio. Therefore, it is possible to set a starting point for the analysis and choose a weighting for the investments from 0% to 100% of the portfolio. To avoid sleepless nights, a very reliable (and conservative) setting seems to be Rebalancing with 50% (very similar to the well-known 60/40 portfolio). The calculation results are shown in a table.
As a small addition there is the possibility to label the peaks by setting the distance between the highs/lows. This will make the quality of the buy and sell signals even more clear.

XenoSmooth Predictive Candles - Advanced Heikin Ashi CandlesXenoSmooth Predictive Candles
Summary in one paragraph
A synthetic candle engine for crypto, FX, equities, and futures on intraday to swing timeframes. It reduces noise and flip delay so structure is easier to read. The core novelty is a predictive open with inertia plus slope lead fused with a zero lag body filter and an overshoot based wick model normalized by the real range and capped by ATR. Add it to a clean chart, hide regular candles if desired, and tune lengths. Shapes can move while the bar is open and settle on close. For conservative workflows read on bar close.
Scope and intent
• Markets. Major FX pairs, index futures, large cap equities, liquid crypto
• Timeframes. One minute to daily
• Purpose. Faster and smoother visual structure than Heikin Ashi while keeping causality and realistic wicks
Originality and usefulness
• Unique concept. Predictive open with inertia and slope lead plus selectable zero lag body filter and ATR capped wick overshoot in percent of real range
• Failure mode addressed. Late flips in chop and unreal long wicks from raw extremes
• Testability. Every control is an input. Users can toggle body method, lengths, clipping, and percent modeling
• Portable yardstick. ATR based wick cap and percent of bar range scale across symbols
Method overview in plain language
Build a robust base price from O, H, L, and extra weight on Close. Smooth it with a chosen filter to produce the synthetic close. Drive a predictive open that follows the synthetic close with tunable inertia and a small lead from the last bar slope. Model wicks as the portion of the real extremes that extends beyond the synthetic body, smooth that overshoot, normalize by the bar range if selected, then cap by ATR to avoid tail spikes. Clamp synthetic values to the real high and low if enabled.
Base measures
• Range basis. True Range for the ATR cap and High minus Low for percent normalization
• Return basis. Not used
Components
• Body Base Blend. Weighted O H L with a close bias to stabilize the base
• Zero Lag Body Filter. ZLEMA or Super Smoother or WMA to set the synthetic close
• Predictive Open. Inertial follow of the synthetic close plus a slope lead term
• Wick Overshoot Model. Smoothed extension beyond the body, optional percent of real range, ATR cap
• Clamp Option. Keeps synthetic open and close inside the real bar range
Fusion rule
• Synthetic close equals filtered base
• Synthetic open equals previous open plus inertia times distance to synthetic close plus slope lead
• Wicks equal smoothed overshoot above and below the body, optionally percent of range then converted back to price and capped by ATR
Inputs with guidance
Setup
• Signal timeframe. Uses the chart timeframe
• Invert direction. Not applicable
• Session windows. Not applicable
Logic
• Body length. Core smoothing length for the synthetic close. Typical 6 to 14. Higher gives smoother and slower. Lower gives faster flips
• Body method. ZLEMA or Super Smoother or WMA. ZLEMA is fastest. Super Smoother is calmest
• Close weight in base. 0 to 1. Higher gives stronger emphasis on close and less noise
• Open inertia. 0 to 1. Higher makes the open follow the close more tightly
• Lead gain. 0 to 1. Higher adds more phase lead. Keep modest to avoid overshoot
• Clamp body to real range. On keeps synthetic body inside high and low
• Wick smooth length. Typical 4 to 10. Higher reduces jitter
• Overshoot as percent. On stabilizes wicks across regimes
• ATR length. Typical 10 to 20 for the cap
• Max wick equals ATR times. 0 disables. 1.0 to 2.0 contains extreme tails
Filters
• Efficiency or trend filter. Not used
• Micro versus macro range relation. Not used
• Location filter. Not used
Realism and responsible publication
• No performance claims
• Intrabar motion reminder. Shapes can move while a bar forms and settle on close
• Strategies must use standard candles for signals and orders
Honest limitations and failure modes
• High impact releases and thin liquidity can distort wicks and produce gaps that any smoother cannot predict
• Very quiet regimes can reduce contrast. Consider longer body length
• Session time on the chart controls the definition of each bar

Open Interest with Heikin Ashi candlesA simple modification of the Tradingview free script of futures Open Interest to Heikin Ashi candles. It displays the volume of the Open Interest futures contracts by applying the HA formula.
I use it to clear out the "noise" of up's and down's especially in intraday small time frames when I am scalping in crypto.
Background color can be turned on/off.
Just to give back a little something to a community that gave me A LOT!
Let me know what you think and if you need anything to add.
Have fun :)
P.S. The way I use it is to try to find traps in the market and take (fast) advantage of them. When the OI are going up really fast in small time frames (which means either longs or shorts are going up) this creates a good opportunity for a squeeze (the trap).
Of course I use other indicators/oscillators to determine that but it gets me on my toes to look for... something ;)

Cloak & Dagger Heikin-ashiThis indicator is intended to reduce market noise by averaging "Heikin-ashi" a few more times.
You can set the number of averages and how the closing price is calculated.
The Modes:
There are several presets.
The "Mode 1" is more conservative and flips fewer times, but with less noise.
(Averaged by 5 times, Close calculated by oc2)
The "Mode 2" is more aggressive, with more flips and faster timing.
(Averaged by 10 times, Close calculated by ohlc4)
Triggers:
Triggers the inversion of the bar. It can be visualized and alerts can be set.

Off-chart 21 MA, Bollinger Bands and Heikin Ashi CandlesThis off-chart indicator provides three basic and useful tools for trend trading in Bitcoin and probably other markets. Heikin Ashi candles being utilized with classic candle patterns at the same time could be considered as a conservative and safe confirmation approach for entring your position.

21 MA, Bollinger Bands and Heikin AshiThis on-chart indicator provides three basic and useful tools for trend trading in Bitcoin and probably other markets. Moving and Bollinger lines act as strong support and resistance in 4H resolution. Heikin Ashi candles being utilized with classic candle patterns at the same time could be considered as a conservative and safe confirmation approach for entring your position.

Briz HA MTF - A Heikin-Ashi Multi-Timeframe Indicator Ever wanted to know what Heikin-Ashi candles are showing for multiple time frames at a glance? Adjustable time frame for each row. Arrows show when each column is either all green (white up arrow) or all red (yellow down arrow).

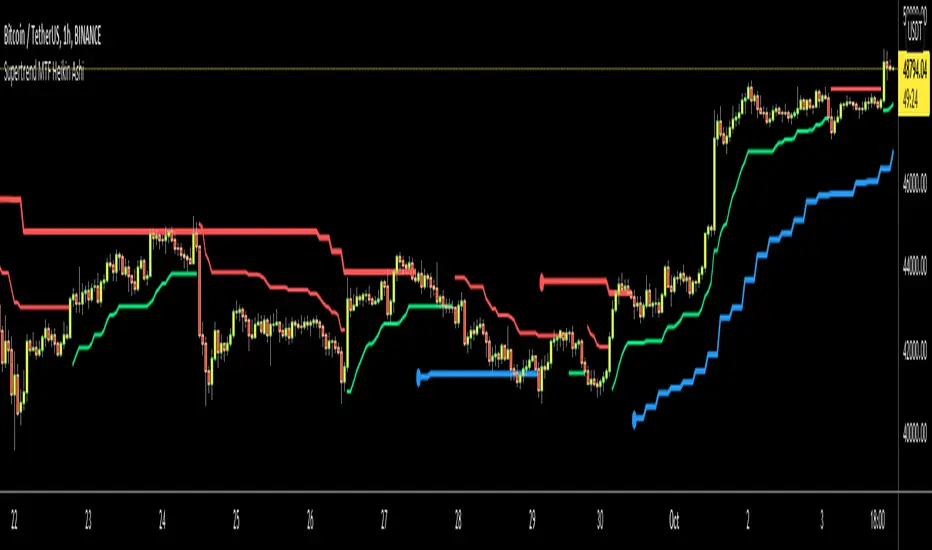
Supertrend MTF Heikin AshiThis is non-repaiting Supertrend Multi Time Frame script, uses Heikin Ashi Candles as source on normal chart
There is an option for Higher Time Frame. if you choose "Auto" then Higher Time Frame calculation is made by the script. If you choose "User Defined" option and then you can select Time Frame.
You better use this script with other indicators such as RSI, Momentum etc.
Enjoy!
Heikin Ashi Overlay SuiteHeikin Ashi Overlay Suite is designed to give traders more control and clarity when working with Heikin Ashi candles — whether you're analyzing trend strength, reducing chart noise, or simply improving your visual read of market momentum. It works by layering multiple types of HA overlays and color systems on top of your standard candlestick chart — without switching chart types. With dynamic gradient coloring, smoothing options, and a predictive line tool, this script helps you see not just what the current trend is, but how strong it is, and what it would take to reverse it.
Heikin Ashi candles help reduce noise but this script goes further by:
➡️adding color intelligence that shows trend strength using a streak counter
➡️uses smoothing logic to clean up chop and whipsaws
➡️introduces a predictive close line — a subtle but powerful guide for anticipating trend flips before they happen
Everything is configurable: colors, candle sources, overlays, predictive tools, and line styles. It’s built for traders who want visual speed, but don’t want to sacrifice signal quality.
At its core, the script offers two powerful dropdown controls:
💥HA Color Scheme (Colors Regular Candles) — Applies Heikin Ashi-derived coloring to your regular candles based on trend direction or streak strength. This gives you instant visual context without switching to a separate chart type.
💥HA Candle Overlay Mode — Overlays actual Heikin Ashi-style candles directly on top of your chart, using your preferred source:
➡️Custom HA candles using internal formula logic
➡️TradingView’s built-in Heikin Ashi source with your own colors
➖➖➖➖➖➖➖➖➖➖➖➖➖➖➖➖➖➖➖➖➖➖➖➖➖➖➖➖➖➖➖
🎨 Custom + Gradient HA Coloring🎨
See trend strength at a glance:
➡️1–4 bar streaks → lighter tone
➡️5–8 bars → medium tone
➡️9+ bars → bold tone, ideal for momentum-based entries, exits, or scaling strategies
→ Choose from:
➡️Your own custom color set
➡️A simple 2-color base mode
➡️Or a 3-level gradient for progressive trend analysis (using the streak counter)
🏛️ TradingView Official Heikin Ashi Overlay
Prefer native HA candles but want your own colors?
This mode plots TradingView's Heikin Ashi source, with your personal bullish/bearish color scheme.
➡️Ensures consistency with built-in charts while still leveraging your visual style.
🌊 Smoothed Heikin Ashi Candles — Clarity in Chaos🌊
These aren’t your standard HA candles. Smoothed Heikin Ashi uses a two-step EMA process to transform chaotic price action into a cleaner, slower-moving trend structure:
🔹 First, it smooths the raw OHLC data using EMA — filtering out minor price fluctuations.
🔹 Then, it applies the Heikin Ashi transformation on top of the smoothed data.
🔹 Finally, it applies a second EMA smoothing pass to the HA values — creating ultra-smooth candles.
📈 What You See:
Trends appear more fluid and consistent.
Choppy ranges and fakeouts are visually suppressed.
Minor pullbacks within a trend are de-emphasized, helping you avoid premature exits.
🎯 Best For:
Swing traders looking to stay in positions longer.
Intraday traders dealing with volatile or noisy instruments.
Anyone who wants a "trend map" overlay without the distractions of raw price action.
✅ Reduces whipsaws
✅ Delivers high-contrast trend zones
✅ Makes reversals more visually apparent (but with a slight lag)
📍 Predictive Close Line📍
Shows where the real close must land to flip the current HA candle's color.
✅ Use it like predictive support/resistance
✅ Know if the trend is actually at risk
✅Visualize potential fakeouts or confirmation
Color-coded based on current HA direction (bullish, bearish, or neutral).
📈 Tick by tick & bar-to-bar Plots📈
Provides 2 plot types:
1)1 plot that tracks a bar tick by tick
2)another plot that tracks the close from bar to bar
For the bar to bar plot, you can choose between 2 options:
✅Full Plot — continuous line colored by HA trend
✅Recent Segments — color just the last few bars (configurable) to reduce chart clutter
✅ Customize width, number of bars, and visibility
➖➖➖➖➖➖➖➖➖➖➖➖➖➖➖➖➖➖➖➖➖➖➖➖➖➖➖➖➖➖➖
📘 How to Use this script📘
Imagine you're watching a choppy 15-minute chart on a volatile crypto pair — price action is messy, and it’s hard to tell if a trend is forming or just noise.
Here’s how to cut through the chaos using Heikin Ashi Overlay Suite:
🔹 Step 1: Enable "Smoothed HA Candles"
Start by turning on the smoothed candles. You’ll immediately notice the noise fades, and broader directional moves become easier to follow. It's like switching from static to clean trend zones.
🧠 Why: Smoothed HA uses a double EMA process that filters out small reversals and lets larger moves stand out. Perfect for sideways or jittery charts.
🔹 Step 2: Watch the Color Gradient Build
As the smoothed candles begin to align in one direction, the gradient coloring (1–4, 5–8, 9+ streaks) gives you an at-a-glance visual of how strong the trend is.
✅ If you see 9+ same-colored candles? You’re likely in a mature trend.
✅ If it resets often? You’re in chop — consider staying out.
🔹 Step 3: Use the Predictive Close Line for Anticipation
Now here’s the edge — this line tells you where the candle would have to close to flip colors.
📉 If price is hovering just above it during a bullish run — momentum may be weakening.
📈 If price bounces off it — the trend may be strengthening.
This is excellent for confirming entries, exits, or spotting early warning signs.
🔹 Step 4: Switch Between Candle Modes as Needed
You can flip between:
✅ Custom HA: Gradient candles with your colors
✅ TradingView HA: The official source with your styling
✅ None: Just color regular candles using the HA logic
Use what fits your style — everything is modular.
🔹 Step 5: Tune It to Your Chart
Lastly, tweak streak thresholds (currently only can do this within the source code), smoothing lengths, and line styles to match your timeframe and strategy.
🎯 Tailor The Settings to Fit Your Trading Style🎯
🔹 🧪 Scalper (1–5 min charts)
If you’re trading fast intraday moves, you want quicker responsiveness and less lag.
Try these settings:
🔸Smoothing Lengths: Use lower values (e.g. len = 3, len2 = 5)
🔸Candle Mode: Use Custom HA or TV’s HA for real-time color flips
🔸Predictive Close Line: Great for ultra-fast anticipation of color reversals
🔸Line Mode: Use Recent Segments mode to track short bursts of trend
🔸Colors: Use high-contrast, opaque colors for clarity
✅ These settings help you catch micro-trends and flip signals faster, while still filtering out the worst of the noise.
🔹 🧪 Swing Trader (30m–4h charts and beyond)
If you’re looking for multi-hour or multi-day trend confirmation, prioritize clarity and staying in moves longer.
Recommended setup:
🔸Smoothing Lengths: Medium to high values (e.g. len = 8, len2 = 21)
🔸Candle Mode: Use Smoothed HA Candles to block out intrabar chop
🔸Gradient Colors: Enable to visualize trend maturity and strength
🔸Predictive Close Line: Helps confirm trend continuation or spot early reversals
🔸Line Mode: Use Full Plot Line for clean HA-based trend tracking
✅ These settings give you a calm, clean view of the bigger picture — ideal for holding positions longer and avoiding early exits.
🔧 This script isn’t just a chart overlay — it’s a visual trend engine.🔧
Ideal For:
🔶 Trend-followers who want clean, color-coded confirmation
🔶 Reversal traders spotting exhaustion via predictive flips
🔶 Scalpers filtering noise with lighter smoothing
🔶 Swing traders using smoothed visuals to hold longer
📌 Final Note
Heikin Ashi Overlay Pro is designed to help you see momentum, trend shifts, and market structure with greater clarity — not to predict price on its own. For best results:
✔️ Combine with support/resistance, moving averages, or price action patterns
✔️ Use Predictive Close as a confirmation tool, not a signal generator
✔️ Pair gradient colors with structure to gauge trend maturity
✔️ Always zoom out and check higher timeframes for context
🧠 Use this as part of a layered approach — not a standalone system.
🙏 Credits🙏
⚡HA logic based on SimpleCryptoLife
⚡Smoothed HA concept adapted from a script by Jackvmk
💡💡💡Turn logic into clarity. Structure into trades. And uncertainty into confidence.💡💡💡

Heikin-Ashi Cumulative Volume Delta (CVD)Heikin-Ashi Cumulative Volume Delta (CVD)
This indicator combines Heikin-Ashi calculations with a Cumulative Volume Delta (CVD) to highlight trends in volume.
🔹 Heikin-Ashi Calculation – Smooths out price action to filter noise and provide a clearer trend signal.
🔹 Adjusted Volume Delta – Uses a dynamic threshold based on 10 SMA to reduce sensitivity and eliminate minor fluctuations, showing only meaningful shifts in buying and selling pressure.
🔹 Cumulative Volume Delta (CVD) – Accumulates positive or negative volume depending on Heikin-Ashi candle direction, offering insight into underlying order flow.
🔹 EMA Trend Filters – Two user-adjustable EMAs (default: 20 & 50) applied to CVD, color-coded to indicate trend bias (green/red for short EMA, blue/orange for long EMA).
🔹 Visual Enhancements –
CVD plotted as coloured dots (green = bullish, red = bearish, grey = neutral).
EMA lines dynamically change colour with trend direction.
Price bars are recoloured to match the delta (green = buy pressure, red = sell pressure, grey = neutral).
Useful for spotting divergences between price and volume flow, identifying hidden accumulation/distribution, and confirming trend continuation or reversal signals.

Heikin-Ashi OscillatorHeikin-Ashi Oscillator
--------------------------
By reducing noice it makes trends, price patterns, and reversal points easier to spot.
Here it is implemented as a single function so that it easily can be integrated with other code.
Suggestion: Enter (at your own risk) or Exit a trade based on when the Heikin-Ashi Oscillator switch direction.

Heikin Ashi Smoothed (yasinipek) by KIVANC fr3762Heikin Ashi Smoothed Strategy
A trend trading forex system composed of the Smoothed Heiken Ashi candlestick indicator and moving averages. It works best on the 1 hour charts and higher time frames.
buy when blue line crosses above red
conversely sell when red line crosses above blue
Author: Yasin İpek @yasinipek83 on twitter / www.yasinipek.com & KıvanÇ @fr3762 on twitter (tweets are only in TURKISH)
