Ichimoku Cloud - AlertsIchimoku cloud
IC is a trend - following system with an indicator similar to moving averages
It predicts price movements
Offers a unique perspective of support and resistance levels.
Conversion Line (Turning Line)
- Measures Short Term Trend
- SIgnals an area of minor support and resistance
Base Line (Confirmation Line)
Measures Medium term trend
Used as Trailing Stop Level.
Lagging Span (Lagging Line)
Used for Confirmation of signals
Can also serve as Support and Resistance Level
Kumo Cloud
Formed of two lines: Span A (Green Line) and Span B (Red Line)
Dynamic Support and Resistance .
HOW TO READ ICHIMOKU INDICATOR
Conversion Line
If the Market Price is above the Conversion Line = Short Term Upward Movement
If the Market Price is below the Conversion Line = Short Term Downward Movement
Increasing Conversion Line = Upward Short Term Trend
Decreasing Conversion Line = Downward Short Term Trend
Base Line
If the Market Price is above the baseline = Medium - term upward trend
If the Market price is below the baseline = Medium - Term downward Trend
Increasing Base Line = Upward Medium term trend
Decreasing Base Line = Downward Medium Term Trend
Lagging Span
The Evolution of the current price action in relation to previous price action
If the Lagging span is above the current price = Bullish Bias
If the Lagging span is below the current price = Bearish Bias
Lagging span near the current price = Trading range
Kumo Cloud
Dynamic Support and Resistance based upon price action.
The longer the price stays below/above the Kumo cloud, the STRONGER the trend is.
When the cloud is wide, the expected support or resistance is strong
When the cloud is thin, the expected support or resistance is weak
Never trade inside the KUMO CLOUD.
HOW TO TRADE WITH ICHIMOKU CLOUD
Baseline and conversion Line crossover (Lagging Span as a Filter)
crossover(conversion line, baseline) = Buy
crossunder(conversion line, baseline) = Sell
FILTER
crossover(conversion line, baseline) and lagging span is Bullish (i.e above the price) = Buy
Crossunder(conversion line, baseline) and lagging span is Bearish (i.e below the price) = Sell
2. Baseline - Conversion line crossover (Kumo cloud Filter)
crossover(conversion line, baseline) above the Kumo Cloud = Strong Buy
crossover(conversion line, baseline) below the Kumo cloud = Weak Buy
crossunder(conversion line, baseline) below the Kumo Cloud = Strong Sell
crossunder(conversion line, baseline) above the Kumo Cloud = Weak Sell
3. Kumo Cloud Breakout
When the price enters the Kumo Cloud, and breaks its Upper wall upward = Bullish Signal
When the price enters the Kumo Cloud, and breaks its Lower wall downward = Bearish Signal
4. Kumo Cloud Crossover
When Span A cuts the Span B from below to the upside and prices are positioned above the Kumo Cloud = Strong Buy Signal
When Span A cuts the Span B from upside to the bottom and the prices are positioned below the Kumo Cloud = Strong Sell
When Span A cuts Span B from bottom to the upside and prices are positioned below the Kumo Cloud = Weak Buy Signal
When Span A cuts Span B from the upside to the bottom and the prices are positioned above the Kumo Cloud = Weak Sell Signal.
NOTE:- Some of the signals collide with each other, but they collide for the same call, so shouldn't really be a problem overall. Let me know if you have any suggestions to nullify the trading Range. Though I do plan on adding my Renko code to it for filtering out Trading Range.
Cerca negli script per "Ichimoku Cloud "

Ichimoku Cloud TimeIchimoku Cloud that will remain fixed to a time interval. Might be useful to someone wanting to use multiple Ichimoku Clouds on a single time frame.
Input values:
Daily Interval: If checked then days are used for the interval. If unchecked then minutes will be used.
Interval: The interval to use for the indicator.
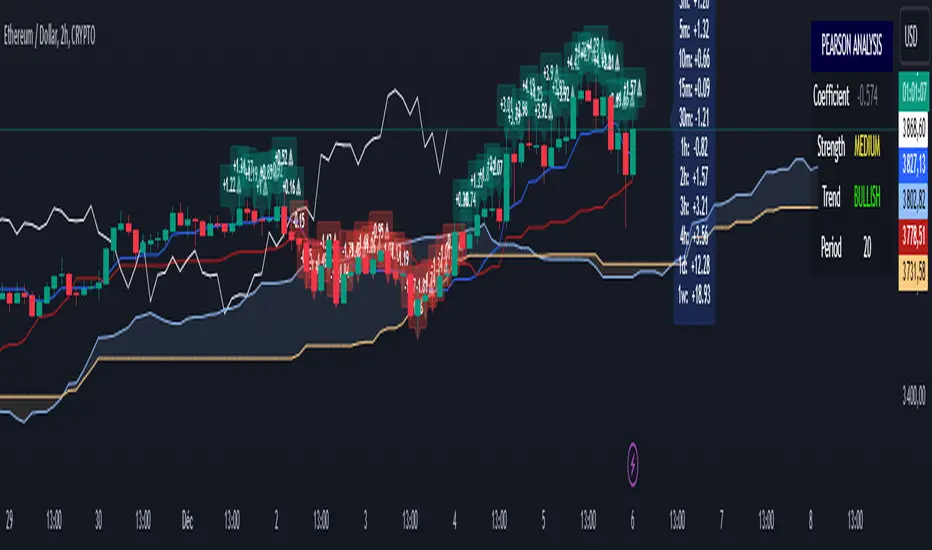
Ichimoku Cloud +Ichimoku Cloud Plus - Advanced Technical Analysis Indicator
Ichimoku Cloud Plus is an advanced technical analysis tool that combines the traditional Ichimoku Cloud system with Pearson correlation analysis and multi-timeframe momentum tracking. This innovative approach provides traders with a comprehensive view of market trends, momentum, and potential reversal points across multiple time frames.
Core Components
Enhanced Ichimoku Cloud Analysis
The traditional Ichimoku Cloud components have been preserved and enhanced with customizable visual parameters:
The indicator includes:
- Conversion Line (Tenkan-sen) - Short-term trend identifier
- Base Line (Kijun-sen) - Medium-term trend identifier
- Leading Span A and B (Senkou Span A and B) - Future cloud projections
- Lagging Span (Chikou Span) - Historical price momentum confirmation
The cloud (Kumo) formations provide dynamic support and resistance levels, with color-coding to instantly identify bullish and bearish market conditions.
Pearson Correlation Analysis
A sophisticated Pearson correlation coefficient calculation has been integrated to provide statistical validation of trend strength and direction. This component:
- Calculates correlation between price movement and time
- Provides real-time correlation coefficients
- Identifies trend strength through correlation thresholds
- Generates signals for trend changes and potential reversals
Multi-Timeframe Momentum Tracking
The indicator incorporates a unique multi-timeframe analysis system that:
- Displays momentum calculations across five timeframes (15m, 30m, 1h, 4h, 1d)
- Provides percentage-based momentum values
- Includes volatility adjustment capabilities
- Offers volume-weighted calculations for enhanced accuracy
Advanced Features
Statistical Analysis Panel
A comprehensive statistical panel provides real-time analysis including:
- Current Pearson coefficient value
- Correlation strength classification
- Trend direction identification
- Analysis period information
Dynamic Alert System
The indicator includes sophisticated alert conditions for:
- Bearish trend initiation (positive correlation threshold breach)
- Bullish trend initiation (negative correlation threshold breach)
- Trend direction changes (zero-line crossovers)
Visual Optimization
Advanced visualization features include:
- Customizable color schemes for all components
- Adjustable label sizes and positions
- Transparency controls for better chart visibility
- Warning indicators for potential trend weakening
Technical Implementation
The indicator combines multiple calculation methods:
- Donchian Channel calculations for Ichimoku components
- Pearson correlation coefficient computation with customizable periods
- EMA smoothing for momentum calculations
- Volume-weighted averaging capabilities
- Volatility adjustment mechanisms
Trading Applications
This indicator is particularly effective for:
1. Trend Direction Confirmation
- Multiple timeframe analysis provides comprehensive trend validation
- Pearson correlation adds statistical confidence to trend identification
- Ichimoku cloud formations confirm support and resistance levels
2. Entry and Exit Point Identification
- Cloud breakouts combined with correlation strength indicate potential entry points
- Multi-timeframe momentum alignment helps identify high-probability trades
- Warning indicators assist in timing market exits
3. Risk Management
- Dynamic support and resistance levels from the cloud
- Statistical trend strength measurement
- Multi-timeframe confirmation reduces false signals
Performance Considerations
The indicator uses efficient calculations to maintain good performance while providing comprehensive analysis. The smoothing parameters and analysis periods can be adjusted to balance between responsiveness and reliability.
Future Applications and Research
This combination of indicators opens possibilities for:
- Machine learning integration for pattern recognition
- Additional statistical measures for trend validation
- Enhanced alert systems based on multiple condition combinations
- Further optimization of calculation methods
The innovative combination of traditional Ichimoku analysis with modern statistical methods and multi-timeframe momentum tracking provides traders with a powerful tool for market analysis and decision-making.
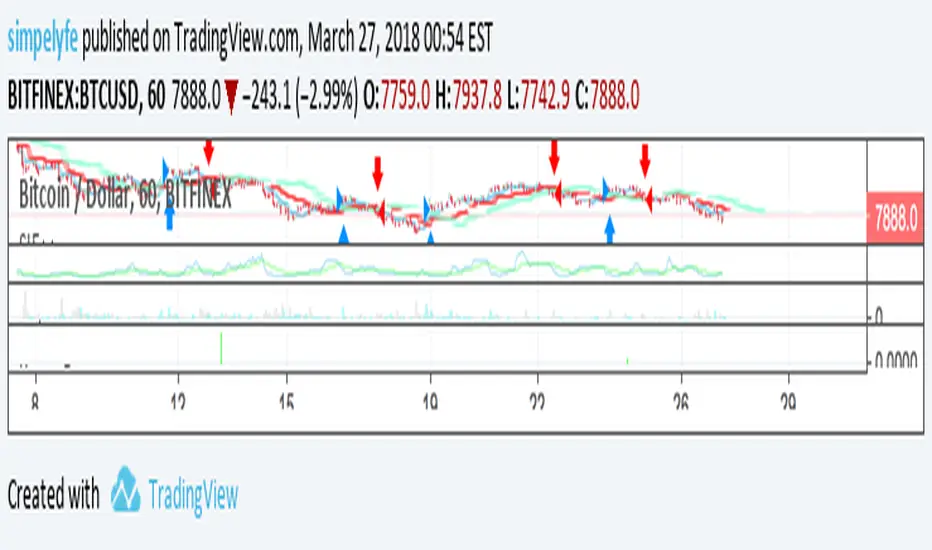
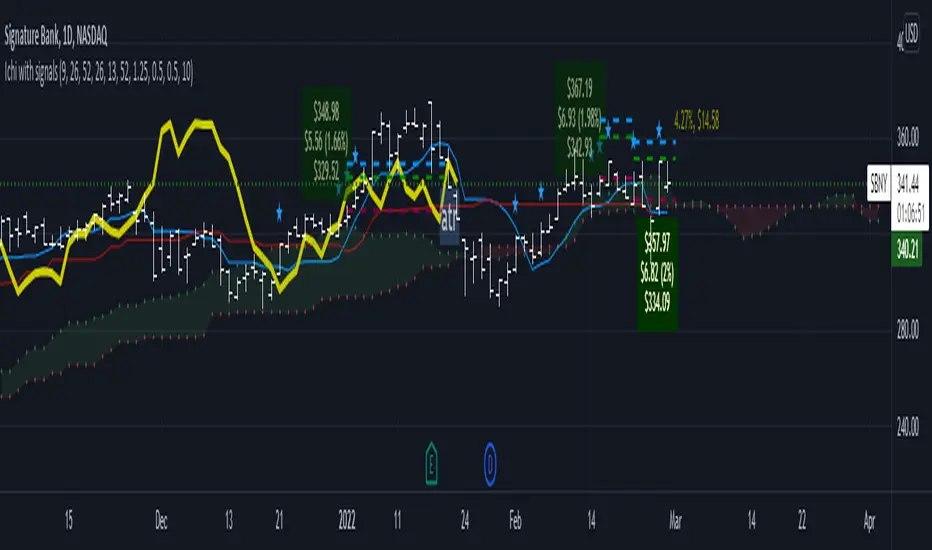
Ichimoku Cloud Crosses_AITIchimoku Cloud Crosser_AIT
The "Ichimoku Cloud Crosses_AIT" indicator is designed to leverage the Ichimoku Cloud components, focusing on the crossovers between the Tenkan-sen and Kijun-sen lines. This indicator visually displays these crossovers on the price chart to help traders identify potential long and short trading opportunities.
1. Indicator Components
Ichimoku Cloud Elements
Tenkan-sen (Conversion Line): A short-term trend indicator. It is the midpoint of the highest high and the lowest low over a specified period (tenkanLength). In this indicator, the default period is set to 21.
Kijun-sen (Base Line): A medium-term trend indicator. It is the midpoint of the highest high and the lowest low over the specified period (kijunLength). In this indicator, the default period is set to 120.
Senkou Span A and B: These components are part of the traditional Ichimoku Cloud, but they are not directly plotted in this version of the indicator.
Chikou Span (Lagging Span): This component is included in the calculation but is not plotted in this indicator version.
2. Signal Conditions
Long Signal
Condition: A long signal is generated when the Tenkan-sen crosses above the Kijun-sen.
Visual Representation: Displayed as a yellow triangle below the price bar.
Short Signal
Condition: A short signal is generated when the Tenkan-sen crosses below the Kijun-sen.
Visual Representation: Displayed as a fuchsia triangle above the price bar.
3. How to Use the Indicator
Add the Indicator: Apply the "Ichimoku Cloud Crosses_AIT" indicator to your chart in TradingView.
Adjust Parameters: You can customize the periods for the Tenkan-sen, Kijun-sen, Senkou Span A, Senkou Span B, and Chikou Span in the indicator's settings.
Interpret the Signals:
Long Signal: Look for a yellow triangle below the bar, indicating a potential bullish crossover (Tenkan-sen crossing above Kijun-sen).
Short Signal: Look for a fuchsia triangle above the bar, indicating a potential bearish crossover (Tenkan-sen crossing below Kijun-sen).
Conclusion
The "Ichimoku Cloud Crosses_AIT" indicator provides a clear visualization of the crossovers between the Tenkan-sen and Kijun-sen lines on the price chart. This tool helps traders quickly identify potential bullish and bearish signals, making it a valuable addition to any trading strategy. Adjust the settings and parameters as needed to fit your specific trading style and market conditions.

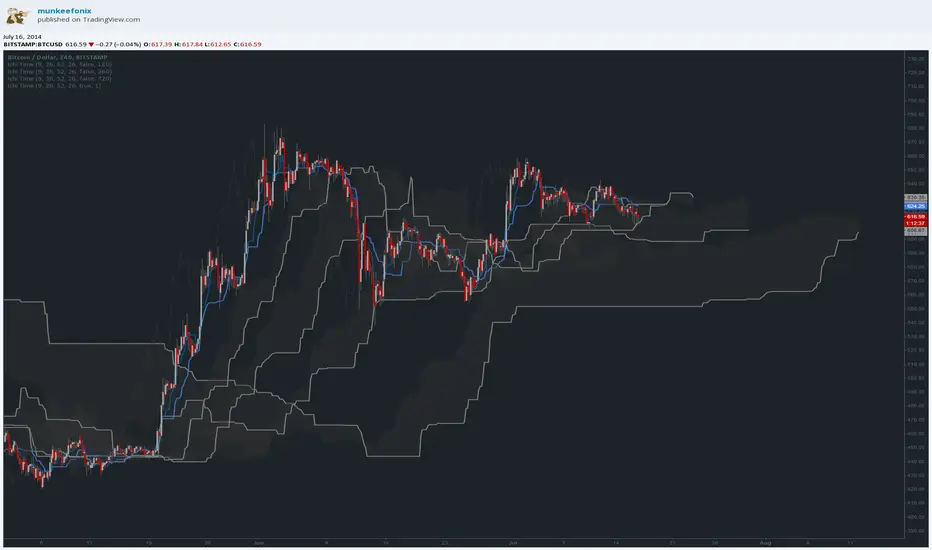
Ichimoku Cloud MasterIchimoku Cloud Master aims to provide the ichimoku trader with easy alert functionality to not miss out on valuable trade setups. The key purpose of this script is to better visualise crucial moments in Ichimoku trading. These alerts should not be used for botting in my opinion as they always need a human to confirm the ichimoku market structure. For example, is the Kijun-Sen flat and too far away from price? A good ichimoku trader will not enter at such a point in time.
Explanation of script:
Chikou(lagging span): pink line, this is price plotted 26 bars ago. People ignore the power of this it is crucial to see how chikou behaves towards past price action as seen in the chart below where we got an entry at red arrow because chikou bounced from past fractal bottom.
Kijun-Sen(base line): Black line or color coded line. This is the equilibrium of last 26 candles. To me this is the most important line in the system as it attracts price.
Kijun = (Highest high of 26 periods + Lowest low of 26 periods) ÷ 2
Tenkan-Sen(conversion line): Blue line. This is the equilibrium of last 9 candles. In a strong uptrend price stays above this line.
Tenkan = (Highest high of 9 periods + Lowest low of 9 periods) ÷ 2
Senkou A (Leading span A)= Pink cloud line, this is the average of the 2 components projected 26 bars in the future.
Senkou A = (Tenkan + Kijun) ÷ 2
Senkou B (Leading span B) = Green cloud line, this is the 52 day equilibrium projected 26 bars in the future.
Senkou B = (Highest high of prior 52 periods + Lowest low of prior 52 periods) ÷ 2
Notice how the distance between Chikou and the cloud is also 52 bars. This is all part of Hosoda's numbers which I am not going to explain here.
Fractals: These are the black triangles you find at key turning point. If you want to know how they work reseach williams fractals. I've used fractals with a period of 9 as it is an ichimoku number. These fractals are useful when working with ichimoku wave theory. Again I will not explain that here but in further education
Fractal Support: Ability to extend lines from the fractals which can be used as an entry/exit mechanism in your trading. For example wait for tenkan to cross kijun and then enter on fractal breakout.
Signals:
Crossing of Chikou (lagging span) with past Kijun-Sen: this will color code the Bars / Kijun-Sen (you can turn this off in options)
The script also has a signal for this, this will be the green and purple diamonds. Where green is bullish and purple is bearish.
wy is this important?
When current price plotted 26 candles back (chikou) crosses over the past equilibrium (kijun-sen) this usualy means price has moved past resistance levels where sellers come in. This indicates a switch in market structure and price is bullish from this point, this is the same in the other direction.
Kumo Twist: when the kumo cloud (future) has a crossover from for example green to red (bull to bear). The script plots these using the colored cross symbols as seen in the picture above. A chikou cross + a Kumo twist at same bar of next to eachother below the cloud can be a great entry sign: this would be an entry after cross in the chart above.
Kijun Bounce: when in an uptrend the price retraces back to Kijun-Sen and starts to go back up. These are marked by the yellow circles as seen in chart below:
low below Kijun-Sen and close above it
Strong Trend: when Tenkan is above Kijun, price above cloud, future cloud green, chikou above close, chikou above Kijun we establish a strong bullish trend. For bearish the exact opposite. The script has a function to send an alert at the start of such trends and to plot them with small colored circles above the bars.
Customisation:
I've added options to disable specific aspects of the indicator for those traders who do not want to use all aspects of the indicator. In the customisation tab I've given each part a clear title so you can use your own colors/shapes.
The perfect entry?
Further info:
Look into my education pane, I will be adding education in the future. The chance of me making a more advanced version of the script including line forecasting etc is rather high so watch out for that.
For those who want to master this system I recommend reading the book:
How to make money with the ichimoku system by Balkrishna M. Sadekar
Or the originals books by Hosoda the inventor of Ichimoku if you can get your hands on them and can read Japanese.
Almost all info about the ichimoku system you find on the internet will lose you money because they reduce the system to simple signals that do not generate money.
I will be providing educational material on tradingview using this indicator.

Ichimoku Cloud+quality lineIchimoku Cloud+quality line
this is ichimoku indicator, only quality line added.
Ichimoku Cloud setup OualidIchimoku Cloud setup Oualid
plus sûr dans les trades
Mieux addapté non agressif


Ichimoku Cloud - Stays on 4 hourichimoku cloud that does not leave the 4 hour + doesnt show up at all above 4 hour

Ichimoku Cloud w/SelIchimoku Cloud with selection for:
Regular:
conversionPeriods = 9,
basePeriods = 26
laggingSpan2Periods = 52,
displacement = 26
Crypto:
conversionPeriods = 10,
basePeriods = 30,
laggingSpan2Periods = 60,
displacement = 30
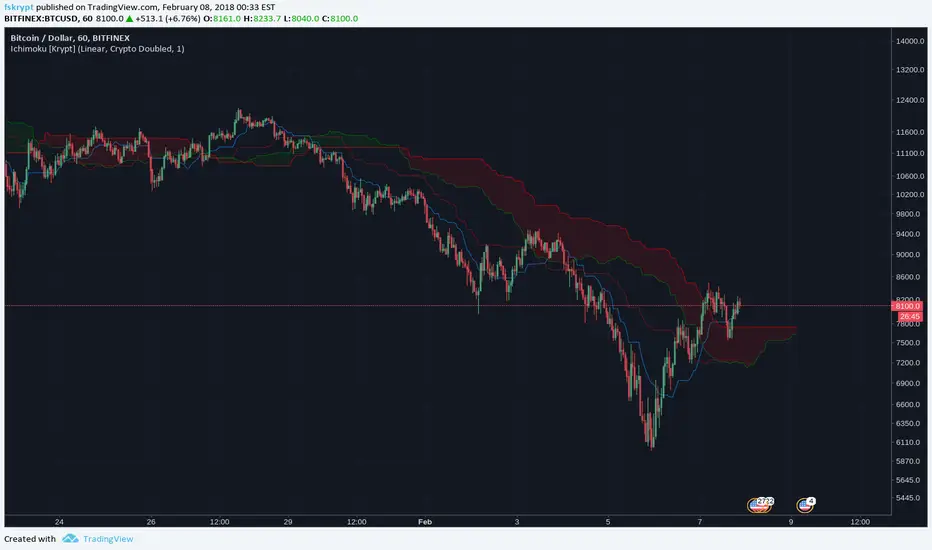
Crypto Doubled:
conversionPeriods = 20,
basePeriods = 60,
laggingSpan2Periods = 120,
displacement = 30

Ichimoku Cloud Signals [sgbpulse] Ichimoku Cloud Signals – Your Advanced Trading Tool
Meet Ichimoku Cloud Signals, the enhanced and interactive version of the classic Ichimoku Cloud indicator, designed specifically for TradingView traders seeking precision and flexibility in their trading decisions. This indicator allows you to maximize the Ichimoku's potential by customizing trend criteria, receiving clear visual signals for entering and exiting positions, and getting alerts to keep you informed.
Introduction to the Ichimoku Cloud
The Ichimoku Cloud, also known as Ichimoku Kinko Hyo, is a comprehensive technical analysis tool developed in Japan. It provides a broad view of the market: trend direction, momentum, and support and resistance levels. "Ichimoku Cloud Signals" takes this power and amplifies it with advanced features.
Key Components of the Ichimoku Cloud
The indicator displays all five familiar Ichimoku lines, along with the "Cloud" (Kumo):
Tenkan-sen (Conversion Line): Calculated as the average of the highest high and lowest low over the past 9 periods. A fast, short-term indicator used as a measure of immediate momentum.
Kijun-sen (Base Line): Calculated as the average of the highest high and lowest low over the past 26 periods. A medium-term reference line serving as a significant support/resistance level.
Senkou Span A (Leading Span A): The average of the Tenkan-sen and Kijun-sen, shifted 26 periods forward into the future.
Senkou Span B (Leading Span B): The average of the highest high and lowest low over the past 52 periods, also shifted 26 periods forward into the future.
Kumo (Cloud): The area between Senkou Span A and Senkou Span B. Its color changes: green for an uptrend (when Senkou Span A is above Senkou Span B) and red for a downtrend (when Senkou Span B is above Senkou Span A). The Cloud serves as a dynamic area of support/resistance and a tool for forecasting future trends.
Chikou Span (Lagging Span): The current closing price, shifted 26 periods backward into the past. It serves as a powerful trend confirmation tool.
How the Ichimoku Cloud Works and How to Interpret It
Trend Identification :
- Uptrend (Bullish): The price is above the Cloud. The higher the price is above the Cloud, the stronger the trend.
- Downtrend (Bearish): The price is below the Cloud. The lower the price is below the Cloud, the stronger the trend.
- Range/Consolidation: The price is within the Cloud. This indicates a market without a clear direction or one that is consolidating.
Support and Resistance:
- The Cloud itself acts as a dynamic area of support and resistance. In an uptrend, the Cloud serves as support. In a downtrend, it serves as resistance.
- A thick Cloud indicates stronger support/resistance levels, while a thin Cloud indicates weaker levels.
The Cloud as a Predictive Indicator:
The uniqueness of the Kumo (Cloud) lies in its ability to be shifted 26 periods forward. This part of the Cloud provides forecasts for future support and resistance levels and even suggests expected trend changes (like a "Kumo Twist" – a change in Cloud color), giving you a planning advantage.
Unique Advantages of Ichimoku Cloud Signals:
Ichimoku Cloud Signals takes the classic Ichimoku principles and gives you unprecedented control:
Focused Trend Selection:
Choose whether you want to analyze a bullish (uptrend) or bearish (downtrend) trend. The indicator will focus on the relevant criteria for your selection.
Customizable Trend Confirmation Criteria (8 Criteria):
The indicator relies on 8 key criteria for clear trend confirmation. You can enable or disable each criterion individually based on your trading strategy and desired risk level. Each criterion plays a vital role in confirming the strength of the trend:
- Price position relative to the Cloud (Kumo) (Default: true): Determines the main trend direction and whether it's bullish or bearish.
- Price position relative to Kijun-sen (Base Line) (Default: true): Indicates the medium-term trend and acts as a critical equilibrium level.
- Price position relative to Tenkan-sen (Conversion Line) (Default: false): Provides quick confirmation of current momentum and short-term market changes.
- Tenkan-sen (Conversion Line) / Kijun-sen (Base Line) Crossover (Default: true): A classic signal for momentum change, crucial for identifying entry points.
- Current Cloud trend (Kumo) (Default: false): Cloud color confirms the main trend direction in real-time.
- Projected Future Cloud trend (Kumo) (Default: true): Indicates an expected future change in the Cloud's trend, providing strong visual insight.
- Chikou Span (Lagging Span) position relative to the Cloud (Kumo) (Default: true): Confirms the current trend strength by comparing the price to the Ichimoku 26 periods ago.
- Chikou Span (Lagging Span) position relative to the Price (Default: false): Additional confirmation of trend strength, indicating buyer/seller dominance.
Full Customization of Ichimoku Parameters:
You can change the period lengths for each Ichimoku component, depending on your strategy:
- Conversion Line Length (Default: 9)
- Base Line Length (Default: 26)
- Leading Span Length (Default: 52)
- Cloud Lagging Length (Default: 26)
- Lagging Span Length (Default: 26)
Visual Criteria Table on the Chart:
Get immediate and clear feedback! A visual table is placed on the chart, showing in real-time which of the 8 criteria you have defined are met for your chosen trend. Criteria you have enabled will be highlighted with a blue color and a "➤" symbol, while disabled criteria will appear in a subtle gray shade. For each criterion, the table shows its real-time status with a "✔" symbol if the condition is met and an "✘" symbol if it is not met. This powerful visual tool provides a quick assessment, helps with learning, and allows for strategy optimization at the click of a button.
Precise Criteria Details in the Data Window:
Beyond the visual table, the indicator provides an additional critical layer of detail: for any point on the chart, you can hover over a candle and see in TradingView's Data Window the precise status and values of all eight criteria. For each criterion, you'll see a clear numerical value (1 or 0) indicating whether it's fully met (1) or not met (0). Additionally, you can inspect the exact numerical values of the Ichimoku lines (Tenkan-sen, Kijun-sen, etc.) at that specific moment. This comprehensive data supports in-depth analysis, strategy debugging, and long-term optimization, providing complete transparency regarding every component of the signal.
Smart and Customizable Alerts:
Ichimoku Cloud Signals provides a powerful alert system to keep you informed of key market movements, so you never miss an opportunity. There are eight unique alerts you can enable in TradingView's alert panel:
Uptrend Entry Alert: Triggers when all of your selected criteria for an uptrend are met on a new candle.
Uptrend Exit Alert: Triggers when one of your selected uptrend criteria is no longer met, signaling a potential exit point.
Downtrend Entry Alert: Triggers when all of your selected criteria for a downtrend are met on a new candle.
Downtrend Exit Alert: Triggers when one of your selected downtrend criteria is no longer met, signaling a potential exit point.
Bullish Crossover Alert: Triggers when the Conversion Line (Tenkan-sen) crosses above the Base Line (Kijun-sen), a classic signal for an upward momentum shift.
Bearish Crossover Alert: Triggers when the Conversion Line (Tenkan-sen) crosses below the Base Line (Kijun-sen), signaling a potential shift to downward momentum.
Bullish Cloud Breakout Alert: Triggers when the price closes above the Ichimoku Cloud (Kumo), indicating a strong bullish trend.
Bearish Cloud Breakout Alert: Triggers when the price closes below the Ichimoku Cloud (Kumo), indicating a strong bearish trend.
Each alert can be independently configured in TradingView's alert panel, allowing you to tailor your notifications to fit your exact trading strategy and risk management preferences.
Summary:
Ichimoku Cloud Signals is an essential tool for TradingView traders seeking control, clarity, and precision. It combines the power of the classic Ichimoku Cloud indicator with advanced customization capabilities, a convenient visual table, and clear signals, empowering you to make informed trading decisions and stay focused on managing your positions.
Important Note: Trading Risk
This indicator is intended for educational and informational purposes only and does not constitute investment advice or a recommendation for trading in any form whatsoever.
Trading in financial markets involves significant risk of capital loss. It is important to remember that past performance is not indicative of future results. All trading decisions are your sole responsibility. Never trade with money you cannot afford to lose.

Ichimoku Cloud x10 - Time fixedDraws up to ten ichimoku clouds, timeframe independant.
Just select your ichi settings, and which timescales you want to see. Enter 0 to disable, if you want less than 10 clouds.

Ichimoku Cloud DistanceAn alternative way to look at the Ichimoku Cloud with various modes:
Distance to Center: the various lines of the Ichimoku system are displayed as the distance to the center of the cloud in percentage terms. 0 is the center of the cloud.
Distance to Edge: lines are displayed as the distance to the closest edge of the cloud in percentage terms. values inside the cloud are displayed as 0.
Hybrid: values outside of the cloud behave as the 'Distance to Edge' mode, values inside behave as 'Distance to Center' mode. The values outside the cloud are scaled by the supplied scale factor in order to make things more readable. Best value for this scale factor is chart/timeframe dependent. The interval from -1 to 1 is equivalent to the bottom and top of the cloud respectively; 0 is the center.
The background color is the color of the cloud.

Ichimoku Clouds - Basic StrategyEstratégia básica com Ichimoku Clouds. Mais para fins de estudos. Foi um dos primeiros Pine Scripts que escrevi, então a há muito o que melhorar no código.
Basic Strategy using Ichimoku Clouds, developed for studying purpose. It was one one my first Pine Scripts codes, so yet there is a lot to improve on it.

Ichimoku cloud clustersThe intention of this script is to get a quick and redundant overview of Ichimoku clouds of relevant time frames to spot clusters as strong support and resistance levels.
The script displays the Ichimoku cloud of the current time frame and the clouds of the supported higher time frames. Clouds of lower time frames are not displayed.
Ichimoku Cloud LONG and SHORT indicatorsThis simple script uses 4 rules from Ichimoku Cloud indicator to marks position entry points.
The idea is that by entering a long position just when these 4 criteria are met, you can capture a 2-3% plus move within the next few days:
1. The conversion line is above the base line
2. The price is above the clouds
3. The lagging span is above the clouds
4. The rightmost cloud is green
The same 4 criteria but inverted will indicate a short entry.
In order to avoid 'stale' entries which can lead to chasing, we want the price and conversion line crossovers to be recent, within the past few days. Ideally we want to enter before close on the day the entry signal is given so that we can capture any potential gap up (or down if short). Often the price will make a nice move the next day or day after. If any of the criteria become invalidated, or if after 4-5 days there hasn't been significant movement, then it was a false alarm.
This script will show the basic Ichimoku Cloud indicators, plus labels for bearish and bullish price and conversion line crossovers as well as LONG and SHOT indicators to show when the entry criteria have been met.
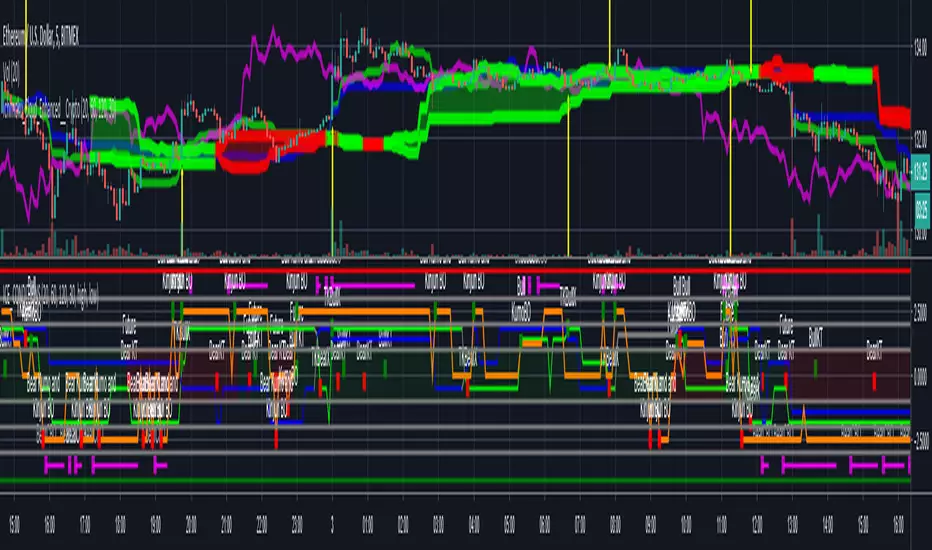
Ichimoku Cloud Enhanced - Conditions IndicatorOriginal Cloud code base from "Ichimoku Cloud Enhanced For Crypto"
Link here
At a glance simplified rendering of ichimoku cloud elements and algorithmic detection of all ichimoku cloud events. Has alert conditions for all/most events you would want.
Central red/green band represents the cloud and the current "future" cloud colour.
Kumo Twists are shown for when they are both below/above the current candle and for when they first appear in the "future" cloud.
Orange line represents close and it's relative position to the cloud and Kinjun.
Tenkan and Kinjun, crosses and relative position to the cloud (blue/green lines). Will show crosses if they occurred above/in/below the cloud etc.
Chikouspan Breakouts (above/below cloud & price action) fuchsia lines.
It should have all the logic required to build a strategy from IC conditions by combining them however you want.
-------------------------------------------------------
If you find it useful please consider a tip/donation to the rumpy liquidation recovery fund : BTC - 3BMEXEDyWJ58eXUEALYPadbn1wwWKmf6sA
Ichimoku Clouds Strategy Long and ShortOverview:
The Ichimoku Clouds Strategy leverages the Ichimoku Kinko Hyo technique to offer traders a range of innovative features, enhancing market analysis and trading efficiency. This strategy is distinct in its combination of standard methodology and advanced customization, making it suitable for both novice and experienced traders.
Unique Features:
Enhanced Interpretation: The strategy introduces weak, neutral, and strong bullish/bearish signals, enabling detailed interpretation of the Ichimoku cloud and direct chart plotting.
Configurable Trading Periods: Users can tailor the strategy to specific market windows, adapting to different market conditions.
Dual Trading Modes: Long and Short modes are available, allowing alignment with market trends.
Flexible Risk Management: Offers three styles in each mode, combining fixed risk management with dynamic indicator states for versatile trade management.
Indicator Line Plotting: Enables plotting of Ichimoku indicator lines on the chart for visual decision-making support.
Methodology:
The strategy utilizes the standard Ichimoku Kinko Hyo model, interpreting indicator values with settings adjustable through a user-friendly menu. This approach is enhanced by TradingView's built-in strategy tester for customization and market selection.
Risk Management:
Our approach to risk management is dynamic and indicator-centric. With data from the last year, we focus on dynamic indicator states interpretations to mitigate manual setting causing human factor biases. Users still have the option to set a fixed stop loss and/or take profit per position using the corresponding parameters in settings, aligning with their risk tolerance.
Backtest Results:
Operating window: Date range of backtests is 2023.01.01 - 2024.01.04. It is chosen to let the strategy to close all opened positions.
Commission and Slippage: Includes a standard Binance commission of 0.1% and accounts for possible slippage over 5 ticks.
Maximum Single Position Loss: -6.29%
Maximum Single Profit: 22.32%
Net Profit: +10 901.95 USDT (+109.02%)
Total Trades: 119 (51.26% profitability)
Profit Factor: 1.775
Maximum Accumulated Loss: 4 185.37 USDT (-22.87%)
Average Profit per Trade: 91.67 USDT (+0.7%)
Average Trade Duration: 56 hours
These results are obtained with realistic parameters representing trading conditions observed at major exchanges such as Binance and with realistic trading portfolio usage parameters. Backtest is calculated using deep backtest option in TradingView built-in strategy tester
How to Use:
Add the script to favorites for easy access.
Apply to the desired chart and timeframe (optimal performance observed on the 1H chart, ForEx or cryptocurrency top-10 coins with quote asset USDT).
Configure settings using the dropdown choice list in the built-in menu.
Set up alerts to automate strategy positions through web hook with the text: {{strategy.order.alert_message}}
Disclaimer:
Educational and informational tool reflecting Skyrex commitment to informed trading. Past performance does not guarantee future results. Test strategies in a simulated environment before live implementation

Ichimoku Cloud Pro [CongTrader]📌 Description (dùng khi publish)
Ichimoku Cloud Pro
This script is a customized version of the Ichimoku Cloud with additional features for flexibility and clarity in trading analysis.
It includes:
Multiple built-in presets (Default, Crypto, Scalping, Forex).
Optional higher timeframe EMA filter for trend confirmation.
Buy/Sell/TP/SL signal labels.
Clear visualization of Ichimoku lines and cloud.
Info table for real-time status display.
📖 How to use
Add the indicator to your chart.
Choose your preferred preset (Crypto, Forex, Scalping, or Default).
Optionally enable the HTF EMA filter to trade only in the major trend direction.
Look for confluence:
Cloud color change (bullish/bearish).
Tenkan/Kijun cross.
Chikou span confirmation.
Use the built-in signals as a visual aid, not as a standalone trading system.
Combine with your own risk management and trading strategy.
⚠️ Disclaimer
This indicator is provided for educational and research purposes only.
It does not guarantee profits and should not be considered financial advice.
Always backtest and practice proper risk management before applying to live trading.
The author takes no responsibility for any financial losses incurred from using this script.
🙏 Acknowledgment
Thank you for using Ichimoku Cloud Pro .
Your support and feedback are greatly appreciated. Wishing you success in your trading journey! 🚀 #Ichimoku #IchimokuCloud #Trading #Forex #Crypto #Scalping #Trend #Indicator #CongTrader

Ichimoku Clouds with Trend IdentificationThis is another version of the Ichimoku Clouds indicator where I have added logic to evaluate the current chart as either Bullish, Bearish, or Mixed, depending on 4 factors:
1. Is the price above/below the cloud?
2. Is the conversion line above/below the base line?
3. Is the lagging span above/below the cloud?
4. Is the rightmost cloud green/red?
If all conditions point the same direction, then the chart will be labelled "Bullish" or "Bearish". Otherwise it will be labelled "Mixed".

Ichimoku Clouds Strong Bullish/Bearish signals and alertsIchimoku Clouds Strong Bullish/Bearish signals with allerts
The Ichimoku cloud was developed by Goichi Hosoda, a Japanese journalist, and published in the late 1960s. It provides more data points than the standard candlestick chart. While it seems complicated at first glance, those familiar with how to read the charts often find it easy to understand with well-defined trading signals.
We provide you easy-to-use script which helps to decrypt meaning of lines in the indicator. The script takes Ichimoku clouds indicator formulas to calculate Tenkan, Kijun, SenkouA, SenkouB values and examines them in order to produce buy ( Bullish ) and sell ( Bearish ) signals which are displayed at the chart
The most appropriate time frame is 30m
Custom alerts are added to send you a notice with a webhook when bullish or bearish signal arrives.
You can easily add weak and neutral signals alerts by removing "//" in a specified place
Feel free to copy and use this script for your ideas and trading. You can modify the script by adding Parabolic SAR in order to increase accuracy of positions closure
