Keltner Channel Based Grid Strategy # KC Grid Strategy - Keltner Channel Based Grid Trading System
## Strategy Overview
KC Grid Strategy is an innovative grid trading system that combines the power of Keltner Channels with dynamic position sizing to create a mean-reversion trading approach. This strategy automatically adjusts position sizes based on price deviation from the Keltner Channel center line, implementing a systematic grid-based approach that capitalizes on market volatility and price oscillations.
## Core Principles
### Keltner Channel Foundation
The strategy builds upon the Keltner Channel indicator, which consists of:
- **Center Line**: Moving average (EMA or SMA) of the price
- **Upper Band**: Center line + (ATR/TR/Range × Multiplier)
- **Lower Band**: Center line - (ATR/TR/Range × Multiplier)
### Grid Trading Logic
The strategy implements a sophisticated grid system where:
1. **Position Direction**: Inversely correlated to price position within the channel
- When price is above center line → Short positions
- When price is below center line → Long positions
2. **Position Size**: Proportional to distance from center line
- Greater deviation = Larger position size
3. **Grid Activation**: Positions are adjusted only when the difference exceeds a predefined grid threshold
### Mathematical Foundation
The core calculation uses the KC Rate formula:
```
kcRate = (close - ma) / bandWidth
targetPosition = kcRate × maxAmount × (-1)
```
This creates a mean-reversion system where positions increase as price moves further from the mean, expecting eventual return to equilibrium.
## Parameter Guide
### Time Range Settings
- **Start Date**: Beginning of strategy execution period
- **End Date**: End of strategy execution period
### Core Parameters
1. **Number of Grids (NumGrid)**: Default 12
- Controls grid sensitivity and position adjustment frequency
- Higher values = More frequent but smaller adjustments
- Lower values = Less frequent but larger adjustments
2. **Length**: Default 10
- Period for moving average and volatility calculations
- Shorter periods = More responsive to recent price action
- Longer periods = Smoother, less noisy signals
3. **Grid Coefficient (kcRateMult)**: Default 1.33
- Multiplier for channel width calculation
- Higher values = Wider channels, less frequent trades
- Lower values = Narrower channels, more frequent trades
4. **Source**: Default Close
- Price source for calculations (Close, Open, High, Low, etc.)
- Close price typically provides most reliable signals
5. **Use Exponential MA**: Default True
- True = Uses EMA (more responsive to recent prices)
- False = Uses SMA (equal weight to all periods)
6. **Bands Style**: Default "Average True Range"
- **Average True Range**: Smoothed volatility measure (recommended)
- **True Range**: Current bar's volatility only
- **Range**: Simple high-low difference
## How to Use
### Setup Instructions
1. **Apply to Chart**: Add the strategy to your desired timeframe and instrument
2. **Configure Parameters**: Adjust settings based on market characteristics:
- Volatile markets: Increase Grid Coefficient, reduce Number of Grids
- Stable markets: Decrease Grid Coefficient, increase Number of Grids
3. **Set Time Range**: Define your backtesting or live trading period
4. **Monitor Performance**: Watch strategy performance metrics and adjust as needed
### Optimal Market Conditions
- **Range-bound markets**: Strategy performs best in sideways trending markets
- **High volatility**: Benefits from frequent price oscillations around the mean
- **Liquid instruments**: Ensures efficient order execution and minimal slippage
### Position Management
The strategy automatically:
- Calculates optimal position sizes based on account equity
- Adjusts positions incrementally as price moves through grid levels
- Maintains risk control through maximum position limits
- Executes trades only during specified time periods
## Risk Warnings
### ⚠️ Important Risk Considerations
1. **Trending Market Risk**:
- Strategy may underperform or generate losses in strong trending markets
- Mean-reversion assumption may fail during sustained directional moves
- Consider market regime analysis before deployment
2. **Leverage and Position Size Risk**:
- Strategy uses pyramiding (up to 20 positions)
- Large positions may accumulate during extended moves
- Monitor account equity and margin requirements closely
3. **Volatility Risk**:
- Sudden volatility spikes may trigger multiple rapid position adjustments
- Consider volatility filters during high-impact news events
- Backtest across different volatility regimes
4. **Execution Risk**:
- Strategy calculates on every tick (calc_on_every_tick = true)
- May generate frequent orders in volatile conditions
- Ensure adequate execution infrastructure and consider transaction costs
5. **Parameter Sensitivity**:
- Performance highly dependent on parameter optimization
- Over-optimization may lead to curve-fitting
- Regular parameter review and adjustment may be necessary
## Suitable Scenarios
### Ideal Market Conditions
- **Sideways/Range-bound markets**: Primary use case
- **Mean-reverting instruments**: Forex pairs, some commodities
- **Stable volatility environments**: Consistent ATR patterns
- **Liquid markets**: Major currency pairs, popular stocks/indices
## Important Notes
### Strategy Limitations
1. **No Stop Loss**: Strategy relies on mean reversion without traditional stop losses
2. **Capital Requirements**: Requires sufficient capital for grid-based position sizing
3. **Market Regime Dependency**: Performance varies significantly across different market conditions
## Disclaimer
This strategy is provided for educational and research purposes only. Past performance does not guarantee future results. Trading involves substantial risk of loss and is not suitable for all investors. Users should thoroughly test the strategy and understand its mechanics before risking real capital. The author assumes no responsibility for trading losses incurred through the use of this strategy.
---
# KC网格策略 - 基于肯特纳通道的网格交易系统
## 策略概述
KC网格策略是一个创新的网格交易系统,它将肯特纳通道的力量与动态仓位调整相结合,创建了一个均值回归交易方法。该策略根据价格偏离肯特纳通道中心线的程度自动调整仓位大小,实施系统化的网格方法,利用市场波动和价格振荡获利。
## 核心原理
### 肯特纳通道基础
该策略建立在肯特纳通道指标之上,包含:
- **中心线**: 价格的移动平均线(EMA或SMA)
- **上轨**: 中心线 + (ATR/TR/Range × 乘数)
- **下轨**: 中心线 - (ATR/TR/Range × 乘数)
### 网格交易逻辑
该策略实施复杂的网格系统:
1. **仓位方向**: 与价格在通道中的位置呈反向关系
- 当价格高于中心线时 → 空头仓位
- 当价格低于中心线时 → 多头仓位
2. **仓位大小**: 与距离中心线的距离成正比
- 偏离越大 = 仓位越大
3. **网格激活**: 只有当差异超过预定义的网格阈值时才调整仓位
### 数学基础
核心计算使用KC比率公式:
```
kcRate = (close - ma) / bandWidth
targetPosition = kcRate × maxAmount × (-1)
```
这创建了一个均值回归系统,当价格偏离均值越远时仓位越大,期望最终回归均衡。
## 参数说明
### 时间范围设置
- **开始日期**: 策略执行期间的开始时间
- **结束日期**: 策略执行期间的结束时间
### 核心参数
1. **网格数量 (NumGrid)**: 默认12
- 控制网格敏感度和仓位调整频率
- 较高值 = 更频繁但较小的调整
- 较低值 = 较少频繁但较大的调整
2. **长度**: 默认10
- 移动平均线和波动率计算的周期
- 较短周期 = 对近期价格行为更敏感
- 较长周期 = 更平滑,噪音更少的信号
3. **网格系数 (kcRateMult)**: 默认1.33
- 通道宽度计算的乘数
- 较高值 = 更宽的通道,较少频繁的交易
- 较低值 = 更窄的通道,更频繁的交易
4. **数据源**: 默认收盘价
- 计算的价格来源(收盘价、开盘价、最高价、最低价等)
- 收盘价通常提供最可靠的信号
5. **使用指数移动平均**: 默认True
- True = 使用EMA(对近期价格更敏感)
- False = 使用SMA(对所有周期等权重)
6. **通道样式**: 默认"平均真实范围"
- **平均真实范围**: 平滑的波动率测量(推荐)
- **真实范围**: 仅当前K线的波动率
- **范围**: 简单的高低价差
## 使用方法
### 设置说明
1. **应用到图表**: 将策略添加到您所需的时间框架和交易品种
2. **配置参数**: 根据市场特征调整设置:
- 波动市场:增加网格系数,减少网格数量
- 稳定市场:减少网格系数,增加网格数量
3. **设置时间范围**: 定义您的回测或实盘交易期间
4. **监控表现**: 观察策略表现指标并根据需要调整
### 最佳市场条件
- **区间震荡市场**: 策略在横盘趋势市场中表现最佳
- **高波动性**: 受益于围绕均值的频繁价格振荡
- **流动性强的品种**: 确保高效的订单执行和最小滑点
### 仓位管理
策略自动:
- 根据账户权益计算最优仓位大小
- 随着价格在网格水平移动逐步调整仓位
- 通过最大仓位限制维持风险控制
- 仅在指定时间段内执行交易
## 风险警示
### ⚠️ 重要风险考虑
1. **趋势市场风险**:
- 策略在强趋势市场中可能表现不佳或产生损失
- 在持续方向性移动期间均值回归假设可能失效
- 部署前考虑市场制度分析
2. **杠杆和仓位大小风险**:
- 策略使用金字塔加仓(最多20个仓位)
- 在延长移动期间可能积累大仓位
- 密切监控账户权益和保证金要求
3. **波动性风险**:
- 突然的波动性激增可能触发多次快速仓位调整
- 在高影响新闻事件期间考虑波动性过滤器
- 在不同波动性制度下进行回测
4. **执行风险**:
- 策略在每个tick上计算(calc_on_every_tick = true)
- 在波动条件下可能产生频繁订单
- 确保充足的执行基础设施并考虑交易成本
5. **参数敏感性**:
- 表现高度依赖于参数优化
- 过度优化可能导致曲线拟合
- 可能需要定期参数审查和调整
## 适用场景
### 理想市场条件
- **横盘/区间震荡市场**: 主要用例
- **均值回归品种**: 外汇对,某些商品
- **稳定波动性环境**: 一致的ATR模式
- **流动性市场**: 主要货币对,热门股票/指数
## 注意事项
### 策略限制
1. **无止损**: 策略依赖均值回归而无传统止损
2. **资金要求**: 需要充足资金进行基于网格的仓位调整
3. **市场制度依赖性**: 在不同市场条件下表现差异显著
## 免责声明
该策略仅供教育和研究目的。过往表现不保证未来结果。交易涉及重大损失风险,并非适合所有投资者。用户应在投入真实资金前彻底测试策略并理解其机制。作者对使用此策略产生的交易损失不承担任何责任。
---
**Strategy Version**: Pine Script v6
**Author**: Signal2Trade
**Last Updated**: 2025-8-9
**License**: Open Source (Mozilla Public License 2.0)
Cerca negli script per "KELTNER"

Keltner + RSI Bitcoin Futures Trading [luca_badoer]This indicator combines the power of the Keltner channel with the power of the Relative Strength Indicator (RSI). It can help understand when the market is entering a bullish or a bearish trend.
Normally a Keltner channel would reference an Exponential Moving Average (EMA) of the price. In this case the Keltner Channel in the "Keltner + RSI Bitcoin Futures Trading " references the EMA of the 14-day RSI (white line). On top of that it overlays a 7-day RSI line (blue line). This produces some signals that are particularly useful in 2h, 4h and 1 day charts. The signals consist in the 7-day RSI line (blue line) crossing the upper (green) or lower (red) Keltner channels as well as the middle (white) line. Depending on the direction of the crossing (up or down) and the RSI level (from 0 to 100) at which the crossing takes place this produces bullish or bearish signals.
Examples:
- Bullish crossing: 7-day RSI (blue) crosses both the lower (red) and middle (white) lines upwards at a low to neutral RSI level (<70%)
- Bearish crossing: 7-day RSI (blue) cross both the upper (green) and middle (white) lines downwards at a high to neutral RSI (>30%)
Recommendations:
- Better to use it in 2h, 4h, and 1-day charts, thought it can also be used in lower timeframes. Confirmations of crossings in higher time-frames provide more certainty about the direction of the move.
- Use in combination with Heikin Ashi candles and volume indicators.

Keltner Channel Volatility FilterOVERVIEW
The Keltner Channel Volatility Filter indicator is a technical indicator that gauges the amount of volatility currently present in the market. The purpose of this indicator is to filter out with-trend signals during ranging/non-trending/consolidating conditions.
CONCEPTS
This indicator assists traders in capitalizing on the assumption that trends are more likely to start during periods of high volatility compared to periods of low volatility . This is because high volatility indicates that there are bigger players currently in the market, which is necessary to begin a sustained trending move.
So, to determine whether the current volatility in the market is low, the KCVF will grey out all bars whose average price is within the Keltner Channels.
If the average price breaks out of the Keltner Channels , it is reasonable to assume we are in a high-volatility period. Thus, this is the ideal time to enter a trending trade due to the assumption that trends are more likely to start during these high-volatility periods.
HOW DO I READ THIS INDICATOR
When the candles are greyed out, don't take any trend trades since the current volatility is less than the usual volatility experienced in the market.
When the candles aren't greyed out, take all valid with-trend trades since the current volatility is greater than the usual volatility experienced in the market.

Keltner+Bollinger Squeeze [kingthies_]Keltner-Bollinger-Combo Squeeze
As you likely know, the bollinger squeeze comes from the bband indicator, a classic indicator in all forms of technical analysis, effectively measuring volatility of a given assets price movement.
There are different forms of the squeeze here on tradingview, and I've combined the Bollinger band indicator in my own strategy, to the alternative and similar appearing Keltner channels. The two work incredibly well together and I've used them in my analysis for years now as my core approach to understanding the technical side of the markets.
This tool will show users the result that i typically look for when assessing for potential volatile moves in the near future for an asset, and will highlight the chart + send an alert when the chart is something to look at and the indicator suggests incoming volatility may be in the near future.
The users will still need to assess themselves whether the squeeze they see is a bullish or bearish leaning, but the overall idea is to set it and forget it with the alert clause thats added in.
Personally i enjoy this with Heikin ashi inputs but use whichever preference you have, and all timeframes + tickers should apply here.
Cheers

Keltner Channel %KIndicator display where price is in relation to the bands of Keltner Channel (20,2)
A. Keltner Channe Info
1. Basis = EMA(close,20)
2. Upper Band = Basis + 2 x ATR(14)
3. Lower Band = Basis - 2 x ATR(14)
B. %K Info
1. %K Above 1 = Price is Above the Upper Band
2. %K Below 0 = Price is Below the Lower Band
3. %K Above 0.8 = Price is Nearing the Upper Band
4. %K Below 0.2 = Price is Nearing the Lower Band

Keltner Alım Stratejisi v6 (10, 0.5)sadece keltner kanal girdilerinin değiştirilmesiyle oluşturulmuş bir göstergedir


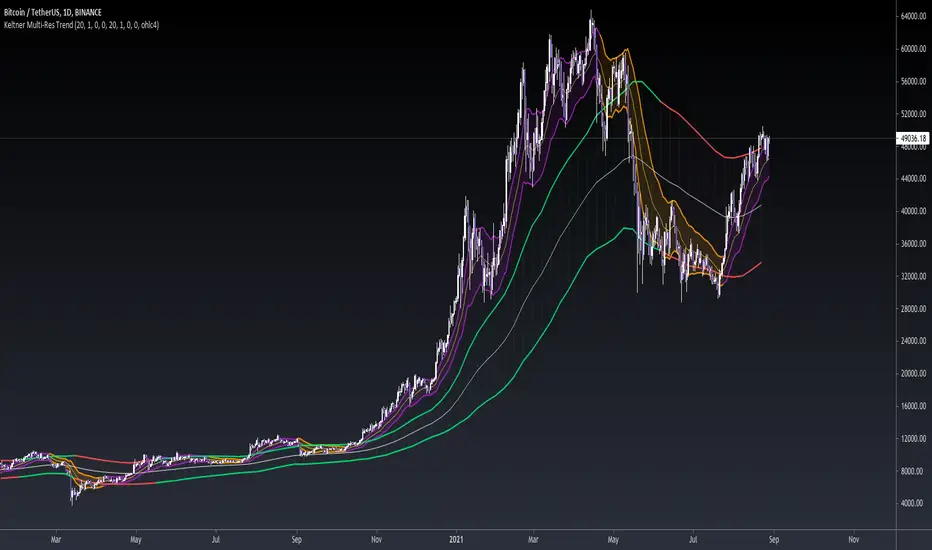
Keltner Multi-Res TrendThis is an extension of the Keltner Trend indicator by jaggedsoft. I have added a some features including an EMA / SMA option, horizontal and vertical offsets, and the addition of a second instance of the trendicator of a higher timeframe. If you want to change any timeframe, just open the code and update that section of the script. Thanks, and I hope you find it useful or interesting at least.
Keltner TrendThis indicator takes the concept of Keltner Channels and uses them as a trend following system by using a deviation band of 1 ATR, such that when the price closes above the upper band a bull trend is predicted to follow, and when the price closes below the lower band the start of a bear trend is assumed.
Only 1 band is plotted at all times depending on the bias of the trend.
Default settings are a 21 EMA as a centerline with a 13 period ATR.
Enjoy!


Keltner Channels Color BarsAnother tweak to a classic built-in script. Simply replacing the Keltner Channels overlay plot with color bars.

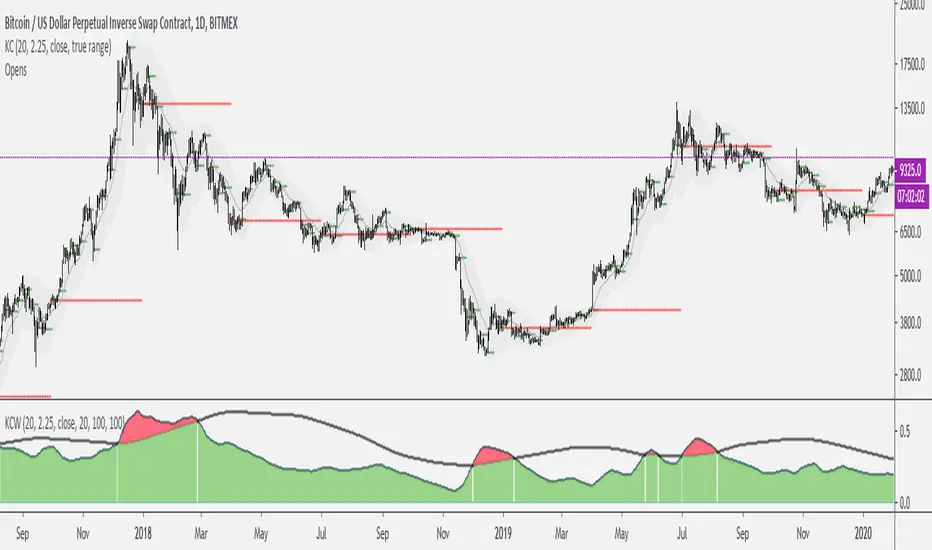
Keltner Channels WidthSimilar to bollinger bands width, but for keltner channels, designed to recognize when a move is exhausted and contraction is to be expected.
Would use it as a filter to stay out of any trades if the indicator peaks (red color).
Keltner Channel StrategyHello Friends,
i found here a Keltner Channel Strategy. But this Strategy trades LONG and SHORT.
Could some code it to long also.
If a sell condtion is true, so no short trades is initiated - only sell se long trade to be flat.
is it possible?
Thank you so much for your help!

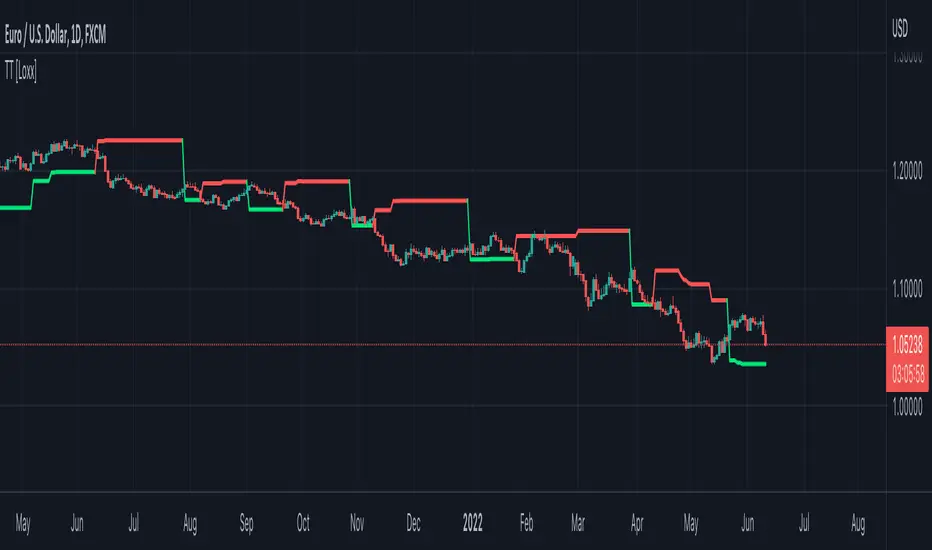
Top Trend [Loxx]Top Trend is a trend following indicator that signals breakouts and plots dynamic support and resistance levels.
Included:
-Calculation of Top Trend using either Bollinger Bands and Keltner Channels
This is an exact clone of the "TopTrend" for MT4 indicator
Channels Strategy [JoseMetal]============
ENGLISH
============
- Description:
This strategy is based on Bollinger Bands / Keltner Channel price "rebounds" (the idea of price bouncing from one band to another).
The strategy has several customizable options, which allows you to refine the strategy for your asset and timeframe.
You can customize settings for ALL indicators, Bollinger Bands (period and standard deviation), Keltner Channel (period and ATR multiplier) and ATR (period).
- AVAILABLE INDICATORS:
You can pick Bollinger Bands or Keltner Channels for the strategy, the chosen indicator will be plotted as well.
- CUSTOM CONDITIONS TO ENTER A POSITION:
1. Price breaks the band (low below lower band for LONG or high above higher band for SHORT).
2. Same as 1 but THEN (next candle) price closes INSIDE the bands.
3. Price breaks the band AND CLOSES OUT of the band (lower band for LONG and higher band for SHORT).
4. Same as 3 but THEN (next candle) price closes INSIDE the bands.
- STOP LOSS OPTIONS:
1. Previous wick (low of previous candle if LONG and high or previous candle if SHORT).
2. Extended band, you can customize settings for a second indicator with larger values to use it as STOP LOSS, for example, Bollinger Bands with 2 standard deviations to open positions and 3 for STOP LOSS.
3. ATR: you can pick average true ratio from a source (like closing price) with a multiplier to calculate STOP LOSS.
- TAKE PROFIT OPTIONS:
1. Opposite band (top band for LONGs, bottom band for SHORTs).
2. Moving average: Bollinger Bands simple moving average or Keltner Channel exponential moving average .
3. ATR: you can pick average true ratio from a source (like closing price) with a multiplier to calculate TAKE PROFIT.
- OTHER OPTIONS:
You can pick to trade only LONGs, only SHORTs, both or none (just indicator).
You can enable DYNAMIC TAKE PROFIT, which updates TAKE PROFIT on each candle, for example, if you pick "opposite band" as TAKE PROFIT, it'll update the TAKE PROFIT based on that, on every single new candle.
- Visual:
Bands shown will depend on the chosen indicator and it's settings.
ATR is only printed if used as STOP LOSS and/or TAKE PROFIT.
- Recommendations:
Recommended on DAILY timeframe , it works better with Keltner Channels rather than Bollinger Bands .
- Customization:
As you can see, almost everything is customizable, for colors and plotting styles check the "Style" tab.
Enjoy!
============
ESPAÑOL
============
- Descripción:
Esta estrategia se basa en los "rebotes" de precios en las Bandas de Bollinger / Canal de Keltner (la idea de que el precio rebote de una banda a otra).
La estrategia tiene varias opciones personalizables, lo que le permite refinar la estrategia para su activo y temporalidad favoritas.
Puedes personalizar la configuración de TODOS los indicadores, Bandas de Bollinger (periodo y desviación estándar), Canal de Keltner (periodo y multiplicador ATR) y ATR (periodo).
- INDICADORES DISPONIBLES:
Puedes elegir las Bandas de Bollinger o los Canales de Keltner para la estrategia, el indicador elegido será mostrado en pantalla.
- CONDICIONES PERSONALIZADAS PARA ENTRAR EN UNA POSICIÓN:
1. El precio rompe la banda (mínimo por debajo de la banda inferior para LONG o máximo por encima de la banda superior para SHORT).
2. Lo mismo que en el punto 1 pero ADEMÁS (en la siguiente vela) el precio cierra DENTRO de las bandas.
3. El precio rompe la banda Y CIERRA FUERA de la banda (banda inferior para LONG y banda superior para SHORT).
4. Igual que el 3 pero ADEMÁS (siguiente vela) el precio cierra DENTRO de las bandas.
- OPCIONES DE STOP LOSS:
1. Mecha anterior (mínimo de la vela anterior si es LONGy máximo de la vela anterior si es SHORT).
2. Banda extendida, puedes personalizar la configuración de un segundo indicador con valores más extensos para utilizarlo como STOP LOSS, por ejemplo, Bandas de Bollinger con 2 desviaciones estándar para abrir posiciones y 3 para STOP LOSS.
3. ATR: puedes elegir el average true ratio de una fuente (como el precio de cierre) con un multiplicador para calcular el STOP LOSS.
- OPCIONES DE TAKE PROFIT:
1. Banda opuesta (banda superior para LONGs, banda inferior para SHORTs).
2. Media móvil: media móvil simple de las Bandas de Bollinger o media móvil exponencial del Canal de Keltner .
3. ATR: se puede escoger el average true ratio de una fuente (como el precio de cierre) con un multiplicador para calcular el TAKE PROFIT.
- OTRAS OPCIONES:
Puedes elegir operar sólo con LONGs, sólo con SHORTs, ambos o ninguno (sólo el indicador).
Puedes activar el TAKE PROFIT DINÁMICO, que actualiza el TAKE PROFIT en cada vela, por ejemplo, si eliges "banda opuesta" como TAKE PROFIT, actualizará el TAKE PROFIT basado en eso, en cada nueva vela.
- Visual:
Las bandas mostradas dependerán del indicador elegido y de su configuración.
El ATR sólo se muestra si se utiliza como STOP LOSS y/o TAKE PROFIT.
- Recomendaciones:
Recomendada para temporalidad de DIARIO, funciona mejor con los Canales de Keltner que con las Bandas de Bollinger .
- Personalización:
Como puedes ver, casi todo es personalizable, para los colores y estilos de dibujo comprueba la pestaña "Estilo".
¡Que lo disfrutes!

Volatility Compression BreakoutThe Volatility Compression Breakout indicator is designed to identify periods of low volatility followed by potential breakout opportunities in the market. It aims to capture moments when the price consolidates within a narrow range, indicating a decrease in volatility, and anticipates a subsequent expansion in price movement. This indicator can be applied to any financial instrument and timeframe.
When the close price is above both the Keltner Middle line and the Exponential Moving Average (EMA), the bars are colored lime green, indicating a potential bullish market sentiment. When the close price is positioned above the Keltner Middle but below the EMA, or below the Keltner Middle but above the EMA, the bars are colored yellow, signifying a neutral or indecisive market condition. Conversely, when the close price falls below both the Keltner Middle and the EMA, the bars are colored fuchsia, suggesting a potential bearish market sentiment.
Additionally, the coloration of the Keltner Middle line and the EMA provides further visual cues for assessing the trend. When the close price is above the Keltner Middle, the line is colored lime green, indicating a bullish trend. Conversely, when the close price is below the Keltner Middle, the line is colored fuchsia, highlighting a bearish trend. Similarly, the EMA line is colored lime green when the close price is above it, representing a bullish trend, and fuchsia when the close price is below it, indicating a bearish trend.
Parameters
-- Compression Period : This parameter determines the lookback period used to calculate the volatility compression. A larger value will consider a longer historical period for volatility analysis, potentially capturing broader market conditions. Conversely, a smaller value focuses on more recent price action, providing a more responsive signal to current market conditions.
-- Compression Multiplier : The compression multiplier is a factor applied to the Average True Range (ATR) to determine the width of the Keltner Channels. Increasing the multiplier expands the width of the channels, allowing for a larger price range before a breakout is triggered. Decreasing the multiplier tightens the channels and requires a narrower price range for a breakout signal.
-- EMA Period : This parameter sets the period for the Exponential Moving Average (EMA), which acts as a trend filter. The EMA helps identify the overall market trend and provides additional confirmation for potential breakouts. Adjusting the period allows you to capture shorter or longer-term trends, depending on your trading preferences.
How Changing Parameters Can Be Beneficial
Modifying the parameters allows you to adapt the indicator to different market conditions and trading styles. Increasing the compression period can help identify broader volatility patterns and major market shifts. On the other hand, decreasing the compression period provides more precise and timely signals for short-term traders.
Adjusting the compression multiplier affects the width of the Keltner Channels. Higher multipliers increase the breakout threshold, filtering out smaller price movements and providing more reliable signals during significant market shifts. Lower multipliers make the indicator more sensitive to smaller price ranges, generating more frequent but potentially less reliable signals.
The EMA period in the trend filter helps you align your trades with the prevailing market direction. Increasing the EMA period smoothes out the trend, filtering out shorter-term fluctuations and focusing on more sustained moves. Decreasing the EMA period allows for quicker responses to changes in trend, capturing shorter-term price swings.
Potential Downsides
While the Volatility Compression Breakout indicator can provide valuable insights into potential breakouts, it's important to note that no indicator guarantees accuracy or eliminates risk. False breakouts and whipsaw movements can occur, especially in volatile or choppy market conditions. It is recommended to combine this indicator with other technical analysis tools and consider fundamental factors to validate potential trade opportunities.
Making It Work for You
To maximize the effectiveness of the Volatility Compression Breakout indicator, consider the following:
-- Combine it with other indicators : Use complementary indicators such as trend lines, oscillators, or support and resistance levels to confirm signals and increase the probability of successful trades.
-- Practice risk management : Set appropriate stop-loss levels to protect your capital in case of false breakouts or adverse price movements. Consider implementing trailing stops or adjusting stop-loss levels as the trade progresses.
-- Validate with price action : Analyze the price action within the compression phase and look for signs of building momentum or weakening trends. Support your decisions by observing candlestick patterns and volume behavior during the breakout.
-- Backtest and optimize : Test the indicator's performance across different timeframes and market conditions. Optimize the parameters based on historical data to find the most suitable settings for your trading strategy.
Remember, no single indicator can guarantee consistent profitability, and it's essential to use the Volatility Compression Breakout indicator as part of a comprehensive trading plan. Regularly review and adapt your strategy based on market conditions and your trading experience. Monitor the indicator's performance and make necessary adjustments to parameter values if the market dynamics change.
By adjusting the parameters and incorporating additional analysis techniques, you can customize the indicator to suit your trading style and preferences. However, it is crucial to exercise caution, conduct thorough analysis, and practice proper risk management to increase the likelihood of successful trades. Remember that no indicator can guarantee profits, and continuous learning and adaptation are key to long-term trading success.

Cycle-Synced Channel Breakout📌 Cycle-Synced Channel Breakout – Detect Breakouts Confirmed by Candles and Momentum Cycles
📖 Overview
The Cycle-Synced Channel Breakout indicator is a precision breakout detection tool that combines the power of:
• Adaptive Keltner Channels
• Dominant Cycle Period Analysis (Ehlers-inspired)
• Candlestick Pattern Recognition (Engulfing)
This multi-layered approach helps identify true breakout opportunities by filtering out noise and false signals, making it ideal for swing traders and intraday traders seeking high-probability directional moves.
⚙️ How It Works
1. Keltner Channel Envelope
A dynamic volatility channel based on the EMA and ATR defines the upper and lower bounds of price movement.
2. Engulfing Candle Detection
The script detects strong bullish and bearish engulfing patterns, which often signal trend reversals or momentum continuations.
3. Dominant Cycle Momentum (Ehlers-inspired)
Using a smoothed power oscillator derived from a detrended price series, the indicator assesses whether momentum is accelerating during the breakout — filtering out weak moves.
4. Signal Confirmation Logic
A signal is only shown when:
• An engulfing pattern is detected, and
• Price breaks out of the Keltner Channel, and
• Momentum (cycle power) is rising
5. Visual Feedback
• Breakout signals are plotted with “BUY” or “SELL” labels
• Faded green/red background highlights confirmed breakouts
• Optional display of engulfing candles with triangle markers
⸻
🛠️ Key Features
• ✅ Adaptive Keltner Channels
• ✅ Bullish/Bearish Engulfing Candle Recognition
• ✅ Ehlers-style Cycle Momentum Confirmation
• ✅ Background highlights for confirmed breakouts
• ✅ Optional candle pattern visualization
• ✅ Lightweight and Pine v6 compatible
⸻
🧪 Inputs
• Keltner Length – EMA period for channel basis
• Multiplier – Multiplied with ATR to determine band width
• Cycle Lookback – Used to calculate smoothed cycle power
• Show Engulfing Candles? – Toggles candlestick signals
• Show Breakout Signals? – Toggles breakout labels and backgrounds
⸻
🧠 How to Use
• Look for “BUY” or “SELL” labels when:
• An engulfing candle breaks through the Keltner Channel
• Cycle momentum confirms strength behind the move
• The background color will faintly highlight the breakout direction.
• Use in combination with other trend or volume indicators for added confluence.
🔒 Notes
• This indicator is not repainting.
• It is designed for educational and research purposes only.
• Works across all timeframes and asset classes (stocks, crypto, forex, etc.)

SSL + Wave Trend StrategyStrategy incorporates the following features:
Risk management:
Configurable X% loss per stop loss
Configurable R:R ratio
Trade entry:
Based on strategy conditions below
Trade exit:
Based on strategy conditions below
Backtesting:
Configurable backtesting range by date
Trade drawings:
Each entry condition indicator can be turned on and off
TP/SL boxes drawn for all trades. Can be turned on and off
Trade exit information labels. Can be turned on and off
NOTE: Trade drawings will only be applicable when using overlay strategies
Alerting:
Alerts on LONG and SHORT trade entries
Debugging:
Includes section with useful debugging techniques
Strategy conditions
Trade entry:
LONG
C1: SSL Hybrid baseline is BLUE
C2: SSL Channel crosses up (green above red)
C3: Wave Trend crosses up (represented by pink candle body)
C4: Entry candle height is not greater than configured threshold
C5: Entry candle is inside Keltner Channel (wicks or body depending on configuration)
C6: Take Profit target does not touch EMA (represents resistance)
SHORT
C1: SSL Hybrid baseline is RED
C2: SSL Channel crosses down (red above green)
C3: Wave Trend crosses down (represented by orange candle body)
C4: Entry candle height is not greater than configured threshold
C5: Entry candle is inside Keltner Channel (wicks or body depending on configuration)
C6: Take Profit target does not touch EMA (represents support)
Trade exit:
Stop Loss: Size configurable with NNFX ATR multiplier
Take Profit: Calculated from Stop Loss using R:R ratio
Credits
Strategy is based on the YouTube video "This Unique Strategy Made 47% Profit in 2.5 Months " by TradeSmart.
It combines the following indicators to determine trade entry/exit conditions:
Wave Trend: Indicator: WaveTrend Oscillator by @LazyBear
SSL Channel: SSL channel by @ErwinBeckers
SSL Hybrid: SSL Hybrid by @Mihkel00
Keltner Channels: Keltner Channels Bands by @ceyhun
Candle Height: Candle Height in Percentage - Columns by @FreeReveller
NNFX ATR: NNFX ATR by @sueun123

True Range ScoreTrue Range Score:
This study transforms the price similar to how z-score works. Instead of using the standard deviation to divide the difference of the source and the mean to determine the sources deviation from the mean we use the true range. This results in a score that directly relates to what multiplier you would be using with the Keltner Channel. This is useful for many applications.
One is the fact that it shows you the momentum of the price and how strong the price movement is. This is also a great metric of volatility. With this you can make a smart Keltner channel by multiplying the mean by the average true range 75th percentile of this score. I in fact do this in my automatic Keltner channel script. I hope this script is useful for you. Thank you for checking this out.
(Source - Mean)/True Range instead of (Source - Mean)/Standard Deviation
+ Magic Carpet BandsFun name for an indicator, eh? Well, it is true, I think; they look like magic carpets. They're actually pretty simple actually. They're Keltner Channels smoothed with a moving average. If you go down to the lookback period for the bands and set it to 1, you'll recognize them immediately.
Digging a bit deeper you see there are four magic carpets on the chart. The inner ones are set to a multiplier of 2, and the outer to a multiplier of 4. Each "carpet" is composed of two smoothed upper or lower Keltner Channels bounds, both with an optional offset, one of which is set to 13, and the other to 0 by default; and an optional color fill between these. There is also a color fill between the outer and inner carpets which gives them an interesting 3-dimensional aspect at times. They can look a bit like tunnels by default.
My thinking around the idea of using an offset with the bands is that if we assume these things to provide a dynamic support and resistance, and previous support and resistance maintains status as support and resistance until proven otherwise, then by putting an offset to past data we are creating a more obvious visual indication of that support or resistance in the present. The default offset is set to 13 bars back, so if price found resistance at some point around 13 bars ago, and price is currently revisiting it we assume it is still resistance, and that offset band is there to give us a strong visual aid. Obviously it's not foolproof, but nothing is.
Beyond that most interesting part of the indicator you have a nice selection of moving averages which the bands are calculated off of. By default it's set to my UMA. The bands themselves also have a selection of moving averages for how the keltner channels are smoothed. And a note: because the UMA and RDMA are averages of different length MAs, they can not be adjusted other than via the multiplier that sets the distance from the moving average.
The indicator is multi-timeframe, and the moving average can be colored based on a higher timeframe as well.
I popped in the divergence indicator here too. You can choose from RSI and OBV, and the divergences will be plotted on the chart. Working on finding a way to be able to have the bands/MA set to a higher timeframe while plotting the divergences on the chart timeframe, but don't have an answer to that yet.
Alerts for moving average crosses, band touches, and divergences.
I like this one a lot. Enjoy!
Pictures below.
s3.tradingview.com
One interesting thing about this indicator is that band twists often occur at areas of support or resistance. Simply drawing horizontal lines from previous twisted points can provide places from which you may look for strength or weakness to enter into a trade, or which you might use as targets for taking profits. The vertical lines are just showing the point on the chart when the cross occurred.
s3.tradingview.com
Above is a Jurik MA with a bunch of adjustments made to the bands, and the moving average itself. Everything is super adjustable, so you can play around and have fun with them quite a bit.
s3.tradingview.com
Just a different MA and bands.
s3.tradingview.com

Volume weighted Keltner Channels (出来高加重 KeltnerChannel)I tried to make the vertical width asymmetric with devBand by weighting the volume of Keltner Channels.
The conventional Keltner Channels was difficult to adjust when the length was increased, but the adjustment was successful with length 100.
As for how to use it, it is assumed that you will search for profit timing in the trend market.
KeltnerChannelを出来高加重しdevBandで上下幅を非対称にしてみました
従来のKeltnerChannelはlengthを大きくすると調整が困難でしたが、length 100で調整が成功しました
使い方としてはトレンド相場で利確タイミングを探るのを想定しています

MTF BB+KC Avg
Bollinger Bands (BB) are a widely used technical analysis created by John Bollinger in the early 1980’s. Bollinger Bands consist of a band of three lines which are plotted in relation to instrument prices. The line in the middle is usually a Simple Moving Average (SMA) set to a period of 20 days (The type of trend line and period can be changed by the trader; however a 20 day moving average is by far the most popular). This indicator does not plot the middle line. The Upper and Lower Bands are used as a way to measure volatility by observing the relationship between the Bands and price. Typically the Upper and Lower Bands are set to two standard deviations away from the middle line, however the number of standard deviations can also be adjusted in the indicator.
Keltner Channels (KC) are banded lines similar to Bollinger Bands and Moving Average Envelopes. They consist of an Upper Envelope above a Middle Line (not plotted in this indicator) as well as a Lower Envelope below the Middle Line. The Middle Line is a moving average of price over a user-defined time period. Either a simple moving average or an exponential moving average are typically used. The Upper and Lower Envelopes are set a (user-defined multiple) of a range away from the Middle Line. This can be a multiple of the daily high/low range, or more commonly a multiple of the Average True Range.
This indicator is built on AVERAGING the BB and KC values for each bar, so you have an efficient metric of AVERAGE volatility. The indicator visualizes changes in volatility which is of course dynamic.
What to look for
High/Low Prices
One thing that must be understood about this indicator's plots is that it averages by adding BB levels to KC levels and dividing by 2. So the plots provide a relative definition of high and low from two very popular indicators. Prices are almost always within the upper and lower bands. Therefore, when prices move up near the upper or lower bands or even break through the band, many traders would see that price action as OVER-EXTENDED (either overbought or oversold, as applicable). This would preset a possible selling or buying opportunity.
Cycling Between Expansion and Contraction
Volatility can generally be seen as a cycle. Typically periods of time with low volatility and steady or sideways prices (known as contraction) are followed by period of expansion. Expansion is a period of time characterized by high volatility and moving prices. Periods of expansion are then generally followed by periods of contraction. It is a cycle in which traders can be better prepared to navigate by using Bollinger Bands because of the indicators ability to monitor ever changing volatility.
Walking the Bands
Of course, just like with any indicator, there are exceptions to every rule and plenty of examples where what is expected to happen, does not happen. Previously, it was mentioned that price breaking above the Upper Band or breaking below the Lower band could signify a selling or buying opportunity respectively. However this is not always the case. “Walking the Bands” can occur in either a strong uptrend or a strong downtrend.
During a strong uptrend, there may be repeated instances of price touching or breaking through the Upper Band. Each time that this occurs, it is not a sell signal, it is a result of the overall strength of the move. Likewise during a strong downtrend there may be repeated instances of price touching or breaking through the Lower Band. Each time that this occurs, it is not a buy signal, it is a result of the overall strength of the move.
Keep in mind that instances of “Walking the Bands” will only occur in strong, defined uptrends or downtrends.
Inputs
TimeFrame
You can select any timeframe froom 1 minute to 12 months for the bar measured.
Length of the internal moving averages
You can select the period of time to be used in calculating the moving averages which create the base for the Upper and Lower Bands. 20 days is the default.
Basis MA Type
Determines the type of Moving Average that is applied to the basis plot line. Default is SMA and you can select EMA.
Source
Determines what data from each bar will be used in calculations. Close is the default.
StdDev/Multiplier
The number of Standard Deviations (for BB) or Multiplier (for KC) away from the moving averages that the Upper and Lower Bands should be. 2 is the default value for each indicator.

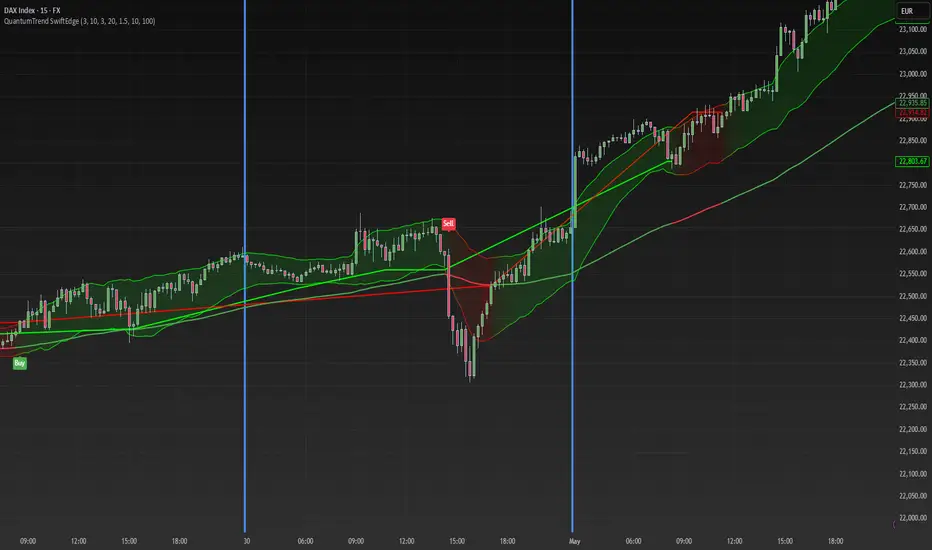
QuantumTrend SwiftEdgeQuantumTrend SwiftEdge - A Trend-Following Indicator for TradingView
Overview:
QuantumTrend SwiftEdge is a visually engaging and customizable trend-following indicator that combines the power of Supertrend, Keltner Channels, and a 100-period EMA to generate precise buy and sell signals. Designed to help traders identify trends and breakouts, this indicator offers a unique blend of technical tools with a modern gradient color effect, making it both functional and visually appealing.
What It Does:
This indicator identifies trend directions and potential entry/exit points:
- Supertrend determines the overall trend direction, showing a green line below the price during uptrends and a red line above the price during downtrends. The line only appears when the price is close to it, indicating an active trend.
- Keltner Channels highlight volatility and breakouts, with the upper and lower bands dynamically adjusting to market conditions.
- A 100-period EMA provides a longer-term trend perspective, helping to filter out noise.
- Buy and sell signals are generated when specific conditions align across these indicators, ensuring robust trade setups.
How It Works:
The indicator uses three components to generate signals:
1. **Supertrend**: Calculates trend direction using the Average True Range (ATR) and a multiplier. It switches between uptrend (green) and downtrend (red) based on price movements relative to the Supertrend line.
2. **Keltner Channels**: Consists of an EMA (default 20 periods) with upper and lower bands based on ATR. A breakout above the upper band signals potential buying opportunities, while a breakout below the lower band signals potential selling opportunities.
3. **100-period EMA**: Acts as a trend filter, ensuring signals align with the broader market direction.
**Buy Signal**:
- Price is above the 100-period EMA (bullish market).
- Price breaks above the Keltner Channel upper band (indicating a breakout).
- Supertrend switches to an uptrend (trend changes from down to up).
**Sell Signal**:
- Price is below the 100-period EMA (bearish market).
- Price breaks below the Keltner Channel lower band (indicating a breakout).
- Supertrend switches to a downtrend (trend changes from up to down).
Visual Features:
- **Gradient Colors**: Supertrend lines and Keltner Channels use a smooth gradient color transition between green (uptrend) and red (downtrend), reflecting the trend's strength. The gradient is based on a smoothed trend value, creating a visually appealing effect.
- **Keltner Channel Fill**: The area between the upper and lower Keltner Channels is filled with a transparent gradient, enhancing the trend visualization.
- **Dynamic Supertrend Visibility**: Supertrend lines only appear when the price is close to the line (within an ATR-based threshold), indicating an active trend.
How to Use:
1. Add the "QuantumTrend SwiftEdge" indicator to your chart in TradingView.
2. Customize the settings:
- **Signal Sensitivity (1=Low, 5=High)**: Default is 3. Lower values (e.g., 1) make signals less frequent by using wider parameters, while higher values (e.g., 5) make signals more frequent by tightening parameters.
- **Use Manual Settings**: If enabled, you can manually adjust all parameters (ATR Period, ATR Multiplier, Keltner Channel Length, Keltner Channel Multiplier, Keltner ATR Length, EMA Length) to fine-tune the indicator.
- **Change ATR Calculation Method**: Toggle between standard ATR calculation and a simple moving average of true range.
- **Show Buy/Sell Signals**: Toggle to show or hide buy (green "Buy" label) and sell (red "Sell" label) signals.
- **Highlighter On/Off**: Toggle to show or hide the gradient fill between the price and Supertrend line when the line is visible.
3. Interpret the signals:
- A green "Buy" label below the price indicates a potential buying opportunity.
- A red "Sell" label above the price indicates a potential selling opportunity.
- Use the Keltner Channel gradient fill and Supertrend lines to confirm the trend direction and strength.
Why This Combination?
- **Supertrend** provides a robust trend-following mechanism, ensuring signals align with the market direction.
- **Keltner Channels** add a volatility component, identifying breakouts that often precede significant price movements.
- **100-period EMA** filters out noise, ensuring signals are generated in the context of the broader trend.
Together, these indicators create a balanced approach: Supertrend and EMA confirm the trend, while Keltner Channels pinpoint actionable entry and exit points. The gradient visuals and dynamic visibility make it easier to focus on active trends.
Originality:
QuantumTrend SwiftEdge stands out with its unique features:
- Gradient color transitions for a modern, dynamic look.
- A filled gradient between Keltner Channels, visually emphasizing the trend.
- Supertrend lines that only appear when the price is close, reducing clutter and focusing on active trends.
- Flexible settings with both sensitivity-based and manual adjustments for maximum customization.
Default Settings:
The default sensitivity is set to 3, providing a balanced approach for most markets and timeframes (e.g., 5-minute charts for crypto like BTC/USD). This setting uses moderate parameters (ATR Period=10, ATR Multiplier=3.0, Keltner Channel Length=20, Keltner Channel Multiplier=1.5, Keltner ATR Length=10, EMA Length=100). Users can adjust the sensitivity or switch to manual settings for more control.
Important Notes:
- This indicator is a tool to assist in identifying trends and potential entry/exit points. It does not guarantee profits and should be used in conjunction with other analysis and risk management practices.
- The signals are based on historical price data and do not predict future performance. Always test the indicator on a demo account before using it in live trading.
- The gradient effect is purely visual and does not affect the signal logic.