Buy/Sell IndicatorBased on logic from many top contributors here, the script utilizes LazyBear's WaveTrend Oscillator Indicator along with custom code to plot a few key components for daily trading;
Boundaries for entry and exit points which are based on a 6-day trend in OPEN/HIGH and OPEN/LOW prices.
Daily HIGH and LOW points to establish a good view of stock's movements
Entry and exit points with confidence levels. These can be treated as entry points for short to medium term investments
Entry points come in the colours of White and Lime, where white is slightly confident and lime is extremely confident
Exit points come in the colours of Maroon, and Red, where maroon is slightly confident and red is extremely confident
Each Entry and Exit point also comes without text, or with a M or H above it, where M indicates medium confidence on the point and an O indicates overconfidence.
Use Case:
The best possible use case is to enter a trade on a LIME point with O text, this means that is an overconfident entry point.
The trade should be exited on a RED point with O text, this means that is an overconfident exit point.
But you can do with the indicators as you please.
In addition to LazyBear's code, the following existing models and indicators are taken into account:
RSI of closing price over a period of 25
EMA of RSI
Cerca negli script per "LazyBear"

M-SQUEEZEScript for Swing Trading. It use the following indicators:
- SQUEEZE MOMENTUM INDICATOR (LAZYBEAR)
- RSI VOLUME WEIGHTED (LAZYBEAR)
- PARABOLIC SAR
Settings for OANDA:SPX500USD at 2H

Weiss Wave Open Interest BarsFirstly :
LazyBear ' s "Weiss Wave " codes are used for open interests.
Original Weiss Wave Volume :
Let's start :
Open Interest vs. Volume: An Overview
Volume and open interest are two key measurements that describe the liquidity and activity of contracts In the options and futures markets. However, their meanings and applications are different. Volume refers to the number of contracts traded in a given period, while open interest denotes the number of active contracts.
Volume
Trading volume measures the number of options or futures contracts being exchanged between buyers and sellers, identifying the level of activity for that particular contract. For every buyer, there is a seller, and the transaction itself counts toward the daily volume.
Open Interest
Open interest indicates the number of options or futures contracts that are held by traders and investors in active positions. These positions have not been closed out, expired, or exercised. Open interest decreases when holders and writers of options (or buyers and sellers of futures) close out their positions. To close out positions, they must take offsetting positions or exercise their options. Open interest increases once again when investors and traders open new long positions or writers/sellers take on new short positions. Open interest also increases when new options or futures contracts are created.
Options or futures contract trading volume can only increase while open interest can either increase or decrease. While trading volume indicates the number of contracts that have been bought or sold, open interest identifies the number of contracts that are currently held.
Reference : www.investopedia.com
*** Worked to define all futures . You can look them in codes (between line : 13 to line 94 )
** CAUTION 1 : Since each instrument in the list has its own unique contract data, you must first enter its name to display it. I recommend you to select OANDA from the markets. Finally, when the COT reports are issued, it may repaints. However, this repaint is usually close to closing or after close .(When COT reports are so sharp ) So use this script only 1W ( 1 week ) or 1 M ( 1 month ) timeframe.
** CAUTION 2 : This data is taken to Tradingview with the help of Quandl. This is a tremendous possibility, but the system will not work if there is a malfunction.
Best regards.

Squeeze PRO Arrows [Makit0]SQUEEZE PRO INDICATOR v0.5Beta
Script based in:
original John Carter's ideas (SQUEEZE & SQUEEZE PRO)
LazyBear's script (Squeeze Momentum Indicator)
USE IT IN CONJUNCTION WITH THE SQUEEZE PRO INDICATOR
This system is based in the volatility reversion to the mean: volatility contraction leads to volatility expansion and the other way on
The arrows signal is a warning of volatility compression, more often than not this leads to a expansion of volatility and a move in the action price usually bigger than the expected move
Be aware of the trend direction don't take the arrows direction as certanty, use instead the momentum histogram in the Squeeze PRO Indicator to see the slope direction
By default the arrows are setted at 5 dots, they fire in the sixth dot after 5 dots of the same color. Try differents values to get more or less signals
here are 3 levels of compression:
Level 1: ORANGE, the lesser compresion level
Level 2: RED, the normal level marked by the original squeeze indicator
Level 3: YELLOW, the max compression level
The more the compression the bigger the after move
Simple and Exponential Moving Averages
There are 2 groups of Moving Averages within the indicator, the 8 & 21 EMAs and the 50, 100 & 200 SMAs
They are disabled by default, turn it on at your peace
Please check the John Carter's book (Mastering the Trade) and attend his webinars for more insight about the squeeze & squeeze pro systems
I'm starting at trading and learning every day, I attended one of his webinars about the Squeeze Pro, and with help of the LazyBear's Squeeze Momentum Indicator code up the Squeeze PRO.
Please be aware, I'm not an expert trader, only a developer with an idea: learn to pull out money from the market in a consistent way.
This is a Beta version, please feel free to comment and give feedback, anything you consider iteresting, the more you elaborate the better :D
Thanks you all!!!

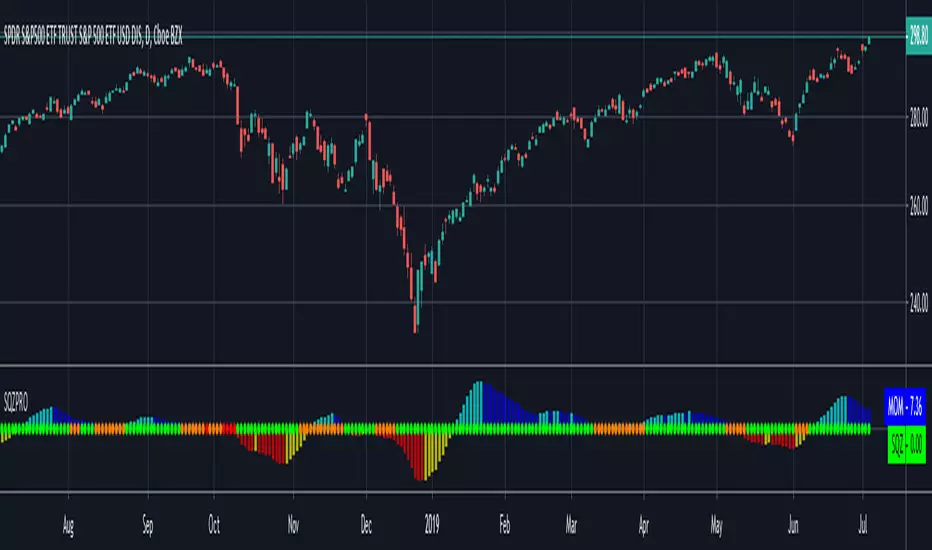
Squeeze PRO Indicator [Makit0]SQUEEZE PRO INDICATOR v0.5Beta
Script based in:
original John Carter's ideas (SQUEEZE & SQUEEZE PRO) at simplertrading dot com
LazyBear's script (Squeeze Momentum Indicator) here at tradingview dot com
USE IT IN CONJUNCTION WITH THE SQUEEZE PRO ARROWS INDICATOR
This system is based in the volatility reversion to the mean: volatility contraction leads to volatility expansion and the other way on
The dot signal is a warning of volatility compression, more often than not this leads to a expansion of volatility and a move in the action price usually bigger than the expected move
Be aware of the trend direction, use the momentum histogram to see the slope direction
There are 3 levels of compression:
Level 1: ORANGE, the lesser compresion level
Level 2: RED, the normal level marked by the original squeeze indicator
Level 3: YELLOW, the max compression level
The more the compression the bigger the after move
The GREEN dots signal the volatility expansion out of the squeeze ranges
Please check the John Carter's book (Mastering the Trade) and attend his webinars for more insight about the squeeze & squeeze pro systems
I'm starting at trading and learning every day, I attended one of his webinars about the Squeeze Pro, and with help of the LazyBear's Squeeze Momentum Indicator code up the Squeeze PRO.
Please be aware, I'm not an expert trader, only a developer with an idea: learn to pull out money from the market in a consistent way.
This is a Beta version, please feel free to comment and give feedback, anything you consider iteresting, the more you elaborate the better :D
Thanks you all!!!
cbci cu//@version=3
// Constance Brown Composite Index
// Re-implementation of CBCI based upon LazyBear's version + source text
// References:
//
// original author: @LazyBear
// "Technical Analysis for Trading Professionals" by Constance Brown, pg. 369

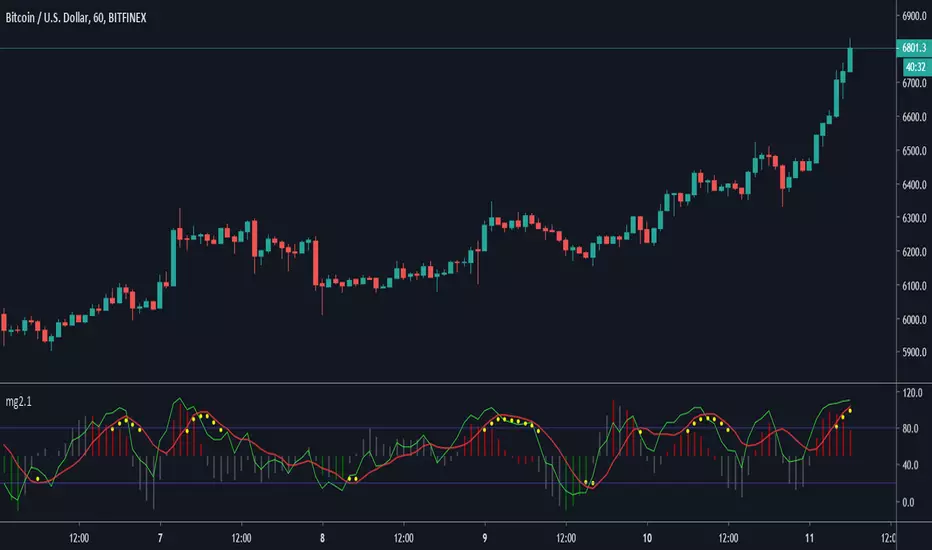
Minimal Godmode 2.1// Acknowledgments:
// Original Godmode Authors:
// @Legion, @LazyBear, @Ni6HTH4wK, @xSilas
// Drop a line if you use or modify this code.
// Godmode 3.1.4: @SNOW_CITY
// Godmode 3.2: @sco77m4r7in and @oh92
// Godmode3.2+LSMA: @scilentor
// Godmode 4.0.0-4.0.1: @chrysopoetics
// Jurik Moving Average: @everget
// Constance Brown Composite Index RSI: @LazyBear
// Wavetrend Oscillator: @fskrypt
// TTM Squeeze: @Greeny
// True TSI/RSI: @cI8DH and @chrysopoetics
// Laguerre RSI (Self-Adjusting Alpha with Fractals Energy): @everget
// RSI Shaded: @mortdiggiddy
// Minimal Godmode v2.0:
// 6 BTC pairs/exchanges (instead of 11) to reduce loading time from the pinescript security() function
// Volume Composite for engine calculation
// TTM Squeeze on Wavetrend Signal
// Constance Brown Composite Index RSI (CBCI)
// TrueTSI (Godmode 4.0.0 implementation)
// Laguerre RSI (LRSI)
// Minimal Godmode v2.1:
// Removed TTM Squeeze and Volume Composite
// EMA for Wavetrend Signal
// Multi-exchange for BTC no longer the default
// mg engine toggle for CBCI, Laguerre RSI, and TTSI
// Wavetrend Histogram component toggle
John Ehlers Universal Oscillator [mwlang]This version of John Ehlers Universal Oscillator fixes a degrees to radians bug in LazyBear's version published here:
Waddah Attar Explosion and WaveTrend Oscillator combinedWaddah Attar Explosion by LazyBear and WaveTrend Oscillator by Krypt.
All credits goes to LazyBear and Krypt, i have only done some combining with the two indicators, barcolors and BG colors to clarify entrys and exits.
Combine with CM_Williams Vix_Fix, Super Guppy R1.0 by JustUncleL and you have a powerful tool.
Barcolors to look for
Aggressive Buy 1 = Lime
Agressive Buy 2 = Aqua
Buy = Green
Sell 1 = Orange
Sell 2 = Red
This is my first try, so be nice to me :-)

Godmode 4.0.1 [Correlator]First off, a huge thank you to the following people:
@LEGION:
@LazyBear: www.tradingview.com
@xSilas: www.tradingview.com
@Ni6HTH4awK: www.tradingview.com
@sco77m4r7and:
@SNOW_CITY: www.tradingview.com
@oh92: www.tradingview.com
@alexgrover: www.tradingview.com
@cI8DH: www.tradingview.com
@DonovanWall: www.tradingview.com
This is my second iteration of Godmode. This time I allowed the possibility to correlate two benchmarks against one another, thereby giving you twice the signals (once there's a strong correlation between the two, inverse or otherwise). That aside, there are no changes to this indicator that the first iteration doesn't have:
There are still more iterations planned, but if you guys have any ideas or wishes regarding what direction I go, then please let me know.
Want to Learn?
If you'd like the opportunity to learn Pine but you have difficulty finding resources to guide you, take a look at this rudimentary list: docs.google.com
The list will be updated in the future as more people share the resources that have helped, or continue to help, them. Follow me on Twitter to keep up-to-date with the growing list of resources as well as any other scripts I publish.
Suggestions or Questions?
Don't even kinda hesitate to forward them to me. My (metaphorical) door is always open.

Earnings Support and Resistance Levels [NeoButane]Inspired by @LazyBear's/@timwest's script:
Usage: support and resistance levels based on averaging price around earnings and quarterly opens.
What it is plotting:
1. A horizontal level whenever earnings occur. If actual earnings is higher than estimated, the line turns green, else red.
2. A horizontal level every quarterly open, colored black.
3. An average between the two mentioned above, colored orange.
4. 5% moves away from 3M open and earnings
5. Misc: 5% move away from that 5% move away, then 10% move away from the 2nd 5% move away.
By default, 4 and 5 are off to reduce visual noise.
Idea: Traders panic around certain dates that always happen, and traders always panic in the wrong direction. The market is composed of traders trading in the wrong direction at the same time, all the time. That means price will bounce back and forth as the gambling dens colloquially known as 'forex brokerages' or 'stock exchanges' take your money in the form of fees, time, and liquidations. So I put two lines on the chart and put one right in between, because it always goes back. I hope you can find it useful!
Note: This was a part of the old fundamental data indicators and is not officially for use, so while it should work on most U.S. stocks and a couple of other exchanges, it is not perfect.

Chaikin MF% (CMFP) w. Alerts, Bells & Whistles [LucF]This is Chaikin’s Money Flow indicator on a 0-100 scale with buy/sell signals, alerts and other bells & whistles.
It includes:
- a fast EMA (16 periods by default),
- a slow MA (64 periods by default),
- histograms,
- 3 different sorts of crosses,
- big swings identification,
- buy/sell signals on CMFP crossing back from outside user-defined levels,
- buy/sell signals on the slow MA pivots above/below user-defined levels,
- alerts on big swings and buy/sells.
This indicator started with @LazyBear code (VAPI) at:
@cI8DH then changed the scale to 0-100, which I find very useful:
I then added the rest.
The chart above shows both clean and busy versions of the indicator.
Note that the default length is 10 rather than the commonly used 20. I use CMFP in conjunction with VFI and like the fact that it is faster than VFI. The default inputs show the way I normally use this indicator, with the slow MA shown in histogram mode. I find it gives good context to the signal line. Crosses between the two are often useful.
The buy/sell signals aren’t the main attraction of this indicator, and nothing to write home about. Like the big swing markers, I think it’s more realistic to view them as pointers to potentially interesting areas on charts. Their nature makes them more suited to identifying reversals. They certainly aren’t reliable enough to turn this study into a strategy and I normally don’t use them. The levels pre-defined for the buy/sell signals on CMFP are most useful on short intervals. The buy/sell signals on the slow MA pivots work on a more complete range of intervals. Optimization for your specific instruments and intervals will improve their reliability.
As usual when defining alerts, be sure you already have defined proper inputs and that you are on the intended interval, as they will be used when triggering alerts.

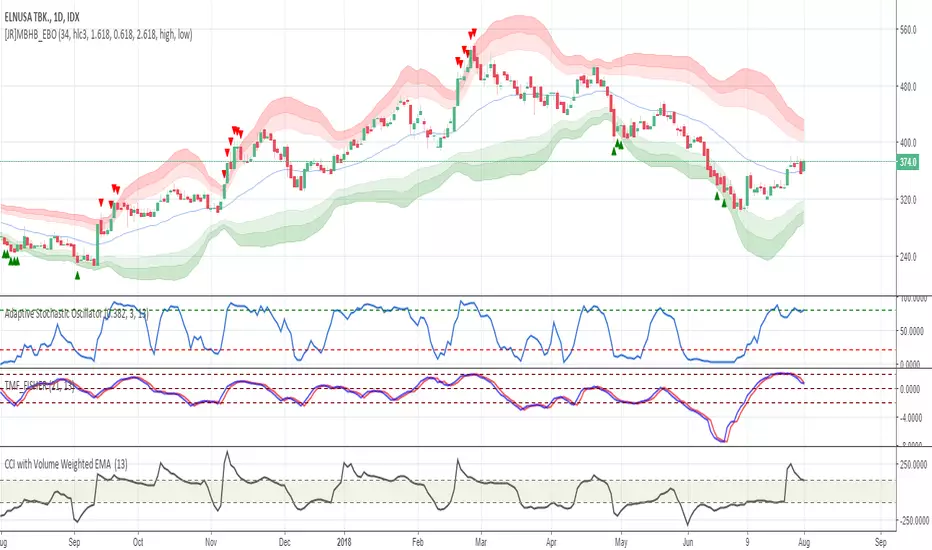
Twiggs Money Flow Fisher Transform// Credits to @LazyBear
// This is an experimental indicator (Originaly coded by Lazybear) modified by @haidinurhasfi by applying the Fisher Transform to Twiggs Money Flow.
// Tune the length according to your trading style and instrument
Volume Accumulation Percentage Indicator (0-100)This indicator is the same as LazyBear's indicator with the same title. I simplified it and changed the range to 0-100 so that it can be stacked with RSI indicator. 50 cross is the equivalent of zero cross in the original indicator.
PS: Drag and drop the indicator on RSI for stacking. Go to the settings and scale it to right.
More explanation on the original indicator:
Stochastic On Balance Volume(not sure why the text in the image above is messed up; it looked good before publishing. The oscillators above are (from top to bottom) StochOBV, OBVOSC (LazyBear), OBV)
Applies the Stochastic Oscillator to OBV the same way StochRSI applies the Stochastic Oscillator to RSI.
Features:
- Bounded between 0 and 100, so it may be used for overbought/oversold alerts;
- Uses two lines for crossing signals similar to Stoch and StochRSI;
- Only considers recent OBV action, similar to how StochRSI only considers recent RSI action;
It can be used for simple signals, divergence, trend lines, and any other method you'd use StochRSI for.
The OBV calculation is from LazyBear's OBVOSC script here , so thank you for your script.

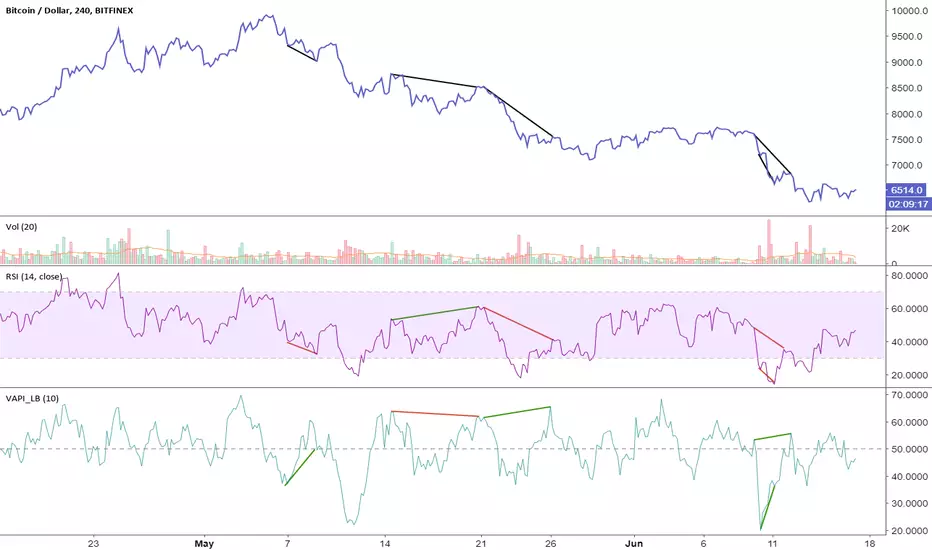
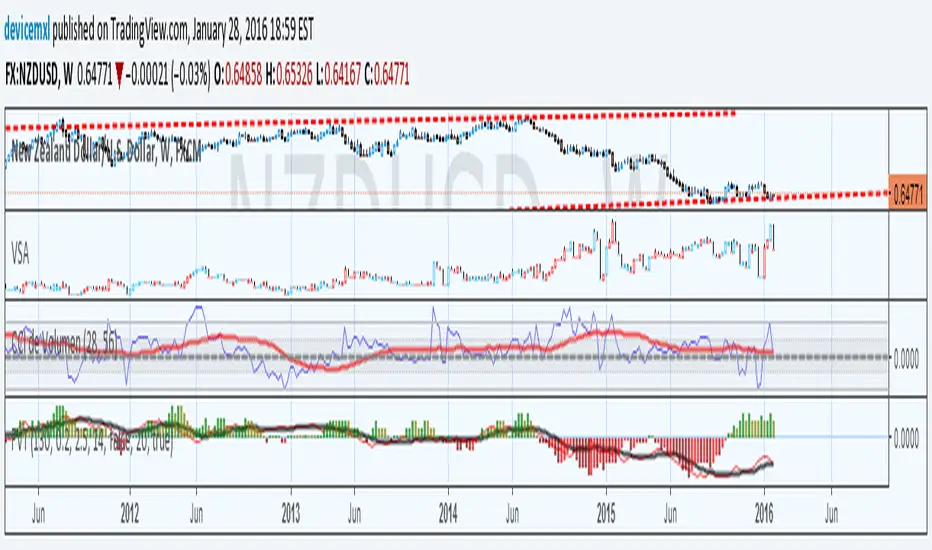
Propagation Volumes and TrendsWith this, i calculate RSI of the HL2 of the volume and use like an oscillator, this will use to measure the strength of the trend and the "Volume Flow" to follow the trend.
I use like foundation the LazyBear "Volume Flow Indicator" "honor a quien honor merece"
Background:
I think the volume as the price could be represented by candles or other graphic to use indicators and strengthen their analysis, due to lack of registration of this it is first necessary to calculate a volume graph, if the candle traditionally negative price brand then the total volume is taken as negative for the period. An example of this is in the On Balance Volume indicator, the problem is that there is no way to analyze the volume using other methods. An approximate volume of the spread could be the use of the price spread to make a synthetic behavior
As traditionally is observed if Open> Close then the candle and the volume will be negative and vice versa; the next step, is estimate the amounts of the candle necessary to calculate the ratio to use for the volume and thus idealize their spread within the candle:
VLOW = Volume x Low
vHigh = x High Volume
VOpen = vClose
vClose = Volume x Close
This graph can show a stable synthetic form of fluctuations in the volume trend affected by price.
ideas, comments and suggestions (or corrections).They are always welcome
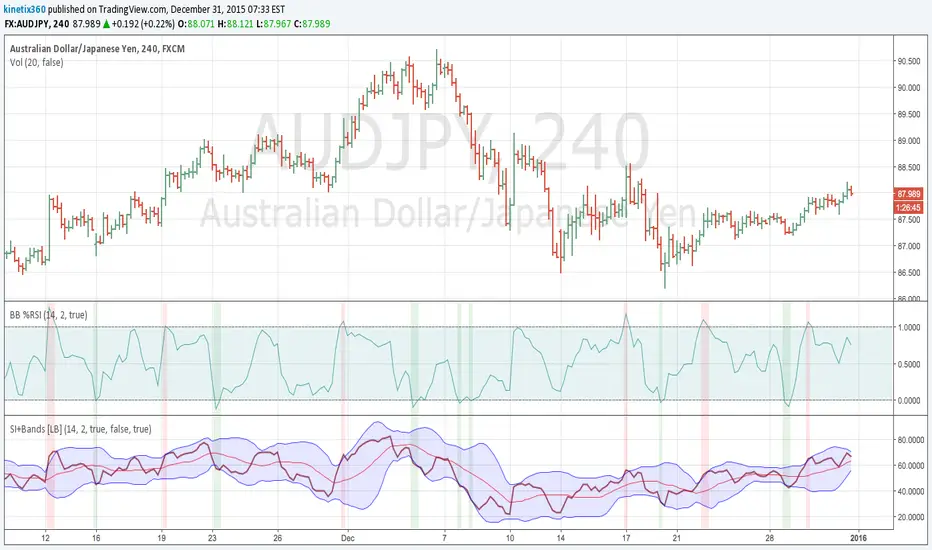
Bollinger Bands %RSIHi All,
I am not a programmer, but I tried to buid BB% of RSI , base of John Bollinger' book. I cut and paste the function from LazyBear MFI/RSI BB indicator and original BB% scripts. Now, I need help for 2 things :
1. I already check by side with LazyBear indicator for the OB/OS, and all are good. One thing I don't understand is why we build the Basis for bb using "sma" ? any one can help me to understand with this?
2. I am happy with this, but I need to make the Source Price become customisable (close, hl/2, hlc/3, etc). and I don't know how to set it up. please help me with this.
Thank you.
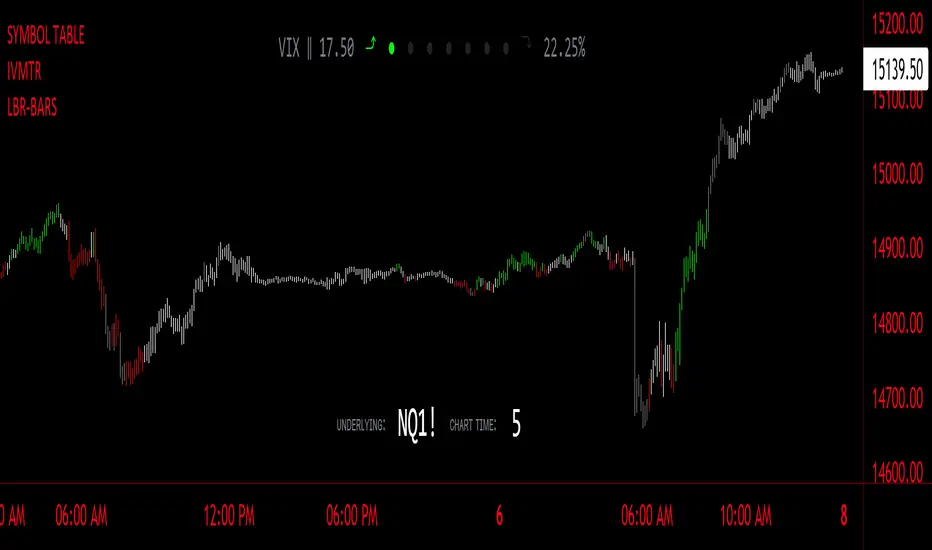
LBR-Volatility Breakout BarsThe originator of this script is Linda Raschke of LBR Group.
This Pine Script code is the version 5 of LBR Paintbars for TradingView, called "LBR-Bars." It was originally coded for TradingView in version 3 by LazyBear. It is a complex indicator that combines various features such as coloring bars based on different conditions, displaying Keltner channels, and showing volatility lines.
Let me break down the key components and explain how it works:
1. Inputs Section: This section defines various input parameters that users can adjust when adding the indicator to their charts. These parameters allow users to customize the behavior and appearance of the indicator. Here are some of the key input parameters:
- Users can control whether to color bars under different conditions. For example,
they can choose to color LBR bars, color bars above/below Kelts, or color non-LBR
bars.
- Users can choose whether to show volatility lines or shade Keltner channels' area
with the Mid being the moving average on the chart.
- In the calculation of Keltner channels, users can set the length of the moving
average that the Keltner channels use as the mid and then set the Keltner multiplier.
If users want to use "True Range" to determine calculations, they can turn it on or
off; it defaults to off.
- Users can change the calculation of volatility lines and set the length for finding the
lowest and highest prices. The user sets the ATR length and multiplier for the ATR.
2. Calculation Section: This section defines the calculation of the upper and lower standard deviation bands based on the input parameters. It uses Exponential Moving Averages (EMAs) and optionally True Range to calculate these bands if turned on. These bands are used in the Keltner channel calculation.
3. Keltner Channel Section: This section calculates the upper, middle, and lower lines of the Keltner channels. It also plots these lines on the chart. The colors and visibility of these lines are controlled by user inputs.
4. Volatility Lines Section: This section calculates the upper and lower volatility lines based on the lowest and highest prices over a specified period and the ATR. It also checks whether the current close price is above or below these lines accordingly. The colors and visibility of these lines are controlled by user inputs.
5. Bar Colors Section: This section determines the color of the bars on the chart based on various conditions. It checks whether the current bar meets conditions like being an LBR bar, being above or below volatility lines, or being in "No Man's Land." The color of the bars is set accordingly based on user inputs.
This Pine Script creates an indicator that provides visual cues on the chart based on Keltner channels, volatility lines, and other customizable conditions. Users can adjust the input parameters to tailor the indicator's behavior and appearance to their trading preferences.
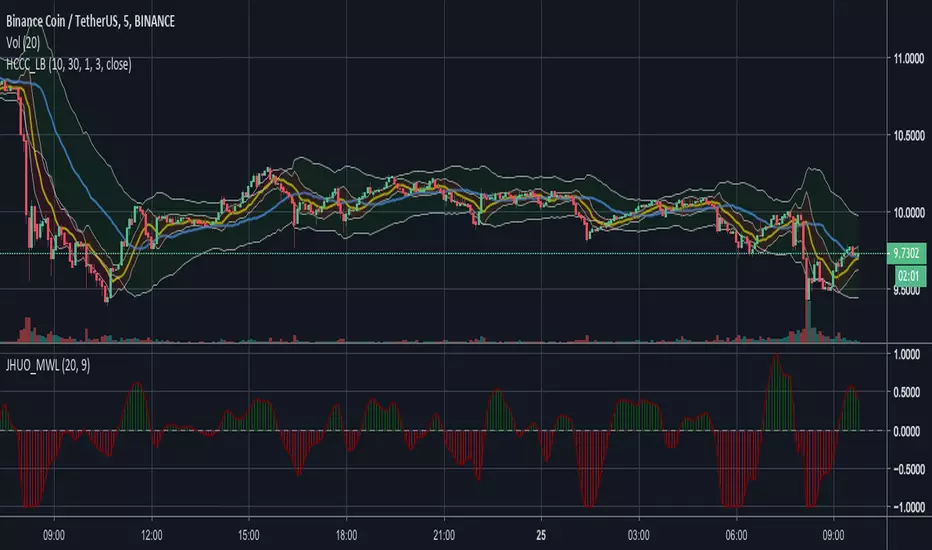
MA ClustersBackground :
This study allows to define ranges for contraction and expansion of a defined set of MA to analyse the the momentum at those specific situations.
In general all functions used are very basic but allows the user to set alerts when a cluster of MA enters a defined range within or outside the MAX and MIN of a selected MA cluster. The predefined length of the EMAs were put together by HurstHorns within a trading learning discord group and are designed for 1M timeframe to read the momentum for scalping entries - Thanks again for sharing.
Functions :
currently the following MA are available:
- ema
- sma
- smma
- wma
- vwma
- vma
the variable moving average is based on the calculation from lazybear.
- RSI Stoch Filter
- Wavetrend OB/OS filter
Currently only alerts for contraction are enabled to not overload the study but in case expansion would be from interest this can be added quickly.
Outlook:
Additional filters were added to see if they can add value in. the decision making or by simply filtering out noise. This is still quite experimental. Please share any useful observation I should add as additional filter option to find good setups. in relation to contractions or expansions.
Next version will get Bollinger bands for 1 selectable MA from the list for additional study options.
In case you are interested in more options such as more MA types or vwap.. just let me know. for VMA I need to do more research to add useful function for laddering or things like that.
In general The script itself can be easily extended by additional functions. As this is one of my first scripts the code itself might not be optimal or there are more elegant ways to come to the same goal. However please use for study purposes only and report bugs or enhancement requests.
good luck and happy trading!

Elder Impulse System + ATR BandsDisregard the above chart, I am not sure why it isn't showing the one I want, which is linked below:
This is as far as I can tell the closest representation to Dr. Alexander Elder's updated "Elder Impulse System" that has added ATR-volatility bands up to 3x deviations from price. I got the idea from watching this recent video (www.youtube.com) of Dr. Elder reviewing some recent trades and noticed he had updated his system from his original books. The Impulse System colour coding was inspired by AstralLoverFlow and LazyBear. ATR Bands are pre-programmed Keltner Channels with some modifications such as filing in the ATR Zones with user-selected colour bands and modifying the ATR value to better suit the volatility of the market being traded.
The script has several components, which I will detail below:
Exponential Moving Averages:
1) A 13-period EMA that is used as a staple in all of Dr. Elder's technical analysis. He uses this EMA as the basis for all of his indicators and why it is included here.
2) A 26-period EMA which can be used as a base-line of sorts to filter when to go long or when to go short. For instance, price over the 26-EMA, price is strong and the rally upwards is likely to continue, underneath it, price is weak and likely to continue downwards for a time.
Volatility Bands:
By definition these are nothing more than 3 separate Keltner Channels of a 13-period EMA each set to one additional multiplier from the moving average. This gives us a 1x, 2x, and 3x multiplier of average volatility from the 13-period EMA based on a 14-period Average True Range (ATR) reading. The ATR was chosen as it accommodates price gaps and also is the standard formula calculation in TradingView. The values of the bands cannot be adjusted but the colour coding of them can be.
Elder Impulse System:
These colour-coded bars show you the strength and direction of the current chart resolution, calculated by the slope of a 13-period EMA and the slope of a MACD histogram. These are used not as a buying or selling recommendation alone but as trend filters, as per Dr. Elder's own description of them.
Green Bars = The 13-period EMA is sloping positively and the MACD histogram is rising compared to previous bars. The trader should only consider buying/long opportunities when a green bar is most recent.
Red Bars = The 13-period EMA is sloping negatively and the MACD histogram is falling compared to previous bars. The trader should only consider selling/short opportunities when a red bar is most recent.
Blue Bars = The 13-period EMA and the MACD histogram are not aligned. One of the indicators is sloping opposite to the other indicator. These are known as indecision bars and are typically seen near the end of a previously established trend. The trader can choose to wait for either a green or red bar to shape their trading bias if they are more risk-averse while a counter-trend trader may decide to try opening a position against the currently-established trend.
How To Trade the System:
This system is unique in that it is so versatile and will fit the styles of many traders, be it trend following traders (generally the original Elder Impulse System design) or mean-reversion/counter-trend trading (the original Keltner Channel design). None of the examples below or in the chart above are financial advice and are just there for demonstration purposes only.
1) The most basic signal given would be the moving average cross up or down. A cross of the 13-EMA over the 26-EMA signals upward trend strength and the trader could look for buying opportunities. Conversely, the 13-EMA under the 26-EMA shows downward trend strength and the trader could look for selling opportunities.
2) Following the Elder Impulse system in conjunction with the EMAs. Look for long opportunities when a green bar is printed and price is over both of the 13- and 26-period EMAs. Look for short opportunities when a red bar is printed and price is below both of the 13- and 26-period EMAs. Keep in mind this does not necessarily need a moving average cross to be viable, a green or red bar over both EMAs is a valid signal in this system, usually. Examine price more closely for better entry signals when a blue bar is printed and price is either above or below both EMAs if you are a trend trader. This is how Dr. Elder originally intended the system to be used in conjunction with his famous Triple Screen Trading System. I am not going into detail here as it is a deep subject but I would suggest an interested trader to examine this Triple Screen System further as it is widely accepted as a strong strategy.
3) Mean Reversion and Counter-Trend Trading. Dr. Elder mentions that the zone between the two EMAs is called the Value Zone. A mean reversion trader could look for buying opportunities if price has generally been in an uptrend and falls back to value, conversely, they could look for shorting opportunities if price has generally been in a downtrend and rises back to value. These are your very basic pull backs found in trends that create your higher lows in an uptrend or your lower highs in a downtrend. A mean reversion/scalper trader may also look to use the upper and lower most ATR bands as an indication of price being overbought or oversold and could look to enter a counter-trend trade here once a blue indecision bar is printed and to ride that move back down to the Value Zone.
Taking Profits and Risk Management
This system again is very versatile and will fit a wide range of trading styles. It has built in take profit levels and risk management depending on your style of trading.
1a) In original Triple Screen Trading (and the original Elder Impulse system), a trader was to place a buy order one tick above a newly printed green bar with a stop loss one tick below the most recent 2-day low, and vice-versa for red bars on short selling. as long as other criteria were met, that I will not go into. It is all over YouTube and in his books and on Investopedia if you want more information. The general idea is to continue the trend in the direction if price is strong and you are bought into that move with a close stop, or if price falls back a little bit, you can get in at a better price. This would be a system typically better suited to a scalper.
1b) The updated risk management according to the above video is to place a stop loss at least 2ATR away from price. These bands already have calculated these values so a trader can place a stop one tick below the 2 or even 3ATR zones depending on their risk appetite. This is assuming you have already received a strong buy signal based on the system you follow. This would be a system typically better suited to a trend-trader.
2a) Taking profits if you are a trend trader has several possibilities. The first, as Dr. Elder suggests, is to place a price target 2ATR values away from your entry giving you approximately a 1:1 risk-reward ratio.
2b) The second possibility if the trade is successful is to ride the trend upwards until a blue bar is printed, suggesting indecision in the market. A modified version of this that could let a winning trade run longer is to wait for the price to close under the 13-EMA in fast markets, or close under the 26-EMA in slightly slower markets to maximize potential winnings.
2c) A scalper trader may wish to have a target at either the value zone if they are playing an extended buy/short back to the mean, or if they are being at the mean, to sell or cover when price extends back out to the 2x or 3x zone.
3) Trend traders can additionally use the ATR zones as a sort of safety guidelines for entering a trade. Anything within the 1ATR zone is typically a safer entry as the market is less volatile at this time. Entering when price has gone into the 2ATR zone is signaled as a strong momentum move and can signal a stronger move in the direction of the current closing bar. While not always the case, it is suggested by Dr. Elder to not enter trend trades at the 3ATR zone as this is where you will be likely looking for a counter-trend retracement back to value and a trader entering here in the direction of the trade has a higher chance of being stopped out or not getting in at the best possible price.

On-chart Wavetrend Divergence with PivotsThis is an OnChart WaveTrend Divergence Indicator with Pivots and Alerts
LazyBears WaveTrend Indicator or also known as "Market Cipher" is an Indicator that is based on Moving Averages, therefore its an "lagging indicator". Lagging indicators are best used in combination with leading indicators. In this script the "leading indicator" component are Daily, Weekly or Monthly Pivots. These Pivots can be used as dynamic Support and Resistance, Stoploss, Take Profit etc.
This indicator combination is best used in larger timeframes. For lower timeframes you might need to change settings to your liking.
What are those circles?
-These are the WaveTrend Divergences. Red for Regular-Bearish. Orange for Hidden-Bearish. Green for Regular-Bullish. Aqua for Hidden-Bullish.
Please keep in mind that this indicator is a tool and not a strategy, do not blindly trade signals, do your own research first! Use this indicator in conjunction with other indicators to get multiple confirmations.

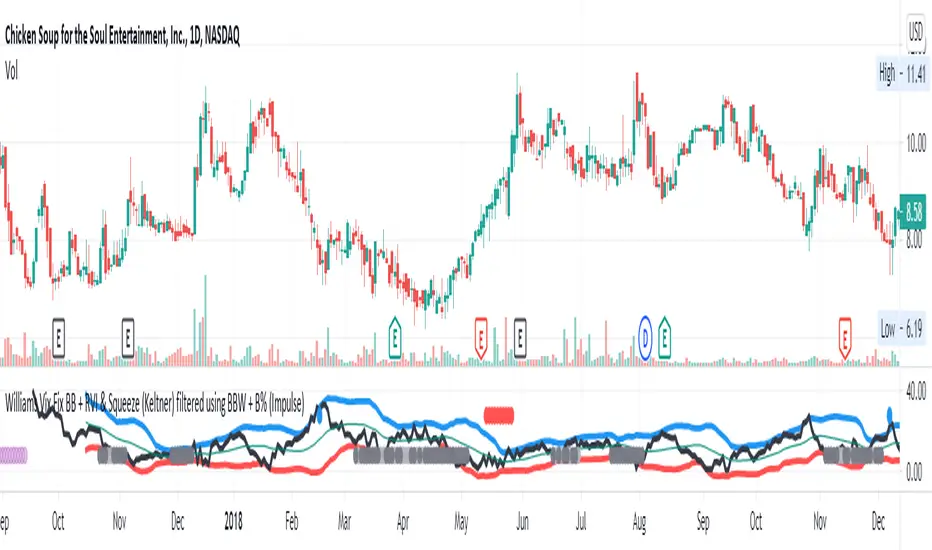
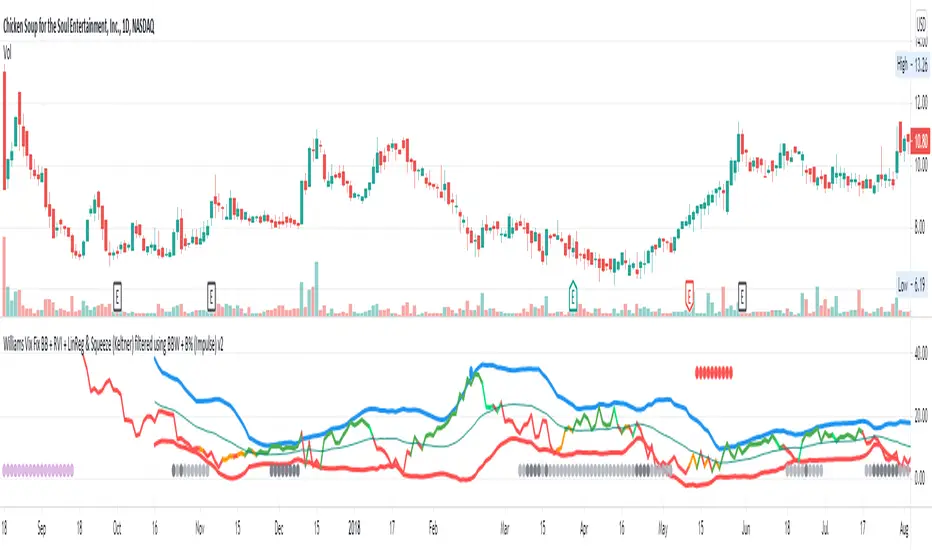
Williams Vix Fix BB + RVI + LinReg & Squeeze (Keltner) BBW + %BLegend:
Entery signal: When line color turns to lime (lighter green) after a blue dot appears
Exit signal: When line color turns to red (darker red) after a red dot appears
Note: it is more affective as an entry signal (Bottom is stronger)
- When line touches or crosses red band it is Top signal (Williams Vix Fix)
- When line touches or crosses blue band it is Bottom signal (Williams Vix Fix)
- Red dot at the top of indicator is a Top signal (Relative Volatility Index)
- Blue dot at the top of indicator is a Bottom signal (Relative Volatility Index)
- Gray dot at the bottom of indicator is a Keltner Squeeze signal (filtered by either BBW or %B)
- Silver dot at the bottom of indicator is a weaker Keltner Squeeze signal (Doesn't meet either BBW or %B filter)
- Purple is a 'Half Squeeze' only 1 Bollinger Band crossed the Keltner Channel
This is an attempt to make use of the main features of all 6 of these Volatility tools:
- Williams Vix Fix + Bollinger Bands
- Relative Volatility Index (RVI)
- Linear Regression (detects Vix Fix starts to rise or fall to a certain degree in order to help validate bottom/top)
Note : There is also added precision on Linear Regression entry by dividing WVF by square roots of basis.
- The crossing of Keltner Channel by the Bollinger Bands (Squeeze)
Conditions to Help Filter Keltner Squeeze:
- When the Bollinger Bands Width (BBW) value is lower than the lowest value within a period plus a margin of error (percentage)
- When the %B value goes up or down by the impulse value (threshold value in setting) detailed in LazyBears indicator. (www.tradingview.com)
If it meets one of these 2 filters and there is a Keltner Channel Squeeze than gray color or else if the squeeze doesn’t meet one of the 2 filters than silver color (weaker Squeeze).
The goal is to find the best tool to find bottoms and top relative to volatility and filter squeeze.
Note: You can also change the threshold for RVI top and bottom.
And this work builds on my last indicators:
- Williams Vix Fix + BB & RVI (Top/Bottom) & Squeeze ()
- Williams Vix Fix BB + RVI & Squeeze (Keltner) filtered BBW + %B ()
If you have ideas on this work or have ideas on potential combinations please message me, I always want to learn or get perspective on how it can be improved.
Sharing is how we get better (Parameter tuning, ideas, discussion)
I don’t reinvent the wheel, just trying to make the wheel better.
Williams Vix Fix BB + RVI & Squeeze (Keltner) filtered BBW + %BLegend:
- When line touches or crosses red band it is Top signal (Williams Vix Fix)
- When line touches or crosses blue band it is Bottom signal (Williams Vix Fix)
- Red dot at the top of indicator is a Top signal (Relative Volatility Index)
- Blue dot at the top of indicator is a Bottom signal (Relative Volatility Index)
- Gray dot at the bottom of indicator is a Keltner Squeeze signal (filtered by either BBW or %B)
- Silver dot at the bottom of indicator is a weaker Keltner Squeeze signal (Doesn't meet either BBW or %B filter)
- Purple is a 'Half Squeeze' only 1 Bollinger Band crossed the Keltner Channel
This is an attempt to make use of the main features of all 6 of these Volatility tools :
- Williams Vix Fix + Bollinger Bands
- Relative Volatility Index (RVI)
- The crossing of Keltner Channel by the Bollinger Bands (Squeeze)
Conditions to Help Filter Keltner Squeeze:
- When the Bollinger Bands Width (BBW) value is lower than the lowest value within a period plus a margin of error (percentage)
- When the %B value reaches the alert level detailed in LazyBears indicator. ()
If it meets one of these 2 filters and there is a Keltner Channel Squeeze than gray color or else if the squeeze doesn’t meet one of the 2 filters than silver color (weaker Squeeze).
The goal is to find the best tool to find bottoms and top relative to volatility and filter the squeeze.
The idea is that both Williams Vix Fix + Bollinger Bands and Relative Volatility Index both already give the main volatility bottom and top so combining them to compare and validate the signals makes sense. (Note: Bottom signal is more accurate than top). In addition, I added the squeeze to show the potential breakout pressure and to compliment bottom and top signals.
For ideas on how to continue this work :
I encourage ideas to combine the Williams Vix Fix and Relative Volatility Index for volatility top and bottom (with probability would be awesome)
And I encourage ideas to filter Keltner Channel Volatility Squeeze using both the BBW or %B or other volatility squeeze indicators or a combination of all of them.
Also, I encourage people to post their top parameters for the BBW and %B to filter the Keltner Squeeze in the comments or to send me them by chat relative to this indicator.
Half the battle is making the indicator, while the other half is tuning the parameters.
The current parameters are one of the least aggressive, and act as a mild filter.
Note: You can also change the threshold for RVI top and bottom.
And this work builds on my last indicator:
If you have ideas on this work or have ideas on potential combinations please message me, I always want to learn or get perspective on how it can be improved.
Sharing is how we get better (Parameter tuning, ideas, discussion)
I don’t reinvent the wheel, just trying to make the wheel better.