Cerca negli script per "TDI"

TDI (by Will)The TDI is a complex indicator as long as it is based on three other popular indicators: the RSI , Moving Average, and Bollinger Bands .
The RSI helps to find out whether the current trade is "overheated". The RSI lines are smoothed out by the Moving Averages. The Bollinger Bands help to assess the oscillation amplitude of the price and the direction of the trend. Thanks to being complex, the TDI may be used as a separate trading system.
The TDI is drawn in a window below the price chart and consists of five lines: two RSI lines and three Bollinger Bands . The green RSI line is called fast, the red one is signal - it is calculated based on a longer averaging period. The RSI lines show the strength and volatility of the market. When they cross, they give short-term TDI signals.
Two of the Bollinger Bands are blue, they constitute a trading channel; the yellow line is called the middle, or main, line. The central axis of the indicator is level 50; levels 32 and 68 are also marked. The area above 68 is the overbought zone and the area below 32 is the oversold zone, as in the classical RSI .
TDI - Traders Dynamic Index by Mike ValAdvanced custom stylised TDI indicator.
Has radio buttons (check box) for
- showing BB
- filling BB area
- showing MA of TDI
- colour filling between TDI & zero line, above & below 0 line, in alternating colour
The filling of TDI, above & below the 0 line, gives better visuals to the indicator.

TDI Signals [by: Bijan Ajdary]This indicator, along with the TDI indicator: , can offer trusted signals to enter and exit.
and just can be used as a complete trading system.
You can send your feedback and comments to my email address: bj.ajdary@gmail.com
@The_Last_Savior

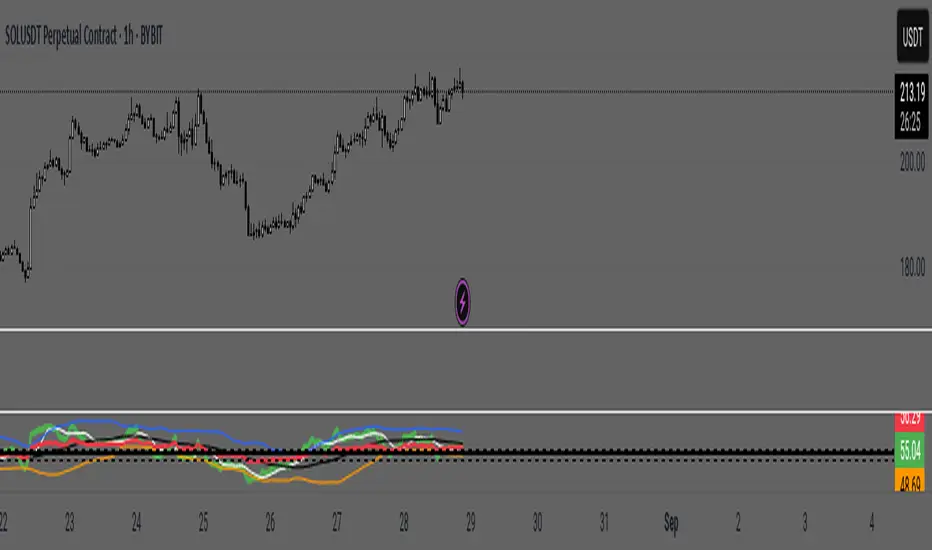
TDI - Traders Dynamic Index [CryptosScrooge]Hello everyone ,
TDI as we all know is "Trader dynamic index" , developed by Dan Malone. This indicator is widely used in Market maker trading strategy . I have seen many variant of this script with different settings but in my indicator the settings are as per Market maker guidelines , so those who are using BTMM strategy can directly apply this on there chart and start trading . Those who don't trade BTMM but use TDI can alter there default setting form the menu and use as per there strategies.
One of the way in which i use it is , i use to find divergences at supply or demand preferably and then when price close below Market base line (Yellow) it gives me confirmation that trend is now shifted and then i will take my Buy or Sell trades .
I hope this indicator would be useful for you.
Peace!!.

TDI DIVERGENCEThis indicator, along with the TDI indicator: http , can offer trusted signals to enter and exit.
and just can be used as a complete trading system.
You can send your feedback and comments to my email

TDI Advanced Signals with EMA FilterBuy and sell signals based on the TDI also includes the EMA filter, which is optional.


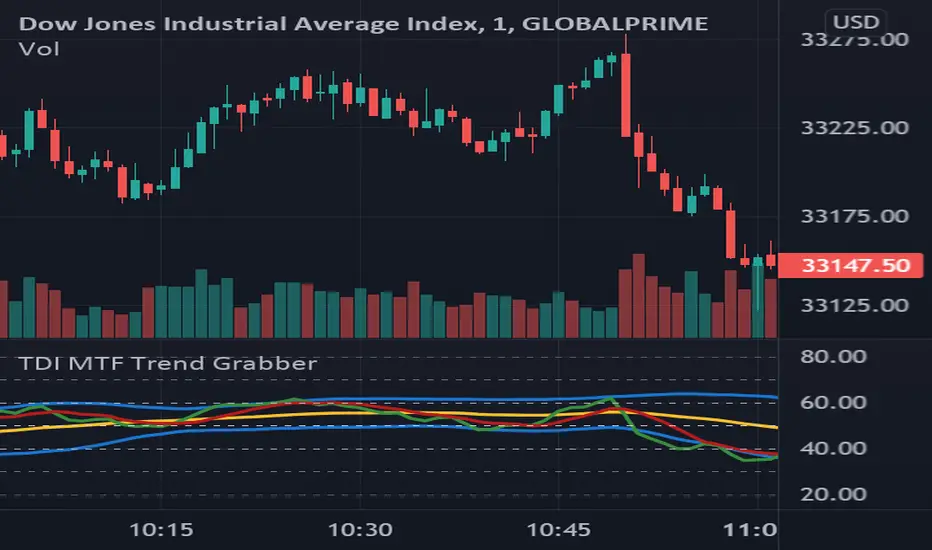
TDI MTF Trend GrabberWork in progress!
I like using the TDI, but getting more interested in the confluence of when several timeframes all turn bullish or bearish , etc.
However I actually could use some help getting the MTF / request.security working properly.
Currently the idea is to be able to switch between the current timeframe, and at this point 2 other timeframes.
Change the timeframe using the "Plot_tf" input.
Thanks community.
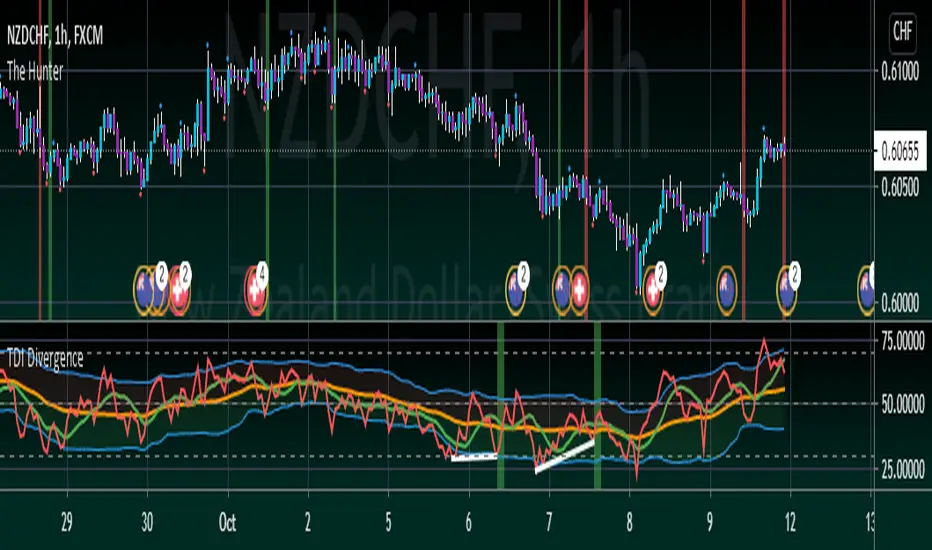
TDI DivergenceScript looks for divergencies on TDI. Divergencies are created by fast MA. First divergence leg has to be outside of volatility bands. After that, fast MA has to cross middle of volatility bands and then create second leg. When second leg is created, there have to be two candles with the same color in the direction of divergence.
Alerts are supported.
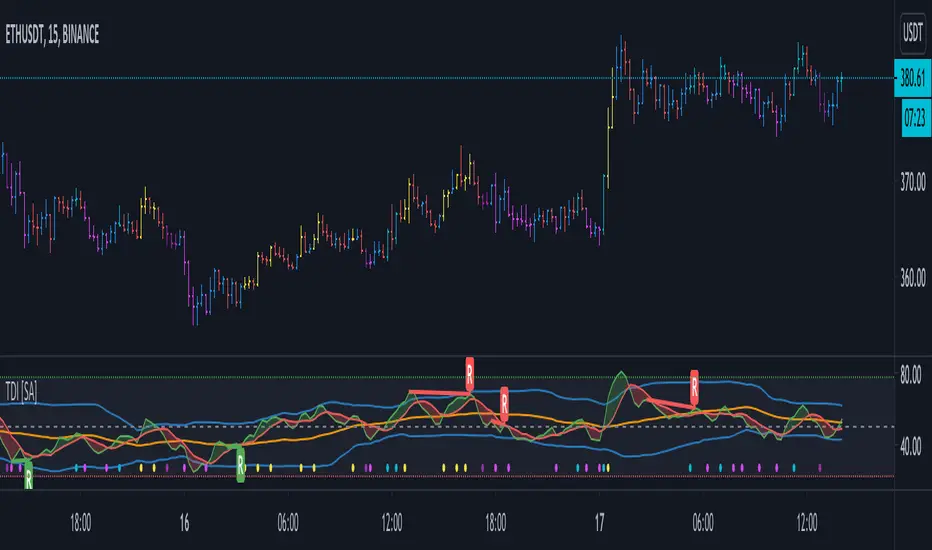
TDI - Traders Dynamic Index [SystemAlpha]Traders Dynamic Index with Divergence
Credits to the original code author LazyBear and modifications by JustUncleL


Rubotics TDI Top/Bottom Indicator**Rubotics TDI Top/Bottom Indicator (Rubots TDI T/B)**
This proprietary indicator integrates several technical analysis tools into one cohesive system to help traders identify potential top and bottom signals directly on the price chart. Unlike standard indicators that merely plot common metrics, this script uniquely fuses a custom moving average algorithm with established oscillators to enhance signal clarity and market timing.
**Core Components and Unique Features:**
- **Global Visual Settings:**
- Easily toggle visual elements (tables, background highlights) that display key metrics and trading setup information.
- Provides a detailed on-chart display of strategy data and essential trading parameters.
- **MAVW Calculation (Proprietary):**
- Computes a series of weighted moving averages using Fibonacci-inspired lengths (3, 5, 8, 13, 21, 34) to generate a dynamic moving average (MAVW).
- The MAVW line is color-coded—blue when trending upward, red when trending downward, and yellow when neutral—to offer an immediate visual cue of market direction.
- **RSI Module:**
- Calculates the RSI on a user-selected price source (default: close) with a customizable period (default: 14).
- Adjustable thresholds (default: 45 and 55) allow for fine-tuning of overbought and oversold conditions.
- **TDI Component:**
- Adapts the RSI into a dynamic channel using a simple moving average and a scaled standard deviation (multiplied by 1.6185) to form upper and lower bands.
- Incorporates both fast and slow moving averages (default periods: 2 and 7) with optional band filling to visually highlight momentum changes.
- **Note:** The TDI logic is based on public methodologies for converting RSI data into a dynamic indicator.
- **WaveTrend Oscillator:**
- Uses configurable channel and smoothing parameters to generate a WaveTrend line for additional momentum confirmation.
- The oscillator is used to further validate top and bottom signals by identifying overbought or oversold conditions.
- **Note:** The WaveTrend calculations are derived from widely available, public-domain techniques.
- **Signal Generation:**
- **Buy Signal:** Generated when the RSI is below its lower threshold, the TDI fast MA crosses above the lower band (with prior bar confirmation), the price is below the MAVW, and the WaveTrend indicates oversold conditions.
- **Sell Signal:** Generated when the RSI is above its upper threshold, the TDI fast MA crosses below the upper band (with prior bar confirmation), the price is above the MAVW, and the WaveTrend signals overbought conditions.
- Signals are visually marked on the chart with upward and downward triangles and accompanied by alert conditions.
- **Volume-Based Bar Coloring & Additional Visuals:**
- Colors price bars based on volume relative to a moving average to highlight the strength of moves.
- Provides background color changes and a dynamic table of key metric values (MAVW, RSI, TDI bands, WaveTrend) for real-time analysis.
**Customization and Originality:**
- Extensive input parameters allow traders to adjust each component to suit their trading style and market conditions.
- The unique combination of the proprietary MAVW calculation with traditional RSI, TDI, and WaveTrend elements creates a robust system for detecting market tops and bottoms.
- **Closed-Source Justification:**
This indicator is published as a closed-source script due to the proprietary enhancements integrated into the MAVW algorithm and signal generation logic. These unique modifications provide added value beyond standard public indicators.

Trend Detector IndicatorTrend Detector Indicator
Class : trend oscillator/average analysis
Trading type : trading in trend
Time frame : 1 day
Purpose : trend detection
Level of aggressiveness : conservative
The key problem of trend following trading is danger of entering into position at extreme points of the trend with further trend reverse. Plus in any case it is very important to understand the phase of the trend cycle to be effective and successful trader.
Each trend can be divided into several phases: start of the trend, active development, consolidation phase, end of the trend. Obviously the most interesting phases for trading in trend are start and active development of the trend. At these phases risk of unsuccessful trading in trend direction is minimal, but profit opportunities are maximal. Still as a rule it is quite hard to detect the start of the trend. As the result probability of false signals is rather high.
Indicator «Trend Detector Indicator» is developed to identify the active phases of the trend cycle and helps to avoid trading at the end of the trend.
Using unique algorithm Indicator “TDI” allows to identify moments in price dynamics which are the most appropriate for trading in trend.
Structure of the indicator
Indicator consists of the TDI line and special colored zones:
- TDI line (multi-colored line in the indicator window) – is used to divide phases of the trend cycle, different colors signal about current type of price dynamics (blue color – uptrend, red color – downtrend, green – flat);
- Colored zones (blue, yellow and red colors depending on type of the signal) – are used for color indication of the trend cycle phases. Blue color means that trend is in active phase. Yellow warns about possible transition of the trend to the extinction. Entering the red zone is a signal of possible break of a trend.
Input parameters of the indicator
To set up the indicator a number of input parameters are used:
- Average period – averaging period. Responsible for the data filtration (by default = 13). The bigger the period is the less quantity of the signals would be, but the higher their quality is expected. Decrease of this parameter allows to increase the aggressiveness of the trading and the number of generated signals, but potentially this can decrease the quality of the signals
- Correlation period – period which is used in correlation analysis to calculate the correlation moment (by default = 21).
Rules of trading
Entering of the TDI line into blue zone and being there is a signal for active trading in current price direction. The direction of the tendency is indicated by the color of the TDI line: blue color – uptrend and “buy” signal, red color – downtrend and “sell” signal, green – flat, that means there is no dominating tendency and trading in trend should be postponed.
Since the basis for the trades are trend signals, their closing with profits or stops should be done when these signals lost relevance. So stop-loss and take-profit parameters are not provided. Such approach allows to avoid profit limitation by a certain number of points and to extract maximum from the active phase of the trend cycle, which is not limited in theory.
Change of the TDI line color in blue zone is a signal to close current long positions. Exit of the TDI line from blue zone is a signal to close current trend positions.

[DisDev] Tactical Analysis Part III: Oscillators🟩 Introducing the Oscillators Indicator by Disruptive Developers, a revolutionary tool designed to enhance your trading strategy. This indicator is the third part of our Tactical Analysis suite, combining two oscillator indicators to provide you with a comprehensive view of market conditions.
⚡ OVERVIEW ⚡
Key Features 🔑
Combines TDI Pro - Traders Dynamic Indicator by Dean Malone and WTO - Wave Trend Oscillator
Includes MFI - Money Flow Index and MACD - Moving Average Convergence Divergence
Incorporates VWAP - Volume Weighted Average Price
Benefits 💸
Enhances trading strategy by providing comprehensive market insights
Helps determine overbought or oversold conditions in ranging markets
Assists in identifying important entry and exit points
⚙️ CONFIGURATION & SETTINGS ⚙️
Inputs 🔧
Green / Red = The RSI Price-Line (Current Price Sentiment)
Dark Red = The Signal Line (Crossover for Entry & Exit)
Yellow = Market Base Line (Overall Sentiment)
Blue = Volatility Bands (Increasing/Decreasing Volatility)
Alerts 🔔
TDI Cross Short/Long Alerts
TDI MBL Cross Short/Long Alerts
TDI Hook Short/Long Alerts
💡 USAGE & STRATEGY 💡
Trading Strategies 📈
Look for regular and hidden divergences
Identify entries and exits based on crosses with Price-Line
Align trades with market sentiment
Timeframes and Symbols ⌚
Suitable for all timeframes and symbols
Optimized for Forex trading but applicable to all markets
🤖 DETAILS & METHODOLOGY 🤖
Algorithm and Calculation 🛡️
Based on the TDI indicator created by Dean Malone
Incorporates RSI, Signal Line, Market Base Line, and Volatility Bands
Signals for regular and hidden divergences
📚 ADDITIONAL RESOURCES 📚
Tutorials and Guides 📖
Detailed user manual available on our website
Video tutorials for setup and usage
Discord community forum for user discussions and tips
Visit our website for additional information, videos and pdf’s, link can be found below.
Chart Examples 📊
Trader’s Dynamic Index (TDI): Overbought/Oversold Signals
WaveTrend/Moneyflow/VWAP (WMV) Overbought/Oversold Signals
Tactical Analysis Indicator Suite. Parts I, II, and III.
🚀 CONCLUSION 🚀
In conclusion, the Tactical Analysis Part III: Oscillators indicator by Disruptive Developers is a powerful tool that combines multiple oscillators to provide a comprehensive view of market conditions. It is designed to enhance your trading strategy and help you make more informed trading decisions.
Access Parts I and II here:
Tactical Analysis Part I: High-Volume Recovery
Tactical Analysis Part II: Levels
⚠️ DISCLAIMER ⚠️
This indicator is provided as a tool for traders and should not be used as the sole basis for making trading decisions. Always conduct your own research and consider your risk tolerance before entering any trades.

[blackcat] L1 Trend Detection Index (TDI)Level: 1
Background
The trend detection index (TDI), which can be used to help detect when a trend has begun and when it has come to an end.
Function
The Trend Detection Index (TDI) is used to identify when a trend has started and when it ends. The TDI can be used as a stand-alone indicator or combined with others; It will work well when it comes to spotting the beginning of trends. However, this does not mean that its signals are absolutely accurate.
Inputs
Price --> Price source as input.
Length --> Length input can be adjusted to tune TDI performance.
Key Signal
MktPos --> 1 for long and -1 for short
Remarks
This is a Level 1 free but closed source indicator.
Feedbacks are appreciated.

MY:TDI/STOCH█ MY TDI / STOCH INDICATOR
This indicator shows a panel to display the Oversold and Overbought zones based on TDI and STOCHASTIC
The panel contains multiple elements :
• The top straight band : The STOCHASTIC overbought area
• The bottom straight band : The STOCHASTIC oversold area
• The middle waving band : The TDI Bollinger Bands
• The RSI line in Yellow
• 6 STOCHASTIC Lines : Period 15, 32 and 50
Behavior :
• When the STOCHASTIC lines are in the overbought area, their color changes from GRAY to RED
• When the 6 STOCHASTIC lines are in the overbought area, the top band background changes from GRAY to RED
• When the STOCHASTIC lines are in the oversold area, their color changes from GRAY to GREEN
• When the 6 STOCHASTIC lines are in the overbought area, the top band background changes from GRAY to RED
• When the RSI line is BELOW the Bollinger Bands, and with an oversold RSI, the line's color changes from YELLOW to GREEN
• When the RSI line is BELOW the Bollinger Bands, and with an oversold RSI, the Bollinger Bands changes from GRAY to GREEN
• When the RSI line is ABOVE the Bollinger Bands, and with an overbought RSI, the line's color changes from YELLOW to RED
• When the RSI line is ABOVE the Bollinger Bands, and with an overbought, the Bollinger Bands changes from GRAY to RED
A buy signal is when both Bollinger Bands background and Top+Bottom bands background are GREEN
A sell signal is when both Bollinger Bands background and Top+Bottom bands background are RED
THIS INDICATOR IS NOT BULLET PROOF, IT ONLY GIVES AN INDICATION ON POTENTIAL REVERSAL DUE TO OVERSOLD OR OVERBOUGHT.
IT IS NOT BECAUSE IT TRIGGERS A BUY OR SELL SIGNAL, THAT THE PRICE WON'T CONTINUE IN THE SAME DIRECTION FOR A COUPLE MORE CANDLES.
DON'T USE THIS INDICATOR BLINDLY, FOLLOW YOUR OWN ANALYSIS, AND USE THIS INDICATOR AS CONFIRMATION.
Alerts are available to notify you when a market is about (5min) to close or open.
To create an alert
• Open your chart
• Right click on the chart window
• Add Alerts for...
• Condition: chose My:TDI/STOCH - {{ticker}} - {{interval}} - Buy (for example)
• Options : Once per bar
• (OPTIONAL) update the title and description
• Validate

Jdawg TDI with Shark FinsThe "Jdawg TDI with Shark Fins" (JTDI Shark Fins) is a visually enhanced version of the Traditional Traders Dynamic Index (TDI) that focuses on aiding traders in identifying potential trading opportunities in any market.
At its core, the TDI is a momentum-based indicator that uses the Relative Strength Index (RSI) in combination with moving averages to highlight potential overbought and oversold conditions, which could signal opportunities to buy or sell. In simple terms, when an asset is overbought, it could be due for a price drop, and when it's oversold, the price might soon rise.
What makes the JTDI Shark Fins unique is the addition of color-coded "Shark Fins". These are key moments when the Fast Moving Average (Fast MA) or Slow Moving Average (Slow MA) lines move outside the upper or lower Bollinger Bands (the blue lines).
When a line moves outside these bands, it's often an indication that the price is making a strong move in that direction. However, because these moments are typically short-lived, they're referred to as "Shark Fins". In the JTDI, these periods are marked with color changes:
Fast MA turns purple when it forms a "Shark Fin". This line typically responds quicker to price changes.
Slow MA turns red when it forms a "Shark Fin". This line is slower to react to price changes, providing a more steady view of the market's momentum.
Additionally, the Slow MA will turn orange when it exceeds the overbought (above 70) or oversold (below 30) thresholds, indicating strong momentum in that direction.
How to Use:
When the Fast MA (black line) turns purple (indicating a Shark Fin), it's a warning signal to pay attention as a potential significant price move might be occurring.
If the Slow MA (green line) turns red, it indicates a more sustained move in the price direction is happening.
An orange Slow MA indicates a very strong price move in that direction.
Use these signals in conjunction with other aspects of your trading strategy to confirm potential trading opportunities.
Market Suitability:
The beauty of the JTDI Shark Fins indicator is its versatility. It can be applied to any market that can be charted and where price movements create periods of overbought or oversold conditions. This includes but is not limited to Forex, Cryptocurrencies, Equities (stocks), Commodities, and even Indices.
Remember, while this indicator can provide valuable insights, it should not be used in isolation. Always consider other factors like market news, economic indicators, and other technical analysis tools when making trading decisions.

Traders Dynamic Index Indicator Alert v0.1 by JustUncleLThis is a trend trading indicator+alert utilising the Traders Dynamic Index (TDI), Price Action Channel (PAC) and Heikin Ashi candles.
About 6months ago I came across the use of TDI in "E.A.S.Y. Method" that I found in forexfactory forums: www.forexfactory.com
and I was able to set up a chart based on the specifications by using Kurbelklaus scripts. However, I found that the alerts were being generated one or two bars too late, so at that time I was not successful using it with Binary Options. A few months later I found a variation of the method in the forecfactory forums which is able to generate the alerts a bit earlier, so this indicator is a modification of that early detection version.
The indicator can optionally use Heikin Ashi candles only for all it's calculation. I would recommend viewing the chart with Heikin Ashi candles, these smooth out the trends and makes trends very clear.
I found that this method it works good with most currency pairs or commodities and with 5min+ timeframe charts. I would suggest expiry of 2 to 6 candles.
ALERT GENERATION:
=================
The TDI (Traders Dynamic Index)
---------------------------------------------
Volatility Band VB(34), color: Blue, buffer: UpZone, DnZone
Relative Strength Index RSI(13)
RSI PRICE LINE (2), color: Green, buffer: mab
RSI TRADE SIGNAL LINE (7), color: Red, buffer: mbb
MARKET BASE LINE MID VB(34), color: Orange, buffer: mid
Indicator SignalLevels:
-------------------------------
RSI_OversoldLevel : 22 (normally: 32)
RSI_OverboughtLevel : 78 (normally: 68)
Alert Conditions:
-----------------------
Strong Buy : yellow
Medium Buy : aqua
Weak Buy : blue
Strong Sell : fuchsia
Medium Sell : purple
Weak Sell : black
Hints on How to use:
----------------------------
- When a Medium or Strong alert is generated and MACD histogram colour matches the direction
of the alert (optional auto filter), then place trade in direction of alert candle and MACD.
- I use the multi-Hull MA's for overall trend direction confirmation.
- Best positions normally occur near the MACD(5,15,1) Histogram crossing the zero line.
- The optional coloured Dots along the bottom of the indicator represent the first alert
of this type that was generated in this sequence.
- It is advisable to trade in the direction of the main trend as indicated the HULL MA red cloud:
if red cloud underneath PAC then BULLISH trend, if red cloud above PAC then BEARISH trend.
- Selecting the HeiKin Ashi candles does affect the MACD and MA caculations, so if you select
normal candles the result chart will change. You can still Optionally select to use Heikin Ashi
for calculations.
- When using the Heikin Ashi candles, a good buy entry is indicated by long top wick and no bottom wick
for bull (green) candles and good sell entry is indicated by long bottom wick and no top wick for
bear (red) candles.
- When the MACD histogram is flat and close to zero line,
this indicates a ranging market, do NOT trade when this occurs.
- When the PAC channel on the main chart is spread apart widely, this is an indication
of extreme volatility and choppy chart, do NOT try to trade during these periods.
A choppy chart is also indicated by Heikin Ashi candles with long wicks on both sides
of the candles.
- You can specify what strength level Alerts are generated (default 2):
Level (1) means only generate Strong Alerts only.
Level (2) means generate Strong and Medium Alerts.
Level (3) means generate Strong, Medium and Weak Alerts.

ASFX A2 Entry (Beta)This script is a counter intuitive pullback system.
Directional bias:
The system is suitable for trading markets where a strong trend is present.
The trend is measured by the SMA of the RSI (middle of the TDI) also known as the L50.
When this SMA is above 50 the market is deemed bullish.
When this SMA is below 50 the market is deemed bearish.
The duration of time above and below the center 50 accentuates the current directional bias.
When each EMA is below its longer term EMA, the market is said to be in full trend bearish.
When each EMA is above its longer term EMA, the market is said to be in full trend bullish.
The EMAs and TDIs run in the background so as to allow the trader to focus on signals.
Letter gradings and colour are applied to the trend strength with A being the highest.
Counter trend signals are available if the trader wishes.
Signal painting can be selected and deselected by letter.
The letter grading system is covered by selecting the rules feature in the settings which will bring up a table.
The rules table will give more detail as to the specifics of the system if the trader wishes to see them.
Signal:
The signal occurs when we have our directional bias and a candle breaks the 21 EMA and closes in the direction opposite to our bias.
The midway point of the candle body must close however in the direction of our bias (below for shorts, above for longs)
Hypothesis and example:
We want to join a strong trend at the best possible price.
If we are in an uptrend we can join on a break and close of a candle below the 21 EMA, if the uptrend is to continue this would be a 'cheap' price for long positions
If we are in a downtrend we can join on a break and close of a candle above the 21 EMA, if the downtrend is to continue this would be an 'expensive' price for short positions.
