Tillson Moving Average(ema) singleT3 Moving Average indicator was originally developed by Tim Tillson in 1998/99.
T3 Moving Average is considered as improved and better to traditional moving averages as it is smoother and performs better in trending market conditions.
It offers multiple opportunities when the price is in the state of retracement and therefore allows to minimize your exposed risk and allowing your profits run.
This version provides simple T3 MA
Source options - all standard + HA
T3 based on 6x ema
Only adds 1 T3 MA on chart
Consider a tip in ETH to
0xac290B4A721f5ef75b0971F1102e01E1942A4578
Thank you and have a nice day
CryptoJoncis
Cerca negli script per "TIM投资动向"
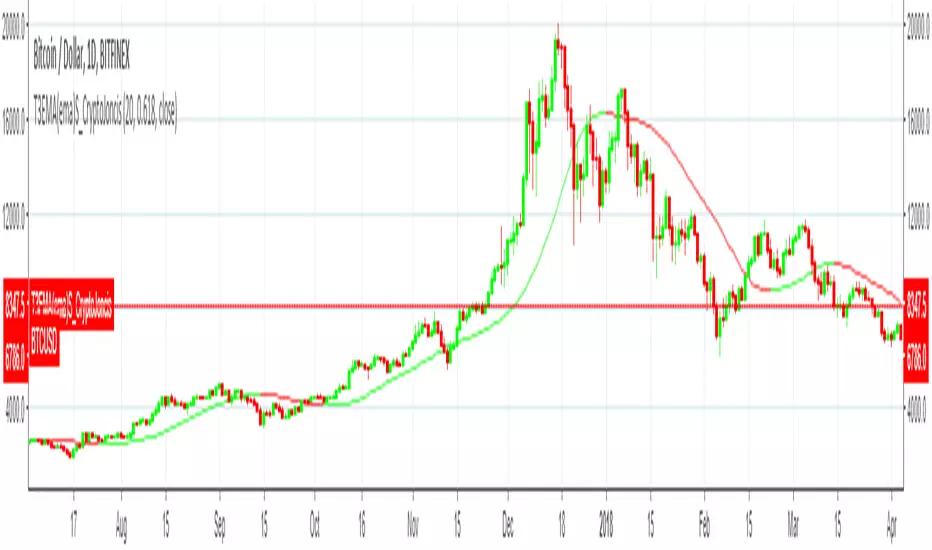
TT3 indicatorHow does this indicator works and what it is?
It consist of 3 T3 moving averages. T3 moving average was developed by by Tim Tillson and is considered superior to traditional moving averages as it is smoother, more responsive and thus performs better in ranging market conditions as well.
This indicator works on any stock, index, future or cryptocurrency.
The ways how you can use it:
When the price is above the green band, trade with longs
When the price is below the red band, trade with shorts
When the price crosses down Signal T3 while above the green band, close the long position and reopen it only if price breaks up above the Signal T3 and is above green band.
When the price crosses up Signal T3 while below the red band, close short position. If price drops down below Signal T3, open short position again.
The bands are working as supports and resistances. When price is above the green band and drops, there is a high chance it will bounce back as soon as it hits the Long Band T3. (It will act as support)
When price is below the red band and rises, there is a high chance it will bounce back as soon as it hits the Short Band T3 (it will act as resistance)
Any ideas, feedback and comments will be really helpful.
Consider to tip me if this indicator is any use for you and think that I should make more of them to help the community of traders.
ETH: 0xac290B4A721f5ef75b0971F1102e01E1942A4578
BTC: 39p3rKuJYKGqph1Qs35yEfNWoPvpUJBBcy

Ehlers DSMA by Tim D.The Deviation-Scaled Moving Average from July 2018 TASC. "In “The Deviation-Scaled Moving Average” in this issue, author John Ehlers introduces a new adaptive moving average that has the ability to rapidly adapt to volatility in price movement. The author explains that due to its design, it has minimal lag yet is able to provide considerable smoothing."

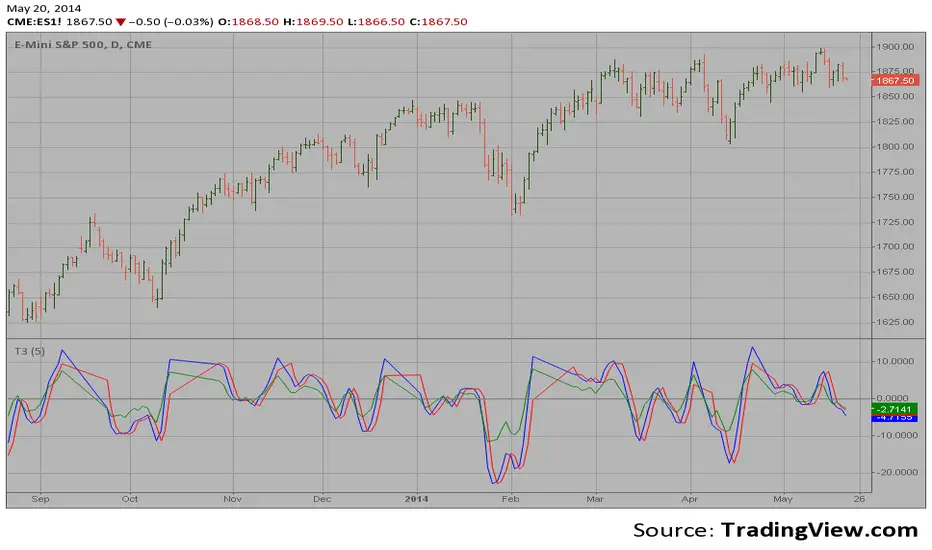
T3 Moving AverageT3 Moving Average indicator script based on the article `Smoothing Techniques For More Accurate Signals` by Tim Tillson (Stocks & Commodities V16:1 (33-37))

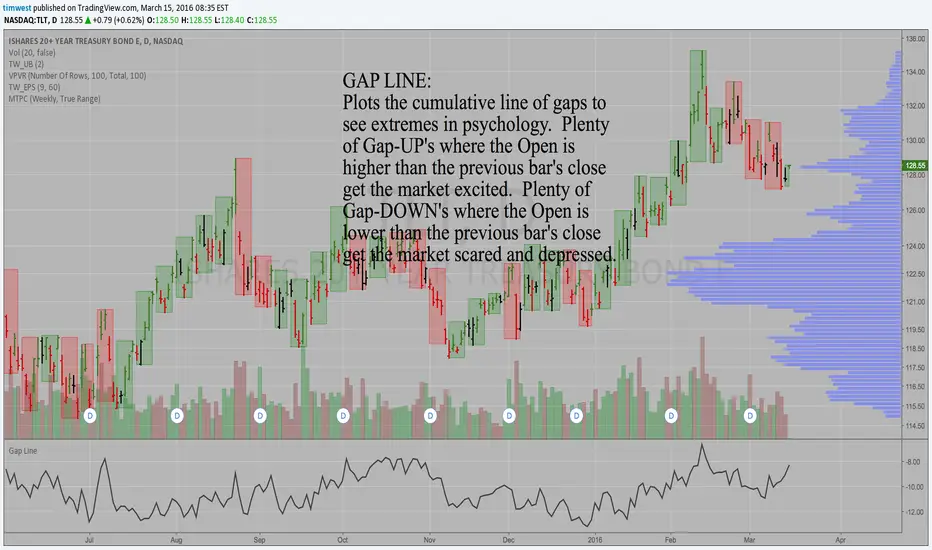
Gap LineGAP LINE:
Plots the cumulative line of gaps to see extremes in psychology.
Plenty of Gap-UP's where the Open is higher than the previous bar's close get the market excited.
Plenty of Gap-DOWN's where the Open is lower than the previous bar's close get the market scared and depressed.
Look for the Gap Line to peak prior to an important peak in the market and vice versa. Look for a low in the Gap Line prior to an important low in the market.
Simple, but effective.
Tim
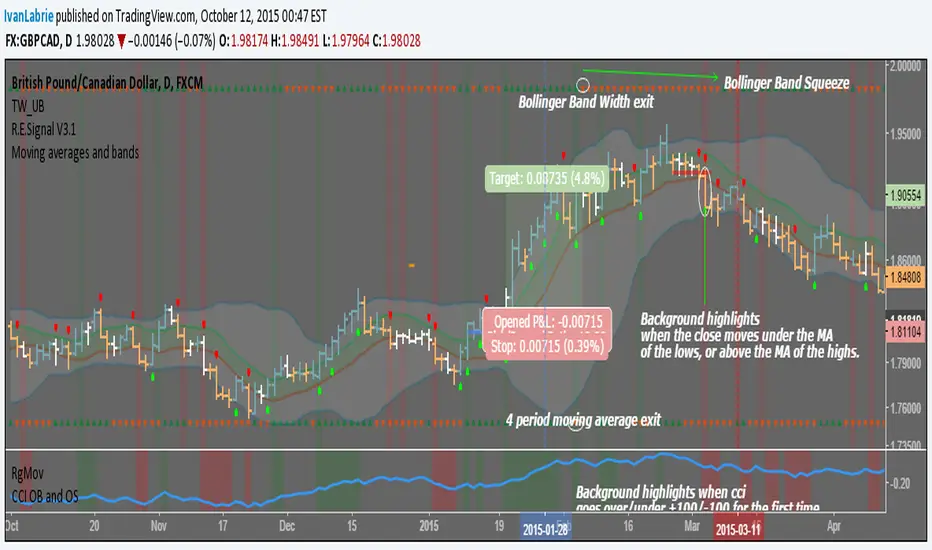
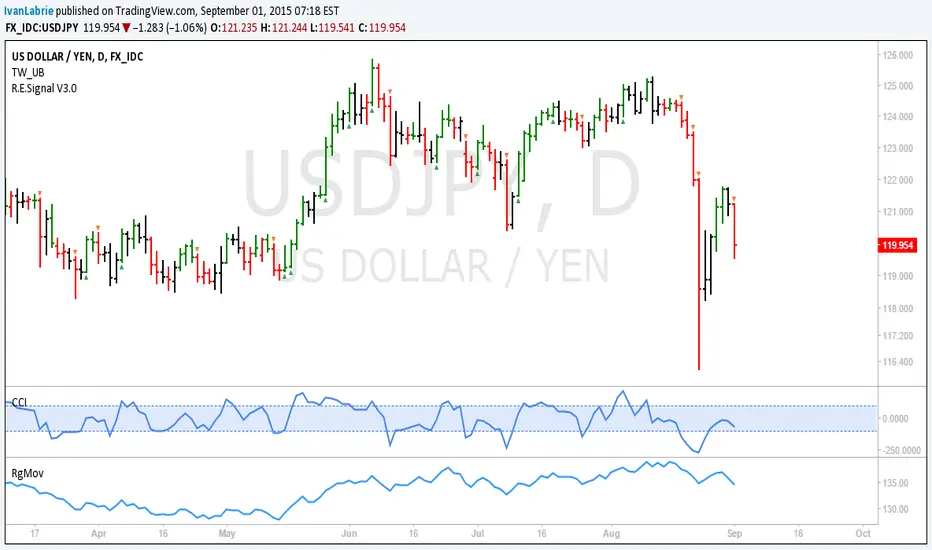
Moving averages and bandsI coded this simple indicator based on multiple ideas shared by Tim West at his "Key Hidden Levels" chatroom.
We have a moving average ribbon comprised of the average of the highs and lows in 10 periods. The colored space in between acts more or less like fair value and is often where price is when consolidating.
Green and red triangles at the top and bottom of the screen.
The ones at the bottom, correspond to signals obtained from a 4 period moving average of the close's slope. It helps get excellent exits for trending moves by changing color with the moving average slope.
The ones at the top, are green while Bollinger Band Width increases, and red while it decreases, relative to the previous bar.
Background color highlights when the close moves over the moving average of the highs or under the moving average of the lows, indicating a change of trend is possible, or at least a pause/consolidation.
The idea is to have multiple reasons to stay in a trade, which is normally very hard to do, specially when winning.
Cheers,
Ivan Labrie
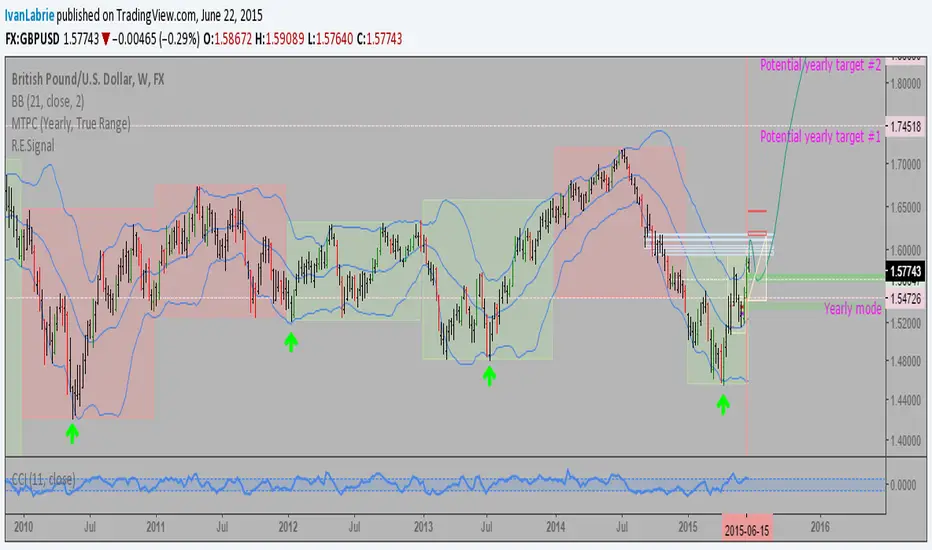
Time at Mode FX
R.E.Signal V3.1: Code updateI removed the outside bar filter for range expansion bars.
You will need Tim West's TW_UB indicator to plot those. It'll be more useful if you use both, since you can see when prices trend or consolidate visually by seeing the bar colors alongside the range expansions.
Cheers,
Ivan.

R.E.Signal V3.0: Updated version to work with Key Hidden LevelsHi, I updated the code to be able to use Tim West's TW_UB indicator, which helps a lot with seeing price waves, coloring bars that form new highs green, new lows red and inside and outside bars red.
The indicator now only plots range expansion bars, with a triangle shape above or below each bar to make it visually clear.
Hope you find this of use.
Cheers,
Ivan.
R.E.Signal V2.0: Improved Tim West inspired codeHi, this is version 2.0 of the Range Expansion Signal indicator, now including inside and outside bars.
I'm looking forward to tradingview to include other price feeds, since I'd love to trade FX from this site.
Cheers,
Ivan.

R.E.Signal: Incredibly useful scriptI coded this one using Tim West's concept of range expansion bars.
It's a nice addition to switch back and forth when using his UDIO bars from the Key Hidden Levels indicator pack to analyze price action on a bar by bar basis.
The indicator plots a red or green bar signaling strong buying on selling, which almost always implies continuation, or a good chance to fade any retracements after said bars.
Cheers,
Ivan.
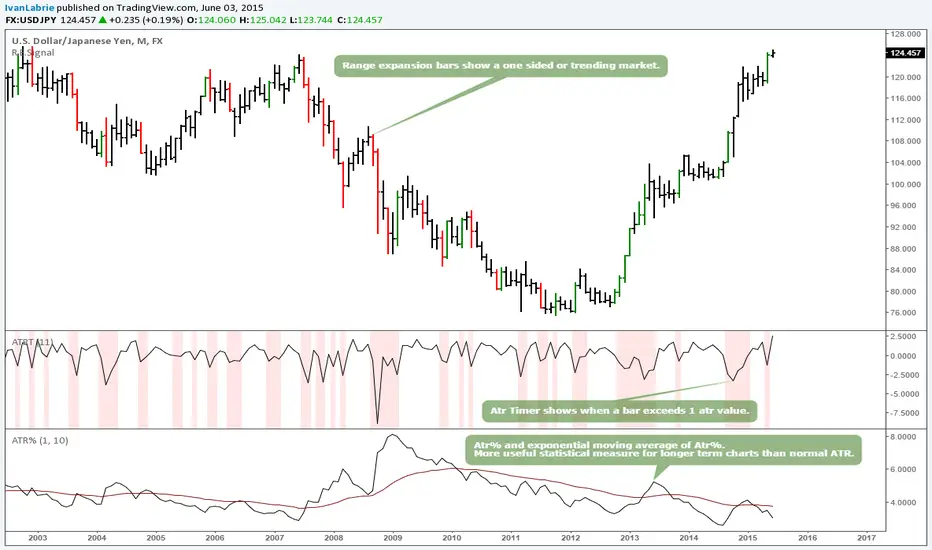
ATR%, ATR Timer and Range Expansion signalThese 3 indicators can be really useful.
The usage is fairly straightforward, if you understand price action, having an statistical edge like these provide can be useful.
Refer to Tim West's charts to learn more about range expansion bars.
The idea for the Atr% and Atr timer come from discussions I had with Yacine Kanoun, props to him for his contribution.
T3 3 Averages This function is an Pine version of the moving average described in
the January, 1998 issue of S&C magazine, p.57, "Smoothing Techniques
for More Accurate Signals", by Tim Tillson. It is translated from the
MetaStock code presented in the article. The function uses a version
of the XAverage, written by me, which allows variables as inputs.
The most popular method of interpreting a moving average is to compare
the relationship between a moving average of the security's price with
the security's price itself (or between several moving averages).