AutoPivot Levels with Alerts [ChartWhizzperer] – Dynamic EditionAuto-Pivot Levels 4 methods with alerts – Dynamic Edition
Now with
- Live Mode
- 4 Pivot Methods
- 7 Session Types (5m, 15m, 30m, Hourly, Daily, Weekly, Monthly)
- PineConnector-Ready Alerts!
Free, Open Source, Pine Script v6-compliant.
NEW: Live Mode (Ultra-Dynamic, Repainting) – Switchable in UI!
Instantly switch between Classic (session-based, repaint-free) and Live (rolling window, real-time, repainting) using the simple checkbox in the settings!
Live Mode recalculates all pivots on every tick/bar, using the current high/low/close for the chosen session (5m, 15m, 30m, hourly, daily, weekly, monthly).
Perfect for:
- Scalping and high-frequency trading
- Real-time bot/automation setups (PineConnector-ready)
- Fast-moving or breakout markets
Classic Mode: For traditional, stable levels based on confirmed session data – ideal for backtesting and trading history.
Four Calculation Methods (Choose What Fits YOU)
1. Classic
Standard pivot calculation.
Based on previous session’s High, Low, Close.
Simple, proven, and suitable for any asset.
2. Fibonacci
Projects levels using Fibonacci ratios of the prior session’s range.
Great for traders who want to align pivots with fib retracements and extensions.
3. Camarilla
Uses unique multipliers for support/resistance, focusing on mean reversion and volatility.
Popular among futures and forex day traders.
4. Woodie
Puts extra weight on previous Close for more responsive pivots.
Often used in trending or choppy conditions.
Switch methods anytime in the UI – the script recalculates instantly and keeps your chart clean!
Level-Specific Alerts – PineConnector Ready!
Dedicated alert for EVERY level and direction (Up/Down):
Pivot (P), R1, R2, R3, S1, S2, S3
No configuration hassle:
All alerts are pre-defined in the TradingView Alert Panel and work across all session types (5m → monthly).
Machine-readable message format:
PIVOT=R1 DIR=UP SYMBOL={{ticker}} PRICE={{close}}
Direct plug-and-play with PineConnector, webhooks, Discord, Telegram, bots, and other automation tools.
Never miss a breakout, reversal, or key support/resistance touch!
Powerful Customization & Performance
- Session selection: 5m, 15m, 30m, Hourly, Daily, Weekly, Monthly (choose what suits your trading style).
- Show/hide any level (Pivot, R1–R3, S1–S3) for minimal chart clutter.
- Color selection for each level to match your theme or highlight key pivots.
- Auto-cleanup: Old lines and labels are cleared on every recalculation or session change for maximum performance and visual clarity.
- Zero runtime errors: Strict Pine Script v6 practices for stability.
How To Use – Quick Start
1) Add the indicator to your TradingView chart.
2) Pick your calculation method (Classic, Fibonacci, Camarilla, Woodie).
3) Set session type (5m, 15m, 30m, Hourly, Daily, Weekly, Monthly).
4) Switch between Classic and Live Mode with a single click in settings.
5) Customize your levels (on/off, colors).
6) Open the Alert Panel, select any pre-configured alert (e.g. "R2 Cross Down"), and go live!
7) Connect with PineConnector or any webhook system instantly using the pre-formatted alert messages.
Who Is It For?
- Active scalpers & bot traders: Live Mode + PineConnector-ready alerts = instant, automated reactions.
- Swing and position traders: Use Classic Mode for stable, repaint-free levels.
- Strategy developers: Seamless integration into automated and manual trading workflows.
License & Community
Open Source, Non-Commercial:
Free for personal & educational use under CC BY-NC-SA 4.0.
Feedback, bug reports & ideas:
Drop a comment, or contact me for feature requests.
Trade smart. Trade dynamic. Unlock the true power of pivots – with ChartWhizzperer!
Cerca negli script per "alert"

XAUUSD Multi-Timeframe Supertrend Alert v2**Indicator Overview: XAUUSD Multi-Timeframe Supertrend Alert v2**
**Core Components:**
1. **Multi-Timeframe Supertrend System**
- Two Supertrend indicators (ST1 & ST2) with customizable timeframes
- ST1 typically set to Daily, ST2 to Weekly as main trend
- Visualized with distinct colors and background fills
2. **Customizable SMA**
- Adjustable period and timeframe
- Plotted as blue line for additional trend reference
3. **Neutral Zone System**
- Creates a neutral line offset from ST1 by customizable tick distance
- Yellow dashed line that adjusts based on ST1 trend direction
- **Alert Conditions:**
- **Test Buy Zone**: Both ST1 & ST2 in uptrend AND price enters neutral zone above ST1
- **Test Sell Zone**: Both ST1 & ST2 in downtrend AND price enters neutral zone below ST1
4. **Distance Lines from ST2**
- Upper/lower lines at customizable tick distance from ST2
- Purple dashed lines with touch alerts
**Trading Signals:**
- **Bullish Signal**: Price above ST2 but below ST1 (potential buy)
- **Bearish Signal**: Price below ST2 but above ST1 (potential sell)
- **Neutral Zone Alerts**: Price enters defined zone when both trends align
- **Line Touch Alerts**: Price touches distance lines from ST2
**Alert System:**
- Limited to 3 consecutive alerts per signal type
- Visual markers (triangles, diamonds, circles)
- Background coloring for signal zones
- Separate alert conditions for each signal type
**Visual Features:**
- Candles colored green/red based on signals
- Clear trend visualization with colored backgrounds
- Real-time alert markers without information table clutter
This indicator provides multi-timeframe trend analysis with precise entry zone detection and comprehensive alert system for XAUUSD trading. SAM89 M15, ST1 (5:10) M5, ST2 ( 1,5:20) H1, Test Buy Sell 7000, Line 15000

BMSB Watchlist Alert - Daily w/ 1% Proximity# Bull Market Support Band - Daily Updates with Proximity Alerts
## Overview
This indicator tracks the Bull Market Support Band (20-week SMA and 21-week EMA) with daily resolution updates and proximity warnings. The weekly moving averages update every day on your chart, giving you more frequent signals than traditional weekly-only scripts.
## What It Does
The script monitors price action relative to the BMSB and generates alerts for:
- Price crossing above or below either the 20W SMA or 21W EMA
- Price coming within 1% of either moving average (early warning system)
This proximity feature is useful for catching potential support/resistance tests before they actually happen, giving you advance notice to prepare for entries or exits.
## Key Features
- Weekly MAs that update daily for more responsive monitoring
- Configurable proximity threshold (default 1%, adjustable from 0.1% to 5%)
- Visual proximity zones shown as dotted lines around each MA
- Color-coded background highlighting (green when above both MAs, red when below both, orange when in proximity zone)
- On-chart labels for crosses and proximity warnings
- Status table showing current position relative to the band
## Setup for Watchlist Alerts
1. Add the indicator to any chart
2. Create alerts using these conditions:
- "BMSB Cross Alert" - fires on actual crosses
- "BMSB Proximity Alert" - fires when entering the 1% zone
3. Set interval to 1 day (recommended) or 4 hour for more frequent checks
4. Use "Once Per Bar Close" for the trigger option
5. Apply the same alert to your entire watchlist
## Settings
You can toggle on/off:
- Cross above alerts
- Cross below alerts
- Proximity alerts
- Proximity percentage adjustment
- Visual elements (labels, MA lines, proximity zones)
## Notes
The BMSB is commonly used in crypto markets to identify bull market pullback support levels. This implementation adds the proximity warning system to help you anticipate potential tests of these key levels rather than waiting for confirmed crosses.
Works on any timeframe but designed for daily monitoring of weekly moving averages.

MK_OSFT - Multi-Timeframe MA Dashboard with Alerts - v1.0Multi-Timeframe Moving Average Dashboard with Advanced Alerts
A comprehensive multi-timeframe moving average indicator that displays MA levels from 6 different timeframes simultaneously on your chart, complete with intelligent labeling, customizable alerts, and performance-optimized plotting.
*** Key Features ***
Multi-Timeframe Analysis
Monitor MA levels from 6 timeframes: 5m, 15m, 1H, 4H, Daily, and Weekly
Clean visual separation with customizable colors for each timeframe
Smart label positioning prevents overlapping and ensures readability
Intelligent Alert System
Individual alert toggles for each timeframe
Cross-above and cross-below MA alerts with once-per-bar frequency
Alerts only trigger on confirmed timeframe closes (no false signals)
Works across all trading pairs on your current chart
Flexible Display Options
Toggle individual timeframe visibility
Choose between SMA and EMA calculations
Adjustable MA length (default: 12 periods)
Two source options: Current Bar or Last Confirmed Bar
Customizable line widths, label sizes, and colors
Advanced Plotting System
Optional plot lines that don't clutter your Style tab
Performance-optimized line drawing with historical data support
"Wait till close" behavior for smooth higher timeframe representation
Clean horizontal segments that update only on timeframe closes
Real-Time Information Table
Live countdown timers showing time remaining until each timeframe closes
Visual indicators for current price position relative to each MA
Cross direction indicators (↑/↓) for quick trend assessment
Show/Alert status display for easy configuration verification
*** Settings Overview ***
Moving Average Settings
MA Length: Adjustable period (default: 12)
MA Type: SMA or EMA
Source: Current bar vs Last confirmed bar
Individual Timeframe Controls
Show/Hide toggles for each timeframe
Individual alert enable/disable
Optional plot line with custom width
Color customization per timeframe
Visual Customization
Label size options (tiny, small, normal, large)
Label offset positioning
Minimum gap between labels to prevent overlap
Drawing order preference (larger timeframes first/last)
Smart Features
Automatic label collision detection and adjustment
Real-time countdown timers (only on live bars)
Debug table with comprehensive timeframe information
Built-in alert setup instructions
Perfect For
Swing traders monitoring multiple timeframe confluences
Day traders seeking higher timeframe bias confirmation
Anyone wanting clean, organized multi-timeframe MA analysis
Traders who need reliable alerts without false signals
Performance Optimized
Efficient line drawing system (no Style tab clutter)
Smart historical data handling
Minimal resource usage with intelligent update cycles
Works smoothly on all timeframes and symbols
Transform your chart into a comprehensive multi-timeframe analysis dashboard with this professional-grade moving average indicator.

ATR > VXN Alert (5m)ATR > VXN Volatility Divergence Indicator
This custom TradingView indicator monitors real-time volatility divergence between realized volatility (via Average True Range, ATR) and implied volatility (via the CBOE NASDAQ Volatility Index, VXN). It is inspired by the GJR-GARCH (Glosten-Jagannathan-Runkle Generalized Autoregressive Conditional Heteroskedasticity) model, which captures asymmetric volatility dynamics—particularly how markets respond more sharply to negative shocks than to positive ones.
Core Logic:
Chart on NQ (5 minute timeframe)
ATR (5-min) reflects realized intraday volatility of the Nasdaq 100 futures (NQ).
VXN (5-min, delayed) represents forward-looking implied volatility.
The indicator highlights regime shifts in volatility:
ATR < VXN: Volatility compression → potential energy building up (market coiling).
ATR > VXN: Volatility expansion → real movement exceeds expectations → potential breakout zone.
Visuals & Alerts:
Background turns green when ATR crosses above VXN, signaling a bullish expansion regime.
Background turns red when ATR drops below VXN, signaling compression or risk-off environment.
Custom alerts trigger on volatility regime shifts for breakout traders.
Application (Manual GJR-GARCH Strategy):
Similar to how the GJR-GARCH model captures volatility clustering and asymmetry, this indicator identifies when actual price volatility (ATR) begins to spike beyond implied forecasts (VXN), often after periods of contraction—mirroring a conditional variance shock in the GARCH framework.
Traders can align with directional bias using technical confluence (order flow, structure breaks, liquidity zones) once expansion is confirmed.

[Smith] VWAP Deviation + VWAP Deviation +
Short Description:
Advanced VWAP indicator with deviation bands, smart signal filtering, and session-based performance tracking. Features log-space scaling, RSI confirmation, volume filters, and market regime detection.
Full Description:
The VWAP Deviation + is a comprehensive trading indicator that combines Volume Weighted Average Price (VWAP) analysis with advanced signal filtering to identify high-probability trade opportunities. This indicator goes beyond basic VWAP by incorporating multiple confirmation layers and intelligent market analysis.
🎯 Key Features
Core VWAP Analysis:
- Custom volume-weighted mean calculation with deviation bands (2σ and 3σ)
- Optional log-space scaling for proportional price movements
- Real-time VWAP line with customizable visibility
Smart Signal Detection:
- RSI confirmation for all trade signals
- Volume filter requiring above-average trading activity
- Market regime detection (trending vs ranging markets)
- Optional RSI divergence analysis
Advanced Filtering:
- Multi-condition signal validation
- Session-based performance tracking (Asian, London, NY)
- Real-time win rate calculation
- Strong vs regular signal classification
Visual Features:
- Clean, professional interface with customizable colors
- Optional signal shapes and annotations
- Performance statistics table
- Filled deviation bands for easy visualization
📊 How It Works
The indicator identifies trade opportunities when:
1. Price touches VWAP deviation bands (2σ or 3σ)
2. RSI confirms oversold/overbought conditions
3. Volume exceeds the specified threshold
4. Market regime conditions are favorable
Signal Types:
- LONG : Price at lower bands + RSI oversold + volume confirmation
- SHORT : Price at upper bands + RSI overbought + volume confirmation
- STRONG : Same conditions but at 3σ bands for higher conviction trades
⚙️ Customization Options
Core Settings:
- VWAP length and source selection
- Adjustable deviation multipliers
- Log-space scaling toggle
Signal Filters:
- RSI length and threshold levels
- Volume filter with customizable multiplier
- Market type filtering options
Advanced Features:
- Session statistics tracking
- RSI divergence detection
- Market regime analysis
Visual Controls:
- Show/hide individual components
- Custom color schemes
- Signal display toggles
🔔 Alert System
Built-in alerts for:
- Long and short trade opportunities
- Strong signal confirmations
- RSI divergence signals
💡 Best Practices
- Use higher timeframes (15m+) for more reliable signals
- Combine with additional confirmation indicators
- Pay attention to session statistics for timing optimization
- Monitor market regime indicators for context
This indicator is suitable for day traders, swing traders, and anyone looking to improve their VWAP-based trading strategies with advanced filtering and market analysis.

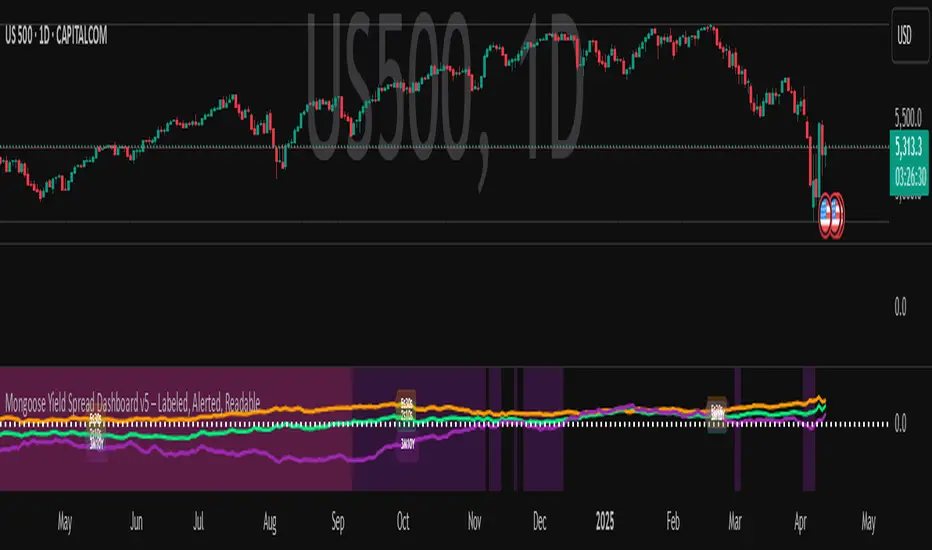
Mongoose Yield Spread Dashboard v5 – Labeled, Alerted, ReadableCurveGuard: Mongoose Edition
Track the macro tide before it turns.
This tool visualizes the three most-watched U.S. Treasury yield curve spreads:
2s10s (10Y - 2Y)
5s30s (30Y - 5Y)
3M10Y (10Y - 3M)
Each spread is plotted with dynamic color logic, inversion alerts, and floating labels. Background shading highlights historical inversion zones to help spot macro regime shifts in real time.
✅ Alert-ready
✅ Dark mode optimized
✅ Floating labels
✅ Clean layout for fast macro insight
📌 For educational and informational purposes only.
This script does not provide financial advice or trade recommendations.
Auto TrendLines [TradingFinder] Support Resistance Signal Alerts🔵 Introduction
The trendline is one of the most essential tools in technical analysis, widely used in financial markets such as Forex, cryptocurrency, and stocks. A trendline is a straight line that connects swing highs or swing lows and visually indicates the market’s trend direction.
Traders use trendlines to identify price structure, the strength of buyers and sellers, dynamic support and resistance zones, and optimal entry and exit points.
In technical analysis, trendlines are typically classified into three categories: uptrend lines (drawn by connecting higher lows), downtrend lines (formed by connecting lower highs), and sideways trends (moving horizontally). A valid trendline usually requires at least three confirmed touchpoints to be considered reliable for trading decisions.
Trendlines can serve as the foundation for a variety of trading strategies, such as the trendline bounce strategy, valid breakout setups, and confluence-based analysis with other tools like candlestick patterns, divergences, moving averages, and Fibonacci levels.
Additionally, trendlines are categorized into internal and external, and further into major and minor levels, each serving unique roles in market structure analysis.
🔵 How to Use
Trendlines are a key component in technical analysis, used to identify market direction, define dynamic support and resistance zones, highlight strategic entry and exit points, and manage risk. For a trendline to be reliable, it must be drawn based on structural principles—not by simply connecting two arbitrary points.
🟣 Selecting Pivot Types Based on Trend Direction
The first step is to determine the market trend: uptrend, downtrend, or sideways.
Then, choose pivot points that match the trend type :
In an uptrend, trendlines are drawn by connecting low pivots, especially higher lows.
In a downtrend, trendlines are formed by connecting high pivots, specifically lower highs.
It is crucial to connect pivots of the same type and structure to ensure the trendline is valid and analytically sound.
🟣 Pivot Classification
This indicator automatically classifies pivot points into two categories :
Major Pivots :
MLL : Major Lower Low
MHL : Major Higher Low
MHH : Major Higher High
MLH : Major Lower High
These define the primary structure of the market and are typically used in broader structural analysis.
Minor Pivots :
mLL: minor Lower Low
mHL: minor Higher Low
mHH: minor Higher High
mLH: minor Lower High
These are used for drawing more precise trendlines within corrective waves or internal price movements.
Example : In a downtrend, drawing a trendline from an MHH to an mHH creates structural inconsistency and introduces noise. Instead, connect points like MHL to MHL or mLH to mLH for a valid trendline.
🟣 Drawing High-Precision Trendlines
To ensure a reliable trendline :
Use pivots of the same classification (Major with Major or Minor with Minor).
Ensure at least three valid contact points (three touches = structural confirmation).
Draw through candles with the least deviation (choose wicks or bodies based on confluence).
Preferably draw from right to left for better alignment with current market behavior.
Use parallel lines to turn a single trendline into a trendline zone, if needed.
🟣 Using Trendlines for Trade Entries
Bounce Entry: When price approaches the trendline and shows signs of reversal (e.g., a reversal candle, divergence, or support/resistance), enter in the direction of the trend with a logical stop-loss.
Breakout Entry: When price breaks through the trendline with strong momentum and a confirmation (such as a retest or break of structure), consider trading in the direction of the breakout.
🟣 Trendline-Based Risk Management
For bounce entries, the stop-loss is placed below the trendline or the last pivot low (in an uptrend).
For breakout entries, the stop-loss is set behind the breakout candle or the last structural level.
A broken trendline can also act as an exit signal from a trade.
🟣 Combining Trendlines with Other Tools (Confluence)
Trendlines gain much more strength when used alongside other analytical tools :
Horizontal support and resistance levels
Moving averages (such as EMA 50 or EMA 200)
Fibonacci retracement zones
Candlestick patterns (e.g., Engulfing, Pin Bar)
RSI or MACD divergences
Market structure breaks (BoS / ChoCH)
🔵 Settings
Pivot Period : This defines how sensitive the pivot detection is. A higher number means the algorithm will identify more significant pivot points, resulting in longer-term trendlines.
Alerts
Alert :
Enable or disable the entire alert system
Set a custom alert name
Choose how often alerts trigger (every time, once per bar, or on bar close)
Select the time zone for alert timestamps (e.g., UTC)
Each trendline type supports two alert types :
Break Alert : Triggered when price breaks the trendline
React Alert : Triggered when price reacts or bounces off the trendline
These alerts can be independently enabled or disabled for all trendline categories (Major/Minor, Internal/External, Up/Down).
Display :
For each of the eight trendline types, you can control :
Whether to show or hide the line
Whether to delete the previous line when a new one is drawn
Color, line style (solid, dashed, dotted), extension direction (e.g., right only), and width
Major lines are typically thicker and more opaque, while minor lines appear thinner and more transparent.
All settings are designed to give the user full control over the appearance, behavior, and alert system of the indicator, without requiring manual drawing or adjustments.
🔵 Conclusion
A trendline is more than just a line on the chart—it is a structural, strategic, and flexible tool in technical analysis that can serve as the foundation for understanding price behavior and making trading decisions. Whether in trending markets or during corrections, trendlines help traders identify market direction, key zones, and high-potential entry and exit points with precision.
The accuracy and effectiveness of a trendline depend on using structurally valid pivot points and adhering to proper market logic, rather than relying on guesswork or personal bias.
This indicator is built to solve that exact problem. It automatically detects and draws multiple types of trendlines based on actual price structure, separating them into Major/Minor and Internal/External categories, and respecting professional analytical principles such as pivot type, trend direction, and structural location.

Custom Previous High/Low + Breakout AlertsThis indicator plots the previous high and low of the selected timeframe and alerts you when the price breaks either level.
To prevent spam, it triggers only once per period. If both the high and low break within the same period, you will receive an alert for each, but no duplicates if price hovers around these levels.
How to Set Up Alerts
1. Choose Your Timeframe
- In the indicator settings, select the timeframe for the high/low reference.
- Example: If you select 1 hour, the indicator will plot the previous 1-hour high and low and alert you when either level is broken
2. Create an Alert
- Condition → High/Low Break Alerts
- Function → Any alert() function call
Optional:
- If you want alerts only for high breakouts or low breakouts, select High Breakout or Low Breakout and use "Once Per Bar" as the trigger. (It will still alert only once per period.)
3. Setting Alerts for Multiple Timeframes
- If you want to create another alert for a different timeframe, first select the new timeframe in the indicator settings, then create a new alert
- Note: Previous alerts will continue to notify you based on the timeframe they were originally set for, even if you change the timeframe in the indicator settings.

PDH & PDL Indicator: Previous Day's High/Low with AlertsThe PDH & PDL Indicator plots the Previous Day's High (PDH) and Previous Day's Low (PDL) directly on the chart, providing a clear visual reference for key price levels. These levels are often used by traders to identify potential breakout or breakdown zones and to gauge market strength or weakness.
Features:
PDH (Green Line) : Represents the high of the previous trading day.
PDL (Red Line): Represents the low of the previous trading day.
Alerts:
Get notified when the price crosses above PDH or below PDL.
Custom alert messages to keep you informed in real-time.
Use Cases:
Identify key breakout and breakdown points for potential trade entries or exits.
Confirm the strength of a trend by monitoring price action relative to PDH and PDL.
Useful for intraday, swing, and positional traders who rely on historical price levels for strategy development.

Alligator + Fractals + Divergent & Squat Bars + Signal AlertsThe indicator includes Williams Alligator, Williams Fractals, Divergent Bars, Market Facilitation Index, Highest and Lowest Bars, maximum and minimum peak of Awesome Oscillator, and signal alerts based on Bill Williams' Profitunity strategy.
MFI and Awesome Oscillator
According to the Market Facilitation Index Oscillator, the Squat bar is colored blue, all other bars are colored according to the Awesome Oscillator color, except for the Fake bars, colored with a lighter AO color. In the indicator settings, you can enable the display of "Green" bars (in the "Green Bars > Show" field). In the indicator style settings, you can disable changing the color of bars in accordance with the AO color (in the "AO bars" field), including changing the color for Fake bars (in the "Fake AO bars" field).
MFI is calculated using the formula: (high - low) / volume.
A Squat bar means that, compared to the previous bar, its MFI has decreased and at the same time its volume has increased, i.e. MFI < previous bar and volume > previous bar. A sign of a possible price reversal, so this is a particularly important signal.
A Fake bar is the opposite of a Squat bar and means that, compared to the previous bar, its MFI has increased and at the same time its volume has decreased, i.e. MFI > previous bar and volume < previous bar.
A "Green" bar means that, compared to the previous bar, its MFI has increased and at the same time its volume has increased, i.e. MFI > previous bar and volume > previous bar. A sign of trend continuation. But a more significant trend confirmation or warning of a possible reversal is the Awesome Oscillator, which measures market momentum by calculating the difference between the 5 Period and 34 Period Simple Moving Averages (SMA 5 - SMA 34) based on the midpoints of the bars (hl2). Therefore, by default, the "Green" bars and their opposite "Fade" bars are colored according to the color of the Awesome Oscillator.
According to Bill Williams' Profitunity strategy, using the Awesome Oscillator, the third Elliott wave is determined by the maximum peak of AO in the range from 100 to 140 bars. The presence of divergence between the maximum AO peak and the subsequent lower AO peak in this interval also warns of a possible correction, especially if the AO crosses the zero line between these AO peaks. Therefore, the chart additionally displays the prices of the highest and lowest bars, as well as the maximum or minimum peak of AO in the interval of 140 bars from the last bar. In the indicator settings, you can hide labels, lines, change the number of bars and any parameters for the AO indicator - method (SMA, Smoothed SMA, EMA and others), length, source (open, high, low, close, hl2 and others).
Bullish Divergent bar
🟢 A buy signal (Long) is a Bullish Divergent bar with a green circle displayed above it if such a bar simultaneously meets all of the following conditions:
The high of the bar is below all lines of the Alligator indicator.
The closing price of the bar is above its middle, i.e. close > (high + low) / 2.
The low of the bar is below the low of 2 previous bars or below the low of one previous bar, and the low of the second previous bar is a lower fractal (▼). By default, Divergent bars are not displayed, the low of which is lower than the low of only one previous bar and the low of the 2nd previous bar is not a lower fractal (▼), but you can enable the display of any Divergent bars in the indicator settings (by setting the value "no" in the " field Divergent Bars > Filtration").
The following conditions strengthen the Bullish Divergent bar signal:
The opening price of the bar, as well as the closing price, is higher than its middle, i.e. Open > (high + low) / 2.
The high of the bar is below all lines of the open Alligator indicator, i.e. the green line (Lips) is below the red line (Teeth) and the red line is below the blue line (Jaw). In this case, the color of the circle above the Bullish Divergent bar is dark green.
Squat Divergent bar.
The bar following the Bullish Divergent bar corresponds to the green color of the Awesome Oscillator.
Divergence on Awesome Oscillator.
Formation of the lower fractal (▼), in which the low of the Divergent bar is the peak of the fractal.
Bearish Divergent bar
🔴 A signal to sell (Short) is a Bearish Divergent bar under which a red circle is displayed if such a bar simultaneously meets all the following conditions:
The low of the bar is above all lines of the Alligator indicator.
The closing price of the bar is below its middle, i.e. close < (high + low) / 2.
The high of the bar is higher than the high of 2 previous bars or higher than the high of one previous bar, and the high of the second previous bar is an upper fractal (▲). By default, Divergent bars are not displayed, the high of which is higher than the high of only one previous bar and the high of the 2nd previous bar is not an upper fractal (▲), but you can enable the display of any Divergent bars in the indicator settings (by setting the value "no" in the " field Divergent Bars > Filtration").
The following conditions strengthen the Bearish Divergent bar signal:
The opening price of the bar, as well as the closing price, is below its middle, i.e. open < (high + low) / 2.
The low of the bar is above all lines of the open Alligator indicator, i.e. the green line (Lips) is above the red line (Teeth) and the red line is above the blue line (Jaw). In this case, the color of the circle under the Bearish Divergent bar is dark red.
Squat Divergent bar.
The bar following the Bearish Divergent bar corresponds to the red color of the Awesome Oscillator.
Divergence on Awesome Oscillator.
Formation of the upper fractal (▲), in which the high of the Divergent bar is the peak of the fractal.
Alligator lines crossing
Bars crossing the green line (Lips) of the open Alligator indicator is the first warning of a possible correction (price rollback) if one of the following conditions is met:
If the bar closed below the Lips line, which is above the Teeth line, and the Teeth line is above the Jaw line, while the closing price of the previous bar is above the Lips line.
If the bar closed above the Lips line, which is below the Teeth line, and the Teeth line is below the Jaw line, while the closing price of the previous bar is below the Lips line.
The intersection of all open Alligator lines by bars is a sign of a deep correction and a warning of a possible trend change.
Frequent intersection of Alligator lines with each other is a sign of a sideways trend (flat).
Signal Alerts
To receive notifications about signals when creating an alert, you must select the condition "Any alert() function is call", in which case notifications will arrive in the following format:
D — timeframe, for example: D, 4H, 15m.
🟢 BDB⎾ - a signal for a Bullish Divergent bar to buy (Long), triggers once after the bar closes and includes additional signals:
/// — if Alligator is open.
⏉ — if the opening price of the bar, as well as the closing price, is above its middle.
+ Squat 🔷 - Squat bar or + Green ↑ - "Green" bar or + Fake ↓ - Fake bar.
+ AO 🟩 - if after the Divergent bar closes, the oscillator color change for the next bar corresponds the green color of the Awesome Oscillator. ┴/┬ — AO above/below the zero line. ∇ — if there is divergence on AO in the interval of 140 bars from the last bar.
🔴 BDB⎿ - a signal for a Bearish Divergent bar to sell (Short), triggers once after the bar closes and includes additional signals:
/// — if Alligator is open.
⏊ — if the opening price of the bar, as well as the closing price, is below its middle.
+ Squat 🔷 - Squat bar or + Green ↑ - "Green" bar or + Fake ↓ - Fake bar.
+ AO 🟥 - if after the Divergent bar closes, the oscillator color change for the next bar corresponds to the red color of the Awesome Oscillator. ┴/┬ — AO above/below the zero line. ∇ — if there is divergence on AO in the interval of 140 bars from the last bar.
Alert for bars crossing the green line (Lips) of the open Alligator indicator (can be disabled in the indicator settings in the "Alligator > Enable crossing lips alerts" field):
🔴 Crossing Lips ↓ - if the bar closed below the Lips line, which is above than the other lines, while the closing price of the previous bar is above the Lips line.
🟢 Crossing Lips ↑ - if the bar closed above the Lips line, which is below the other lines, while the closing price of the previous bar is below the Lips line.
The fractal signal is triggered after the second bar closes, completing the formation of the fractal, if alerts about fractals are enabled in the indicator settings (the "Fractals > Enable alerts" field):
🟢 Fractal ▲ - upper (Bearish) fractal.
🔴 Fractal ▼ — lower (Bullish) fractal.
⚪️ Fractal ▲/▼ - both upper and lower fractal.
↳ (H=high - L=low) = difference.
If you redirect notifications to a webhook URL, for example, to a Telegram bot, then you need to set the notification template for the webhook in the indicator settings in the "Webhook > Message" field (contains a tooltip with an example), in which you just need to specify the text {{message}}, which will be automatically replaced with the alert text with a ticker and a link to TradingView.
‼️ A signal is not a call to action, but only a reason to analyze the chart to make a decision based on the rules of your strategy.
***
Индикатор включает в себя Williams Alligator, Williams Fractals, Дивергентные бары, Market Facilitation Index, самый высокий и самый низкий бары, максимальный и минимальный пик Awesome Oscillator, а также оповещения о сигналах на основе стратегии Profitunity Билла Вильямса.
MFI и Awesome Oscillator
В соответствии с осциллятором Market Facilitation Index Приседающий бар окрашен в синий цвет, все остальные бары окрашены в соответствии с цветом Awesome Oscillator, кроме Фальшивых баров, которые окрашены более светлым цветом AO. В настройках индикатора вы можете включить отображение "Зеленых" баров (в поле "Green Bars > Show"). В настройках стиля индикатора вы можете выключить изменение цвета баров в соответствии с цветом AO (в поле "AO bars"), в том числе изменить цвет для Фальшивых баров (в поле "Fake AO bars").
MFI рассчитывается по формуле: (high - low) / volume.
Приседающий бар означает, что по сравнению с предыдущим баром его MFI снизился и в тоже время вырос его объем, т.е. MFI < предыдущего бара и объем > предыдущего бара. Признак возможного разворота цены, поэтому это особенно важный сигнал.
Фальшивый бар является противоположностью Приседающему бару и означает, что по сравнению с предыдущим баром его MFI увеличился и в тоже время снизился его объем, т.е. MFI > предыдущего бара и объем < предыдущего бара.
"Зеленый" бар означает, что по сравнению с предыдущим баром его MFI увеличился и в тоже время вырос его объем, т.е. MFI > предыдущего бара и объем > предыдущего бара. Признак продолжения тренда. Но более значимым подтверждением тренда или предупреждением о возможном развороте является Awesome Oscillator, который измеряет движущую силу рынка путем вычисления разницы между 5 Периодной и 34 Периодной Простыми Скользящими Средними (SMA 5 - SMA 34) по средним точкам баров (hl2). Поэтому по умолчанию "Зеленые" бары и противоположные им "Увядающие" бары окрашены в соответствии с цветом Awesome Oscillator.
По стратегии Profitunity Билла Вильямса с помощью осциллятора Awesome Oscillator определяется третья волна Эллиота по максимальному пику AO в интервале от 100 до 140 баров. Наличие дивергенции между максимальным пиком AO и следующим за ним более низким пиком AO в этом интервале также предупреждает о возможной коррекции, особенно если AO переходит через нулевую линию между этими пиками AO. Поэтому на графике дополнительно отображаются цены самого высокого и самого низкого баров, а также максимальный или минимальный пик АО в интервале 140 баров от последнего бара. В настройках индикатора вы можете скрыть метки, линии, изменить количество баров и любые параметры для индикатора AO – метод (SMA, Smoothed SMA, EMA и другие), длину, источник (open, high, low, close, hl2 и другие).
Бычий Дивергентный бар
🟢 Сигналом на покупку (Long) является Бычий Дивергентный бар над которым отображается зеленый круг, если такой бар соответствует одновременно всем следующим условиям:
Максимум бара ниже всех линий индикатора Alligator.
Цена закрытия бара выше его середины, т.е. close > (high + low) / 2.
Минимум бара ниже минимума 2-х предыдущих баров или ниже минимума одного предыдущего бара, а минимум второго предыдущего бара является нижним фракталом (▼). По умолчанию не отображаются Дивергентные бары, минимум которых ниже минимума только одного предыдущего бара и минимум 2-го предыдущего бара не является нижним фракталом (▼), но вы можете включить отображение любых Дивергентных баров в настройках индикатора (установив значение "no" в поле "Divergent Bars > Filtration").
Усилением сигнала Бычьего Дивергентного бара являются следующие условия:
Цена открытия бара, как и цена закрытия, выше его середины, т.е. Open > (high + low) / 2.
Максимум бара ниже всех линий открытого индикатора Alligator, т.е. зеленая линия (Lips) ниже красной линии (Teeth) и красная линия ниже синей линии (Jaw). В этом случае цвет круга над Бычьим Дивергентным баром окрашен в темно-зеленый цвет.
Приседающий Дивергентный бар.
Бар, следующий за Бычьим Дивергентным баром, соответствует зеленому цвету Awesome Oscillator.
Дивергенция на Awesome Oscillator.
Образование нижнего фрактала (▼), у которого минимум Дивергентного бара является пиком фрактала.
Медвежий Дивергентный бар
🔴 Сигналом на продажу (Short) является Медвежий Дивергентный бар под которым отображается красный круг, если такой бар соответствует одновременно всем следующим условиям:
Минимум бара выше всех линий индикатора Alligator.
Цена закрытия бара ниже его середины, т.е. close < (high + low) / 2.
Максимум бара выше маскимума 2-х предыдущих баров или выше максимума одного предыдущего бара, а максимум второго предыдущего бара является верхним фракталом (▲). По умолчанию не отображаются Дивергентные бары, максимум которых выше максимума только одного предыдущего бара и максимум 2-го предыдущего бара не является верхним фракталом (▲), но вы можете включить отображение любых Дивергентных баров в настройках индикатора (установив значение "no" в поле "Divergent Bars > Filtration").
Усилением сигнала Медвежьего Дивергентного бара являются следующие условия:
Цена открытия бара, как и цена закрытия, ниже его середины, т.е. open < (high + low) / 2.
Минимум бара выше всех линий открытого индикатора Alligator, т.е. зеленая линия (Lips) выше красной линии (Teeth) и красная линия выше синей линии (Jaw). В этом случае цвет круга под Медвежьим Дивергентным Баром окрашен в темно-красный цвет.
Приседающий Дивергентный бар.
Бар, следующий за Медвежьим Дивергентным баром, соответствует красному цвету Awesome Oscillator.
Дивергенция на Awesome Oscillator.
Образование верхнего фрактала (▲), у которого максимум Дивергентного бара является пиком фрактала.
Пересечение линий Alligator
Пересечение барами зеленой линии (Lips) открытого индикатора Alligator является первым предупреждением о возможной коррекции (откате цены) при выполнении одного из следующих условий:
Если бар закрылся ниже линии Lips, которая выше линии Teeth, а линия Teeth выше линии Jaw, при этом цена закрытия предыдущего бара находится выше линии Lips.
Если бар закрылся выше линии Lips, которая ниже линии Teeth, а линия Teeth ниже линии Jaw, при этом цена закрытия предыдущего бара находится ниже линии Lips.
Пересечение барами всех линий открытого Alligator является признаком глубокой коррекции и предупреждением о возможной смене тренда.
Частое пересечение линий Alligator между собой является признаком бокового тренда (флэт).
Оповещения о сигналах
Для получения уведомлений о сигналах при создании оповещения необходимо выбрать условие "При любом вызове функции alert()", в таком случае уведомления будут приходить в следующем формате:
D — таймфрейм, например: D, 4H, 15m.
🟢 BDB⎾ — сигнал Бычьего Дивергентного бара на покупку (Long), срабатывает один раз после закрытия бара и включает дополнительные сигналы:
/// — если Alligator открыт.
⏉ — если цена открытия бара, как и цена закрытия, выше его середины.
+ Squat 🔷 — Приседающий бар или + Green ↑ — "Зеленый" бар или + Fake ↓ — Фальшивый бар.
+ AO 🟩 — если после закрытия Дивергентного бара, изменение цвета осциллятора для следующего бара соответствует зеленому цвету Awesome Oscillator. ┴/┬ — AO выше/ниже нулевой линии. ∇ — если есть дивергенция на AO в интервале 140 баров от последнего бара.
🔴 BDB⎿ — сигнал Медвежьего Дивергентного бара на продажу (Short), срабатывает один раз после закрытия бара и включает дополнительные сигналы:
/// — если Alligator открыт.
⏊ — если цена открытия бара, как и цена закрытия, ниже его середины.
+ Squat 🔷 — Приседающий бар или + Green ↑ — "Зеленый" бар или + Fake ↓ — Фальшивый бар.
+ AO 🟥 — если после закрытия Дивергентного бара, изменение цвета осциллятора для следующего бара соответствует красному цвету Awesome Oscillator. ┴/┬ — AO выше/ниже нулевой линии. ∇ — если есть дивергенция на AO в интервале 140 баров от последнего бара.
Сигнал пересечения барами зеленой линии (Lips) открытого индикатора Alligator (можно отключить в настройках индикатора в поле "Alligator > Enable crossing lips alerts"):
🔴 Crossing Lips ↓ — если бар закрылся ниже линии Lips, которая выше остальных линий, при этом цена закрытия предыдущего бара находится выше линии Lips.
🟢 Crossing Lips ↑ — если бар закрылся выше линии Lips, которая ниже остальных линий, при этом цена закрытия предыдущего бара находится ниже линии Lips.
Сигнал фрактала срабатывает после закрытия второго бара, завершающего формирование фрактала, если оповещения о фракталах включены в настройках индикатора (поле "Fractals > Enable alerts"):
🟢 Fractal ▲ — верхний (Медвежий) фрактал.
🔴 Fractal ▼ — нижний (Бычий) фрактал.
⚪️ Fractal ▲/▼ — одновременно верхний и нижний фрактал.
↳ (H=high - L=low) = разница.
Если вы перенаправляете оповещения на URL вебхука, например, в бота Telegram, то вам необходимо установить шаблон оповещения для вебхука в настройках индикатора в поле "Webhook > Message" (содержит подсказку с примером), в котором в качестве текста сообщения достаточно указать текст {{message}}, который будет автоматически заменен на текст оповещения с тикером и ссылкой на TradingView.
‼️ Сигнал — это не призыв к действию, а лишь повод проанализировать график для принятия решения на основе правил вашей стратегии.

MA + MACD alert TrendsThis is a strategy/combination of warning indicators using 6MA+MACD.
The strategy details are as follows: This is a simple warning strategy created so that we don't have to monitor the candlestick chart too often.
Note: This isn't an entry strategy; it's a signaling strategy for upcoming trends. For maximum efficiency, we should incorporate more formulas into the command. In the case below, I use Fibonacci to enter the command.
This strategy setting works for a 15-minute time frame, but it can still work for different time frames.
It has been working well with Gold and USOIL for the last two years, as well as with currency pairs like EURUSD and many others.
Components:
EMA100 + EMA200 + MA400 + MA800
MACD (timeframe greater than 1 timeframe)
Fibonacci retreat.
Uptrend alert:
Candles on both EMAs (100-200) + 2 SMAs (400-800)
In the previous 80 candles:
EMA100 cross up to EMA200
At the same time, the MACD cross up 0.
The uptrend warning will trigger when EMA6 cuts down to MA10. That's when the price creates the top and we'll wait for the market to go back to the Fibonacci threshold of 0.618 and start buying (or wait for markets to break up the trendline to buy).
Downtrend alert:
Candles are below both EMAs ( 100-200 ) + 2 SMAs ( 400-800 )
In the previous 80 candles:
EMA100 cross down to EMA200
At the same time, the MACD cross down zero.
The downtrend warning will trigger when EMA6 cuts to MA10. That's when the price creates a bottom and we'll wait for the market to go back to the Fibonacci threshold of 0.618 and start selling (or wait for the market to break down the trendline to sell).
Recommended RR: 1:1
If you have any questions please let me know!

Heatmap MACD Strategy - Pineconnector (Dynamic Alerts)Hello traders
This script is an upgrade of this template script.
Heatmap MACD Strategy
Pineconnector
Pineconnector is a trading bot software that forwards TradingView alerts to your Metatrader 4/5 for automating trading.
Many traders don't know how to dynamically create Pineconnector-compatible alerts using the data from their TradingView scripts.
Traders using trading bots want their alerts to reflect the stop-loss/take-profit/trailing-stop/stop-loss to breakeven options from your script and then create the orders accordingly.
This script showcases how to create Pineconnector alerts dynamically.
Pineconnector doesn't support alerts with multiple Take Profits.
As a workaround, for 2 TPs, I had to open two trades.
It's not optimal, as we end up paying more spreads for that extra trade - however, depending on your trading strategy, it may not be a big deal.
TradingView Alerts
1) You'll have to create one alert per asset X timeframe = 1 chart.
Example : 1 alert for EUR/USD on the 5 minutes chart, 1 alert for EUR/USD on the 15-minute chart (assuming you want your bot to trade the EUR/USD on the 5 and 15-minute timeframes)
2) For each alert, the alert message is pre-configured with the text below
{{strategy.order.alert_message}}
Please leave it as it is.
It's a TradingView native variable that will fetch the alert text messages built by the script.
3) Don't forget to set the webhook URL in the Notifications tab of the TradingView alerts UI.
EA configuration
The Pyramiding in the EA on Metatrader must be set to 2 if you want to trade with 2 TPs => as it's opening 2 trades.
If you only want 1 TP, set the EA Pyramiding to 1.
Regarding the other EA settings, please refer to the Pineconnector documentation on their website.
Logger
The Pineconnector commands are logged in the TradingView logger.
You'll find more information about it from this TradingView blog post
Important Notes
1) This multiple MACDs strategy doesn't matter much.
I could have selected any other indicator or concept for this script post.
I wanted to share an example of how you can quickly upgrade your strategy, making it compatible with Pineconnector.
2) The backtest results aren't relevant for this educational script publication.
I used realistic backtesting data but didn't look too much into optimizing the results, as this isn't the point of why I'm publishing this script.
3) This template is made to take 1 trade per direction at any given time.
Pyramiding is set to 1 on TradingView.
The strategy default settings are:
Initial Capital: 100000 USD
Position Size: 1 contract
Commission Percent: 0.075%
Slippage: 1 tick
No margin/leverage used
For example, those are realistic settings for trading CFD indices with low timeframes but not the best possible settings for all assets/timeframes.
Concept
The Heatmap MACD Strategy allows selecting one MACD in five different timeframes.
You'll get an exit signal whenever one of the 5 MACDs changes direction.
Then, the strategy re-enters whenever all the MACDs are in the same direction again.
It takes:
long trades when all the 5 MACD histograms are bullish
short trades when all the 5 MACD histograms are bearish
You can select the same timeframe multiple times if you don't need five timeframes.
For example, if you only need the 30min, the 1H, and 2H, you can set your timeframes as follow:
30m
30m
30m
1H
2H
Risk Management Features
All the features below are pips-based.
Stop-Loss
Trailing Stop-Loss
Stop-Loss to Breakeven after a certain amount of pips has been reached
Take Profit 1st level and closing X% of the trade
Take Profit 2nd level and close the remaining of the trade
Custom Exit
I added the option ON/OFF to close the opened trade whenever one of the MACD diverges with the others.
Help me help the community
If you see any issue when adding your strategy logic to that template regarding the orders fills on your Metatrader, please let me know in the comments.
I'll use your feedback to make this template more robust. :)
What's next?
I'll publish a more generic template built as a connector so you can connect any indicator to that Pineconnector template.
Then, I'll publish a template for Capitalise AI, ProfitView, AutoView, and Alertatron.
Thank you
Dave

RSI + Divergences + Alerts [MisterMoTA]The indicator RSI + Divergences + Alerts by MisterMoTA is an RSI indicator that fills the RSI and RSI moving average with 4 different colors (growing up, falling up, falling down and rising down colors), users can customize colors from dashboard , also can be disabled the fill if the user want a standard RSI.
The dafault value of RSI is 14 and value of the moving average is 50 ( a dynamic 50 rsi line is better for trend identification than a standard 50 line) and users can change the values from indicator settings.
For detecting the divergences displayed in the indicator, I integrated in our script the default Divergences indicator from Tradingview, users can display, hide and change colors for regular and hidden divergences.
RSI indicator display also trend conditions for RSI and RSI MA, the RSI MA angle is calculated using ATR value, the slope of the RSI Noving Average can help to identify trend conditions too.
The script comes with 12 different alerts, if need different alerts please let me know in the comments and will update the script with your request:
Alert for Regular Bullish Divergence
Alert for Regular Bearish Divergence
Alert for Hidden Bullish Divergence
Alert for Hidden Bearish Divergence
Alert for RSI Overbought
Alert for RSI Extreme Overbought
"Alert for RSI Oversold
Alert for RSI Extreme Oversold
Alert for RSI Crossing Above RSI MA
Alert for RSI Crossing Bellow RSI MA
Alert for RSI Crossing Above 50
Alert for RSI Crossing Bellow 50
Please follow me for other script like this one.
Kind regards,
MisterMoTA

Higher order Orderblocks + Breakerblocks + Range + AlertsThis script identifies Orderblocks, Breakerblocks and Range using higher order pivots and priceaction logic.
I tried to reduce the number of blocks to make the chart cleaner, for this purpose I use only second order pivots for both MSB lines and supply/demand boxes, I also tried to filter out shifts in MS and false breakouts.
Any box has GRAY color until it gets tested.
After successful test box gets colors:
RED for Supply
GREEN for Demand
BLUE for any Breakerblocks
For cleaner chart and script speed all broken boxes deletes from chart.
It gives comparatively clean chart on any TF, even on extra small (5m, 3m, 1m).
For Range there is option to plot 0.25, 0.5, 0.75 lines.
I usually use log scale on charts and there is an option to use it for proper range mean.
In previous my scripts i have requests to make alerts and this time i made it.
It has customizable alert catching all needed alerts into one output:
- Alert MSB - when market structure changes alert will inform you about its direction, MSB line and new Demand/Supply.
- Alert Orderblock or Breakerblock test - alerts when block was tested and it holds (in other words when it get RED/GREEN/BLUE colors)
- Alert New Range - when new range detected
- Alert Range test - alerts when range top or botoom was tested and it holds.
some examples :

Profit Percentage TrackerThis script provides a quick and easy way to visualize profits in a chart, based on the given entry date and price.
Optionally, alerts can be sent when profits cross up the given " profit unit ".
In short:
Tracks how much profit one could take based on the input " entry date " and the input " entry price "
These inputs are interactive (www.tradingview.com)
Displays the result in a label on top of the last candle
(Optional) Sends alerts based on the given " profit unit ", that is: if ' 0.5 ' is given, then an alert is triggered every time the profit is raised by that number
(Be careful with low values, as TradingView could stop an alert if it triggers too much.)
For alerts to be displayed, a " script alert " must be created right after the script was added to the chart:
- www.tradingview.com
(Choose ' Profits ' as condition and ' Any alert() function call ')
Good to know: if you check " Notify on app ", alerts can be delivered directly to your phone:
i.imgur.com
Prerequirements :
The chart's timezone has to be set to " Exchange " (this is required in order to support the alert's logic):
- kodify.net

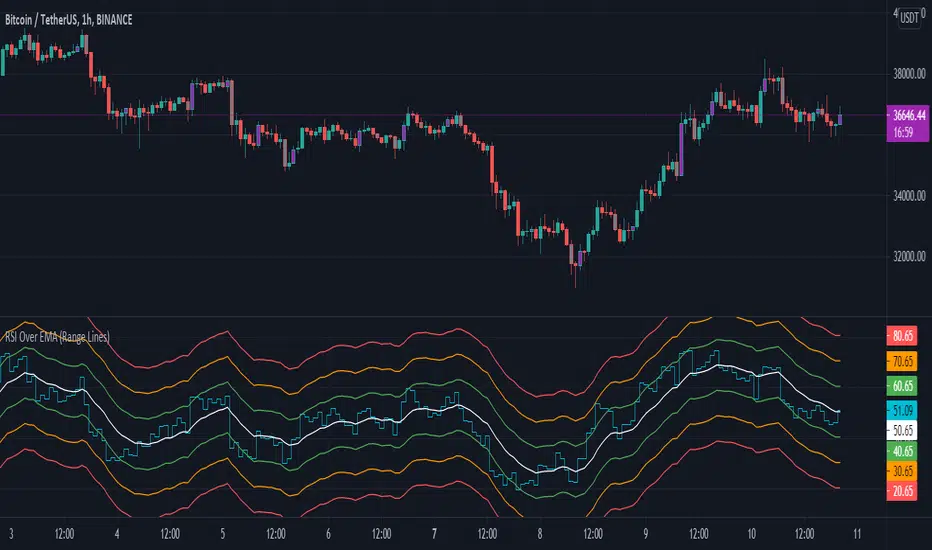
RSI Over EMA (Range Lines)This is another version of the RSI over EMA Trend Sniper script that I released here:
This one gives you better control across pairs wither higher volatility with the extra lines and more alert possibilities.
Here are the useful Alert functions within this indicator:
LONGS:
-Aqua line (RSI Line) - Crossing UP (Long Alert) on the Lower Green line
-Aqua line (RSI Line) - Crossing UP (Long Alert) on the Upper Green line
-Aqua line (RSI Line) - Crossing UP (Long Alert) on the Lower Amber line
-Aqua line (RSI Line) - Crossing UP (Long Alert) on the Upper Amber line
-Aqua line (RSI Line) - Crossing UP (Long Alert) on the Lower Red line
-Aqua line (RSI Line) - Crossing UP (Long Alert) on the Upper Red line
SHORTS:
-Aqua line (RSI Line) - Crossing DOWN (Short Alert) on the Lower Green line
-Aqua line (RSI Line) - Crossing DOWN (Short Alert) on the Upper Green line
-Aqua line (RSI Line) - Crossing DOWN (Short Alert) on the Lower Amber line
-Aqua line (RSI Line) - Crossing DOWN (Short Alert) on the Upper Amber line
-Aqua line (RSI Line) - Crossing DOWN (Short Alert) on the Lower Red line
-Aqua line (RSI Line) - Crossing DOWN (Short Alert) on the Upper Red line
You can setup alerts for the Aqua line (RSI Line) 'crossing up' (Long Alert) or 'crossing down' (Short Alert) on any of the colored EMA lines.
By default the lines are spread out at 10/20/30 and that should cover high volatility charts. But, this is customizable and you can reduce the size of Green/Amber/Red lines to try and get a better more focused setup for whichever coin you are trading on. I have found this version of the RSI over EMA to work better with alt coins that are generally more volatile, but using it on Bitcoin works too.
I am using this for Cryptocurrency alerts, but not for automation to enter or exit a trade. It's important to only use this on normal candles, and only use it as a confirmation of a possible good entry or exit.
ATR with Impulse AlertsThis is a very simple script which simply plots an ATR (the built-in ATR function, using RMA) and plots a cross when the previously closed bar is larger than the ATR by a given threshold. There are also alert conditions set so you can be alerted when these impulse bars show up, either up or down bars. Have fun and safe trading!

Hancock - Filtered Volume OBV OSC [Alerts]This is an alert version of the strategy found here
This doesn't have the trailing stop or stop loss risk management included, i'll work on a release that has risk management included as best i can with alerts. Make sure to set a stop loss with your alert command.
Happy trading
Hancock

Price alertThis indicator is an indicator for setting alerts.
Set alerts after adding them to the chart.
By setting an alert, you can notify the closing price to your smartphone or smartwatch.

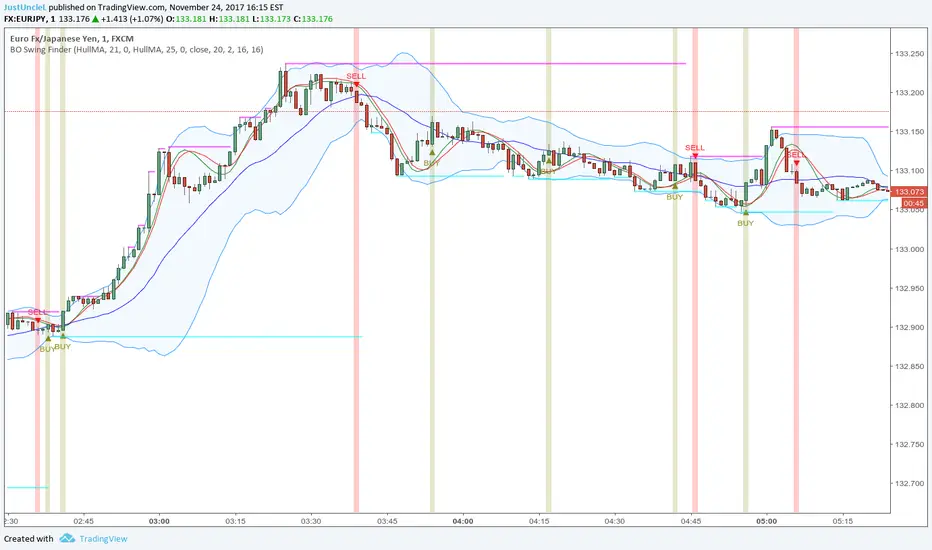
BO Swing Finder R0.6 by JustUncleLThis indicator alert study attempts to detect confirmed Swing points. It uses Bollinger Band centre line crosses as the main signal. The main detection occurs by looking for the first BB centre line cross that was initiated from outside the Bollinger Channel (alternatively KC channel can be used).
The optional HullMA (any any other MA pair) are used to confirm the swing direction. The indicator also plots the two KitKat Support and Resistance lines with optional High/Low labelling on KitKat1 lines.
This indicator tool is suitable for any time frame and can be traded with Binary Option (even 1min) orders (2-3 candle expiry) or as Forex trade orders. It is suitable for Currencies, Cryptocurrencies and Metals. May also be useful on other markets as well.
The MA filtering options, each MA line can be a different type, with an optional offset:
SMA = Simple Moving Average.
EMA = Exponential Moving Average.
WMA = Weighted Moving Average
VWMA = Volume Weighted Moving Average
SMMA = Smoothed Simple Moving Average.
DEMA = Double Exponential Moving Average
TEMA = Triple Exponential Moving Average.
HullMA = Hull Moving Average, fast moving MA.
SSMA = Ehlers Super Smoother Moving average, similar results to HullMA.
ZEMA = Near Zero Lag Exponential Moving Average.
TMA = Triangular (smoothed) Simple Moving Average.
NOTE: The signal calculations do occur on the current candle, so the state of the signal may re-build until the current candle is closed. I have designed the script to behave this way on purpose. This gives traders the option of
preparing their trade early or even taking the trade early if they want. Otherwise the trader can be more conservative and wait for signal candle to close, to give them a confirmed signal. (This is NOT re-painting as the historical signal states are fixed and will not change, unless you change some setup options.)
Hints:
1) As with all indicator and alerting tools, not all signals will yield a tradable successful swing. You need to apply you own analysis on each signal to determine the probability of success.
2) When using the MA to filter the signals you should use it for two types of filtering:
Supportive that confirm swing like fast moving MAs with fairly short lengths, eg HullMA(21,25).
Long Term Direction with smoother longer length MAs like SMMA(180,220) to show up swings back into direction of the longer term trends.
Inspiration: @Lyiness
References:
Momentum VMA KITKAT CROSS v2.1 by vdubus (- Vdubus_Channel www.vdubus.co.uk)
Patterns and AlertsPatterns and Alerts — TradingView Indicator Documentation
© 2026 Arup Sarkar
Indicator Name: Patterns and Alerts
Version: 1.0
About Me:
Spent 32+ years in the software industry and now a full time trader. I did not find an indicator that keeps the chart clean, addresses candle and chart patters combined and provide alerts. This is my first release and by Feb end, I will include all chart/candle patterns, trend line & most vital, Smart Money intent behind patterns (candle and chart).
Description
The Indicator: Patterns and Alerts is a comprehensive indicator that detects candlestick and classical chart patterns, provides real-time alerts, and keeps charts clean with minimalist visuals. It helps traders identify actionable price patterns across all timeframes and asset classes.
Key Features
- Detects Bullish/Bearish Pin Bars
- Detects Double Top, Head & Shoulders, Rising Wedges, and Falling Wedges
- Generates alerts once per confirmed pattern
- Uses thin lines and optional pivot labels for clean visuals
- Works on all timeframes (1-minute to Daily)
Alerts
- Pattern type
- Pivot prices (if applicable)
- Symbol
- Timeframe
Pro Tips
- For aggressive detection, decrease Pivot Length & Pin Bar Wick Ratio
- For conservative detection, increase Pivot Length & Pin Bar Wick Ratio
- Disable labels on lower timeframes to reduce clutter
- Combine alerts with trend indicators, volume, or higher timeframe analysis for confirmation
- Can integrate alerts via webhooks for automated trading
Author / Credit
Arup Sarkar

The Strat: 3-2D Setup Label + Entry, Target & AlertsThis is an indicator that identifies the 3-2D setup based on TheStrat & will alert you if you have this on the chart. Once the 3-2D setup happens this will give you the entry, target and price labels. You can change the font size, label colors and add optional alerts.
