RSI-Adaptive T3 & SAR Strategy [PrimeAutomation]⯁ OVERVIEW
The RSI-Adaptive T3 and SAR Confluence Strategy combines adaptive smoothing with dynamic trend confirmation to identify precise trend reversals and continuation opportunities. It fuses the power of an RSI-based adaptive T3 moving average with the Parabolic SAR filter , aiming to trade in harmony with dominant momentum shifts while maintaining tight control through automatic stop-loss placement.
The RSI-Adaptive T3 is a precision trend-following tool built around the legendary T3 smoothing algorithm developed by Tim Tillson, designed to enhance responsiveness while reducing lag compared to traditional moving averages. Current implementation takes it a step further by dynamically adapting the smoothing length based on real-time RSI conditions — allowing the T3 to “breathe” with market volatility. This dynamic length makes the curve faster in trending moves and smoother during consolidations.
To help traders visualize volatility and directional momentum, adaptive volatility bands are plotted around the T3 line, with visual crossover markers and a dynamic info panel on the chart. It’s ideal for identifying trend shifts, spotting momentum surges, and adapting strategy execution to the pace of the market.
⯁ LOGIC
The T3 moving average length dynamically adjusts based on RSI values — when RSI is high, the smoothing period shortens to react faster; when RSI is low, the period increases for stability in slow markets.
A Parabolic SAR filter confirms directional bias, ensuring trades only occur in alignment with the broader market trend.
Long Entries: Trigger when the T3 curve crosses upward while the current price remains above the SAR — signaling bullish momentum alignment.
Short Entries: Trigger when the T3 crosses downward while the price remains below the SAR — confirming bearish trend alignment.
Stops: Dynamic stops are placed using the highest or lowest price over a set lookback period, adapting automatically to market volatility.
⯁ FEATURES
RSI-Adaptive T3 Filter: Adjusts smoothing in real time to market conditions, blending responsiveness with noise reduction.
SAR Confluence Check: Prevents counter-trend entries by confirming momentum direction via the Parabolic SAR.
Automatic Stop Placement: Uses recent highs or lows as stop-loss anchors, minimizing risk exposure.
Color-coded Visualization: The T3 line dynamically changes color based on slope direction, making momentum shifts visually intuitive.
Smoothed Trend Structure: Reduces market noise, allowing cleaner, more reliable trend recognition across different assets.
⯁ CONCLUSION
The RSI-Adaptive T3 and SAR Confluence Strategy delivers an advanced fusion of adaptive smoothing and structural confirmation. By combining RSI-driven reactivity with Parabolic SAR trend validation, this strategy offers a balanced approach to identifying sustainable momentum reversals while maintaining strong risk management through automatic stop levels. Ideal for traders who seek precision entries aligned with adaptive trend dynamics.
Cerca negli script per "algo"

黃金5KCompelling Sales Description:
Unlock the Treasure of Consistent Profits!
Want to know where the market's hidden opportunities lie?
Go find them—with our powerful RSI + BB + Channel Automated Trading Strategy!
Tired of guessing when to enter or exit trades? Let our advanced algorithm do the heavy lifting for you. This strategy seamlessly combines:
RSI (Relative Strength Index) to identify overbought or oversold conditions.
Bollinger Bands (BB) to track volatility and pinpoint potential breakouts.
Channel Trading to capitalize on trending markets and price boundaries.
Fully automated, this system executes trades with precision, eliminating emotional decisions and saving you time. Whether you're a beginner or an experienced trader, this strategy adapts to market shifts to help you stay ahead.
Don't just chase profits—unlock the treasure of disciplined, data-driven trading.
Ready to transform your trading journey?
Contact us for details at: kbocc123@gmail.com
Seize the strategy. Secure your success. 🚀
ILM & IFVG StrategyPlease feel free to adjust in any way possible. Let me know if you can create something better from this initial coding.
//═══════════════════════════════════════════════════════════════════════
// Inverted Liquidity Model (ILM) – Strategy
//═══════════════════════════════════════════════════════════════════════
//
// The **Inverted Liquidity Model (ILM)** is a liquidity-based algorithm
// built to capture high-probability reversals after:
//
// • A liquidity sweep (SSL/BSL taken)
// • Rejection back inside the range
// • A Fair Value Gap (FVG) forms
// • That FVG becomes invalidated → becomes an IFVG entry zone
//
// ILM combines:
// • LTF BOS / CHOCH structure confirmation
// • HTF structure (expansion) filtering
// • Premium / Discount filter (17:00 CST session midline)
// • Optional ATR volatility filter
// • Optional trading session restrictions
// • Optional partial profit-taking + runners
//
// When all conditions align, the strategy enters:
// ✔ Long after sweep of SSL + valid long IFVG + trend confirmation
// ✔ Short after sweep of BSL + valid short IFVG + trend confirmation
//
// Stops are placed at the sweep wick.
// Full target is set at the next structural high/low.
// Optional partial TP sends a runner to full target.
//
// Visual tools (labels, sweep lines, IFVG boxes, midline) assist
// with review and forward testing.
//
//───────────────────────────────────────────────────────────────────────
// USER CONFIGURABLE FEATURES
//───────────────────────────────────────────────────────────────────────
//
// • **Liquidity & Structure**
// - pivotLen → swing length for pivots / liquidity
// - htfOn → toggle higher-timeframe pivots
// - htfTF → timeframe for HTF structure/liquidity
// - useStructureFilter → enforce LTF BOS/CHOCH trend
// - useHtfExpansionFilter → enforce HTF trend
// - showStructureLabels → show BOS/CHOCH labels
// - showHtfStructureLabels → show HTF BOS/CHOCH labels
//
// • **Premium / Discount Midline**
// - usePremiumDiscountFilter → only long in discount / short in premium
// - pdSession → session used for midline (default 17:00 CST)
// - showPdMidLine → show 50% midline
//
// • **FVG / IFVG Detection**
// - useBodyGapFVG → FVG uses candle bodies instead of wicks
// - useDisplacementFVG → require displacement bar
// - dispAtrMult → minimum ATR threshold for displacement
// - showIFVG → draw IFVG boxes
//
// • **ATR / Volatility / Sessions**
// - useRangeFilter → require minimum ATR%
// - atrLen → ATR period
// - minAtrPerc → minimum ATR% of price
// - useSessionFilter → restrict trading hours
// - sessionTimes → allowed trading session
//
// • **Sweep Visualization**
// - showSweepLines → draw sweep lines at SSL/BSL sweeps
// - sweepLineWidth → thickness of sweep lines
//
// • **Exits: Partial Targets & Runners**
// - usePartialTargets → enable partial TP logic
// - tp1QtyPercent → percent closed at TP1
// - tp1FractionOfPath → TP1 relative to path to full target
//
// • **Formatting / Visibility**
// - labelFontSizeInput → tiny / small / normal / large / huge
// - showEntries → entry markers
// - showTargets → target lines
//
//═══════════════════════════════════════════════════════════════════════
// END OF STRATEGY DESCRIPTION
//═══════════════════════════════════════════════════════════════════════

Intellect TBTS V02 [Strategy]📌 Intellect V01 TBO – Trend Breakout Options Strategy
Intellect V01 TBO is an intraday trend-breakout strategy designed for index traders who follow Nifty, BankNifty, and FinNifty.
It identifies trend shifts using structural pivots, adaptive trendlines, and volatility-adjusted breakout zones.
The strategy provides automatic Long/Short signals, optional stop-loss and target projections, and allows users to generate alert messages that include index-option strike information.
🔍 How the Strategy Works
1. Pivot-Based Structure
The script identifies short-term high and low pivots using a user-defined period.
These pivots become anchor points for constructing directional trendlines.
2. Dynamic Trendline Projection
For each pivot, the script builds:
A projected trendline
Two offset lines above/below
A volatility band based on ATR
These help detect potential breakout zones.
3. Breakout Signal Logic
A trade signal is generated when price crosses the projected trendline:
Long Signal – detected when price breaks above a pivot-derived trendline.
Short Signal – detected when price breaks below a pivot-derived trendline.
Users may optionally restrict entries to a specific time window.
🎯 Stop-Loss & Target Zones
When a trade is active:
SL and TP levels are set using ATR-based volatility distance
Levels appear visually on the chart if enabled
Exits occur automatically when TP/SL is hit
The strategy also closes open trades near the end of the session (default 3:10 PM)
These levels are for visual and backtesting support only.
📝 Index Option Strike Calculation (For Alert Text Only)
The strategy can dynamically compute:
ATM strike (with optional bias)
Correct expiry day for Nifty (weekly) and BankNifty/FinNifty (monthly Tuesday)
CE strike for Long signals
PE strike for Short signals
This strike information is only included in alert text for users who configure external automation.
It does not affect backtesting results inside TradingView.
⏱️ Time Window Filter (Optional)
Users may define:
Start time
End time
Outside this window, no new trades are generated.
🎛️ User Adjustable Inputs
Pivot lookback period
Trendline style and extension
Display of target/stop-loss
Expiry selection mode
Strike-bias
Lot size (for alert formatting only)
Time filter settings
🔔 Alert Messages
Alerts include:
Direction (Long/Short)
Strike details
Option type (CE/PE)
Quantity
A formatted JSON message
TradingView does not execute these orders.
Users are responsible for managing external automation independently.
⚠️ Important Notes
This script does not integrate with any broker by default.
It does not place trades automatically; alerts only send text.
Backtests simulate index movement, not live option pricing.
We recommend using realistic slippage and commission settings.
✔️ This strategy is intended for educational and analytical use. Adjust settings as needed.
✅ 2. CLEAN CHART BEFORE PUBLISHING
To avoid moderator flags:
Do This Before Publishing:
✔ Remove all manual drawings
✔ Hide any other indicators on the chart
✔ Use light or clean background
✔ Keep only signals/SL/TP from your script
If you leave extra drawings, moderators may hide the script again.
✅ 3. FINAL PUBLISHING CHECKLIST
Before you click Publish, verify:
✔ Description matches the one above
✔ No broker names anywhere
✔ No "algo trading" or "automation" advertising
✔ Backtest settings are realistic
Commission enabled
Slippage > 1
Reasonable lot assumption
✔ Chart is clean
✔ Script is set to “Strategy” and compiles without warnings

ETH SuperTrend Hull Strategy - 15min Futures(重制版)🟠 ETH SuperTrend Hull Strategy - 15min Futures
Strategy Overview
The "ETH SuperTrend Hull Strategy" is a sophisticated 15-minute trading system specifically designed for Bitcoin perpetual contracts. This advanced algorithm integrates SuperTrend indicators with Hull moving averages to deliver high-precision trend following through a triple-confirmation mechanism, featuring intelligent position management and multi-level take-profit systems.
Core Value Proposition
Triple Trend Confirmation: SuperTrend + Hull MA + ATR volatility filtering
Adaptive Take-Profit System: 6-level dynamic profit targets adjusted to market conditions
Smart Position Management: Three martingale modes with automatic sizing
Real-time Webhook Integration: Direct exchange connectivity for automated execution
🟠 Technical Framework
Multi-Layer Trend Detection
Layer 1 - SuperTrend Filter
pinescript
= ta.supertrend(supertrend_factor, supertrend_atr_period)
is_supertrend_long = direction < 0 // Bullish trend line
is_supertrend_short = direction >= 0 // Bearish trend line
Layer 2 - Hull MA Confirmation
pinescript
HMA = HMA(close, 73) // Hull Moving Average
hull_is_green = HULL > HULL // Uptrend confirmation
hull_is_red = HULL <= HULL // Downtrend confirmation
Layer 3 - ATR Breakout Signals
pinescript
xATR = ta.atr(5)
nLoss = key_value * xATR // Dynamic stop distance
Entry Conditions
Long Entry:
Price breaks above ATR trailing stop
Hull MA shows green uptrend
SuperTrend indicates bullish momentum
Price positioned above Hull MA
Short Entry:
Price breaks below ATR trailing stop
Hull MA shows red downtrend
SuperTrend indicates bearish momentum
Price positioned below Hull MA
🟠 Risk Management System
Position Sizing
text
Base Position = Initial Capital × Risk % / Entry Price × Leverage
Actual Position = Base Position × Martingale Multiplier (1.0-5.0x)
Martingale Modes
4x Mode: Conservative approach, maximum 4x position scaling
5x Mode: Balanced risk management, maximum 5x scaling
5x Big Mode: Aggressive growth with faster position increases
Dynamic Take-Profit System
6-Level Profit Targets:
TP1: 2.2×ATR (Close 30%)
TP2: 4.5×ATR (Close 25%)
TP3: 7.5×ATR (Close 20%)
TP4: 10.5×ATR (Close 10%)
TP5: 15.5×ATR (Close 7%)
TP6: 20.5×ATR (Close 3%)
ATR Adaptive Adjustment:
Short-term ATR > Long-term ATR: TP distance +0.5
Short-term ATR < Long-term ATR: TP distance -0.5
🟠 Configuration Parameters
Core Settings
pinescript
// Trend Sensitivity
key_value = 2.0 // ATR multiplier (lower = more sensitive)
supertrend_factor = 3.0 // SuperTrend factor
// Risk Management
risk_percent = 19.9 // Per trade risk %
leverage = 1.0 // Leverage multiplier
Hull MA Configuration
pinescript
length = 73 // Hull period (55-200)
modeSwitch = "Hma" // Hull variant (Hma/Thma/Ehma)
🟠 Quick Start Guide
Initial Setup
Apply to BTCUSDT perpetual 15-minute chart
Configure Webhook Signal ID and User ID
Adjust position parameters according to risk preference
Signal Monitoring
Long Signals: Green arrows with Hull MA turning green
Short Signals: Red arrows with Hull MA turning red
Trend Direction: SuperTrend line color changes
Execution Workflow
Wait for triple-signal confluence
Confirm all entry conditions met
System automatically calculates position size and TP levels
Webhook sends trade instructions to connected platform
Advanced Features
Heikin-Ashi Mode: Smooth price data using Heikin-Ashi candles
Fixed Position Mode: Disable martingale, use fixed sizing
Multi-Timeframe: Higher timeframe confirmation integration
🟠 ETH SuperTrend Hull Strategy - 15min Futures
策略概述
"ETH超级趋势Hull策略"是一款专为比特币永续合约设计的15分钟短线交易系统。该策略融合超级趋势指标与Hull均线,通过三重过滤机制实现高精度趋势跟踪,具备智能仓位管理和多级止盈体系。
核心价值
三重趋势确认:Supertrend + Hull均线 + ATR波动过滤
自适应止盈系统:6级动态止盈,根据市场波动调整目标
智能仓位管理:支持三种倍投模式,自动调整仓位规模
实时Webhook通知:直连交易平台,实现自动化执行
🟠 策略原理
趋势识别系统
第一层 - 超级趋势过滤
pinescript
= ta.supertrend(supertrend_factor, supertrend_atr_period)
is_supertrend_long = direction < 0 // 绿色趋势线
is_supertrend_short = direction >= 0 // 红色趋势线
第二层 - Hull均线确认
pinescript
HMA = HMA(close, 73) // Hull移动平均线
hull_is_green = HULL > HULL // 上升趋势
hull_is_red = HULL <= HULL // 下降趋势
第三层 - ATR突破信号
pinescript
xATR = ta.atr(5)
nLoss = key_value * xATR // 动态止损距离
入场条件
多头入场:
价格突破ATR追踪止损
Hull均线呈绿色上升趋势
超级趋势显示看涨信号
价格位于Hull均线上方
空头入场:
价格跌破ATR追踪止损
Hull均线呈红色下降趋势
超级趋势显示看跌信号
价格位于Hull均线下方
🟠 风险管理
仓位计算
text
基础仓位 = 初始资金 × 风险比例% / 入场价格 × 杠杆倍数
实际仓位 = 基础仓位 × 倍投系数 (1.0-5.0倍)
倍投模式
4倍模式:保守型,最大4倍加仓
5倍模式:均衡型,最大5倍加仓
5倍大模式:激进型,更快仓位增长
动态止盈系统
6级止盈目标:
TP1: 2.2×ATR (平仓30%)
TP2: 4.5×ATR (平仓25%)
TP3: 7.5×ATR (平仓20%)
TP4: 10.5×ATR (平仓10%)
TP5: 15.5×ATR (平仓7%)
TP6: 20.5×ATR (平仓3%)
ATR自适应调整:
短期ATR > 长期ATR:止盈距离+0.5
短期ATR < 长期ATR:止盈距离-0.5
🟠 参数配置
核心参数
pinescript
// 趋势敏感度
key_value = 2.0 // ATR乘数,值越小越敏感
supertrend_factor = 3.0 // 超级趋势因子
// 风险管理
risk_percent = 19.9 // 单次交易风险%
leverage = 1.0 // 杠杆倍数
Hull均线设置
pinescript
length = 73 // Hull周期 (55-200)
modeSwitch = "Hma" // Hull变体 (Hma/Thma/Ehma)
🟠 使用指南
初始设置
添加到BTCUSDT永续合约15分钟图表
配置Webhook信号ID和用户ID
根据风险偏好调整仓位参数
信号监控
多单信号:绿色箭头,Hull均线转绿
空单信号:红色箭头,Hull均线转红
趋势方向:超级趋势线颜色变化
执行流程
等待三重信号共振
确认入场条件满足
系统自动计算仓位和止盈
通过Webhook发送交易指令
高级功能
K线均线模式:使用Heikin-Ashi平滑价格
固定仓位模式:禁用倍投,固定仓位大小
多时间框架:集成更高时间框架确认

Moving Average Band StrategyOverview
The Moving Average Band Strategy is a fully customizable breakout and trend-continuation system designed for traders who need both simplicity and control.
The strategy creates adaptive bands around a user-selected moving average and executes trades when price breaks out of these bands, with advanced risk-management settings including optional Risk:Reward targets.
This script is suitable for intraday, swing, and positional traders across all markets — equities, futures, crypto, and forex.
Key Features
✔ Six Moving Average Types
Choose the MA that best matches your trading style:
SMA
EMA
WMA
HMA
VWMA
RMA
✔ Dynamic Bands
Upper Band built from MA of highs
Lower Band built from MA of lows
Adjustable band offset (%)
Color-coded band fill indicating price position
✔ Configurable Strategy Preferences
Toggle Long and/or Short trades
Toggle Risk:Reward Take-Profit
Adjustable Risk:Reward Ratio
Default position sizing: % of equity (configurable via strategy settings)
Entry Conditions
Long Entry
A long trade triggers when:
Price crosses above the Upper Band
Long trades are enabled
No existing long position is active
Short Entry
A short trade triggers when:
Price crosses below the Lower Band
Short trades are enabled
No existing short position is active
Clear entry markers and price labels appear on the chart.
Risk Management
This strategy includes a complete set of risk-controls:
Stop-Loss (Fixed at Entry)
Long SL: Lower Band
Short SL: Upper Band
These levels remain constant for the entire trade.
Optional Risk:Reward Take-Profit
Enabled/disabled using a toggle switch.
When enabled:
Long TP = Entry + (Risk × Risk:Reward Ratio)
Short TP = Entry – (Risk × Risk:Reward Ratio)
When disabled:
Exits are handled by reverse crossover signals.
Exit Conditions
Long Exit
Stop-Loss Hit (touch-based)
Take-Profit Hit (if enabled)
Reverse Band Crossover (if TP disabled)
Short Exit
Stop-Loss Hit (touch-based)
Take-Profit Hit (if enabled)
Reverse Band Crossover (if TP disabled)
Exit markers and price labels are plotted automatically.
Visual Tools
To improve clarity:
Upper & Lower Band (blue, adjustable width)
Middle Line
Dynamic band fill (green/red/yellow)
SL & TP line plotting when in position
Entry/Exit markers
Price labels for all executed trades
These are built to help users visually follow the strategy logic.
Alerts Included
Every trading event is covered:
Long Entry
Short Entry
Long SL / TP / Cross Exit
Short SL / TP / Cross Exit
Combined Alert for webhook/automation (JSON-formatted)
Perfect for algo trading, Discord bots, or automation platforms.
Best For
This strategy performs best in:
Trending markets
Breakout environments
High-momentum instruments
Clean intraday swings
Works seamlessly on:
Stocks
Index futures
Commodities
Crypto
Forex
⚠️ Important Disclaimer
This script is for educational purposes only.
Trading involves risk. Backtest results are not indicative of future performance.
Always validate settings and use proper position sizing.

Sunflower Quant - ETH 15min Strategy🟠 Sunflower Quant - ETH 15min Strategy
Strategy Overview
The " Sunflower Quant - ETH 15min Strategy" is a sophisticated automated trading system specifically designed for ETH/USDT on 15-minute timeframes. This advanced algorithm integrates over 20 technical indicators and price action patterns to deliver intelligent entry decisions and comprehensive risk management.
Core Value Proposition
Multi-Timeframe Integration: Combines 1-hour and 4-hour higher timeframe data for signal validation
Dynamic Market Regime Detection: Real-time identification of Low Volatility, Ranging, and High Volatility market environments
Comprehensive Scoring System: Three-dimensional evaluation model based on Breakout Signals, Pattern Recognition, and Position Analysis
Adaptive Position Sizing: Dynamic allocation based on signal strength and market volatility
🟠 Core Architecture
Three-Layer Analytical Framework
1. Market Regime Detection System
Real-time market environment assessment through four dimensions:
ATR Relative Volatility
Bollinger Band Width
Average Amplitude
Momentum Strength
Market State Classification:
Low Volatility (≤30 points): Narrow ranges, awaiting breakout
Ranging Market (31-65 points): Moderate volatility, suitable for range trading
High Volatility (>65 points): Strong trends, ideal for trend following
2. Signal Generation Engine
Breakout Signal Layer:
Donchian Channel Breakouts (Upper/Middle/Lower)
Keltner Channel Breakouts (Upper/Middle/Lower)
Double ATR Momentum Confirmation
Pattern Recognition Layer:
Price Action: Outside Bars, Engulfing Patterns, False Breakouts
Candlestick Patterns: Hammer, Inverted Hammer, Doji, Dragonfly, Gravestone
Three Soldiers Method: Single-bar and Three-bar consecutive patterns
Position Analysis Layer:
Ichimoku Cloud Position (Above/Within/Below)
ADX Trend Strength Confirmation
DC/KC Middle Band Position Analysis
3. Volume & POC Analysis
Volume Confirmation:
High Volume Breakout Validation
Medium Volume Support Confirmation
Point of Control (POC) Value Areas:
Volume-based dense trading zone identification
POC Cluster Scoring System (Size Score + Volume Score + Time Score)
🟠 Trading Logic Specification
Entry Signal Classification
A-Class Signals (Strong Breakout)
Trigger: VP breaking key POC levels + strong pattern confirmation
Characteristics: High confidence, larger position sizing
Stop Loss: Wider stops based on historical ATR volatility
B-Class Signals (Pattern Confirmed)
Trigger: Clear price patterns + volume confirmation
Characteristics: Medium confidence, standard position sizing
Stop Loss: Based on pattern lows/highs
C-Class Signals (Weak Reversal)
Trigger: Single indicator signals + positional support
Characteristics: Lower confidence, small exploratory positions
Stop Loss: Tight stops for quick exits
Scoring Weight Distribution
text
Base Score = Breakout(30%) + Patterns(40%) + Position(30%)
Final Score = Base Score × Market Regime Coefficient × Cloud Position Coefficient
🟠 Risk Management System
Dynamic Stop Loss Strategy
Initial Stop Loss: ATR-based volatility + market regime adjustment
Trailing Stop: Phased tracking, progressively locking profits
Position Management
text
Base Position = Initial Capital × Base Coefficient / Stop Distance
Final Position = Base Position × Signal Strength Coefficient × Market Volatility Coefficient
Take Profit System
Scaled Profit Taking: 8 profit levels with proportional position distribution
Dynamic Adjustment: Trailing stop activation upon reaching specific profit tiers
🟠 Configuration Parameters
Market Regime Thresholds
pinescript
Low Volatility: ≤30 points
Ranging Market: 31-65 points
High Volatility: >65 points
Signal Strength Thresholds
pinescript
// Current Entry Thresholds (No Position)
Low Volatility: Long 82 / Short 82
Ranging: Long 75 / Short 80
High Volatility: Long 80 / Short 85
// Reversal Entry Thresholds
Low Volatility: Long 75 / Short 90
Ranging: Long 85 / Short 90
High Volatility: Long 90 / Short 100
🟠 Usage Guide
1. Initial Setup
Apply to ETH/USDT 15-minute chart
Configure webhook Signal ID and UID
Adjust initial capital parameters according to account size
2. Key Monitoring Elements
Market Regime Indicator: Watch background color changes
Signal Score Display: Monitor real-time long/short scores
POC Value Areas: Identify key support/resistance levels
3. Trading Decision Process
Trend Confirmation Phase:
text
1. Observe market regime background
2. Confirm Ichimoku cloud position
3. Check ADX trend strength
Entry Signal Screening:
text
1. Comprehensive score > corresponding threshold
2. Multiple indicator signal confluence
3. Volume confirmation alignment
Risk Management Execution:
text
1. Automatic position size calculation
2. Set scaled take profit and stop loss
3. Monitor trailing stop updates
4. Advanced Features
Lookback Mode: Historical signal validation
Special Close: Early exit based on ATR ratio
Signal Filtering: Optimize signal quality through component weight adjustment
This systematic multi-factor scoring strategy delivers stable automated trading decisions in complex market environments, particularly well-suited for the short-term volatility characteristics of cryptocurrencies like Ethereum.
Strategy Name: Sunflower Quantitative Strategy
Symbol: ETH/USDT
Timeframe: 15-minute
Market: Cryptocurrency
Strategy Type: Multi-timeframe Quantitative Analysis
Risk Level: Medium-High
Recommended Capital: $10,000+ for optimal position sizing
"向日葵量化"是一款专为ETH 15分钟图表设计的全自动量化交易策略。该策略通过多维度技术分析框架,集成超过20种技术指标与价格行为模式,实现智能化的入场决策与风险控制。
核心价值
多时间框架协同:整合1小时、4小时高周期数据,确保信号质量
动态市场状态识别:实时识别低波动、震荡、高波动三种市场环境
综合评分系统:基于突破信号、形态识别、位置分析的三维评分模型
智能仓位管理:根据信号强度与市场波动率动态调整仓位规模
🟠【核心架构】
策略基于三层分析框架构建:
1. 市场状态识别系统
通过ATR相对波动率、布林带宽、平均振幅、动量强度四个维度,实时判断当前市场环境:
低波动市场(≤30分):窄幅震荡,等待突破
震荡市场(31-65分):中等波动,适合区间交易
高波动市场(>65分):趋势明确,适合趋势跟踪
2. 信号生成引擎
突破信号层:
DC通道突破(上轨/中轨/下轨)
KC通道突破(上轨/中轨/下轨)
双ATR动量确认
形态识别层:
价格行为模式:外包线、吞没形态、假突破
K线形态:锤子线、倒锤子线、十字星、蜻蜓线、墓碑线
三兵三法:单根强度与三根连续形态
位置分析层:
云图位置关系(之上/之中/之下)
ADX趋势强度确认
DC/KC中轨位置判断
3. 成交量与POC分析
成交量确认:
高成交量突破确认
中等成交量支撑确认
POC价值区域:
基于成交量分布的密集成交区识别
POC集群评分系统(规模分+成交量分+时间分)
🟠【交易逻辑详解】
入场信号分类
A类信号(强势突破)
触发条件:VP突破POC关键位 + 强势形态确认
特征:高置信度,大仓位配置
止损设置:相对宽松,基于ATR历史波动率
B类信号(形态确认)
触发条件:明确价格形态 + 成交量确认
特征:中等置信度,标准仓位
止损设置:基于形态低点/高点
C类信号(弱势反弹)
触发条件:单一指标信号 + 位置支撑
特征:低置信度,小仓位试探
止损设置:紧凑止损,快速离场
评分权重分配
text
基础分 = 突破分(30%) + 形态分(40%) + 位置分(30%)
最终分 = 基础分 × 市场状态系数 × 云图位置系数
🟠【风险管理系统】
动态止损策略
初始止损:基于ATR波动率 + 市场状态调整系数
移动止损:分阶段跟踪,逐级锁定利润
仓位管理
text
基础仓位 = 初始资金 × 基础系数 / 止损距离
最终仓位 = 基础仓位 × 信号强度系数 × 市场波动系数
止盈系统
分级止盈:8个止盈级别,按仓位比例分配
动态调整:达到特定止盈级别后启动移动止损
🟠【配置参数】
市场状态阈值
pinescript
低波动区间:≤30分
震荡区间:31-65分
高波动区间:>65分
信号强度阈值
pinescript
// 当前开仓阈值(无持仓)
低波动:做多82分 / 做空82分
震荡:做多75分 / 做空80分
高波动:做多80分 / 做空85分
// 反转开仓阈值
低波动:做多75分 / 做空90分
震荡:做多85分 / 做空90分
高波动:做多90分 / 做空100分
🟠【使用指南】
1. 初始设置
添加到ETH/USDT 15分钟图表
配置webhook信号ID和UID
根据资金量调整初始资本参数
2. 监控要点
市场状态指示器:关注背景颜色变化
信号评分显示:实时查看多头/空头得分
POC价值区域:识别关键支撑阻力
3. 交易决策流程
趋势确认阶段:
text
1. 观察市场状态背景色
2. 确认云图位置关系
3. 检查ADX趋势强度
入场信号筛选:
text
1. 综合评分 > 对应阈值
2. 多指标信号共振
3. 成交量确认配合
风险管理执行:
text
1. 自动计算仓位大小
2. 设置分级止盈止损
3. 监控移动止损更新
4. 高级功能
回看模式:启用历史信号验证
特殊平仓:基于ATR比率的提前离场
信号过滤:通过调整各组件权重优化信号质量
该策略通过系统化的多因子评分机制,在复杂的市场环境中实现稳定的自动化交易决策,特别适合ETH等加密货币的短期波动特性。

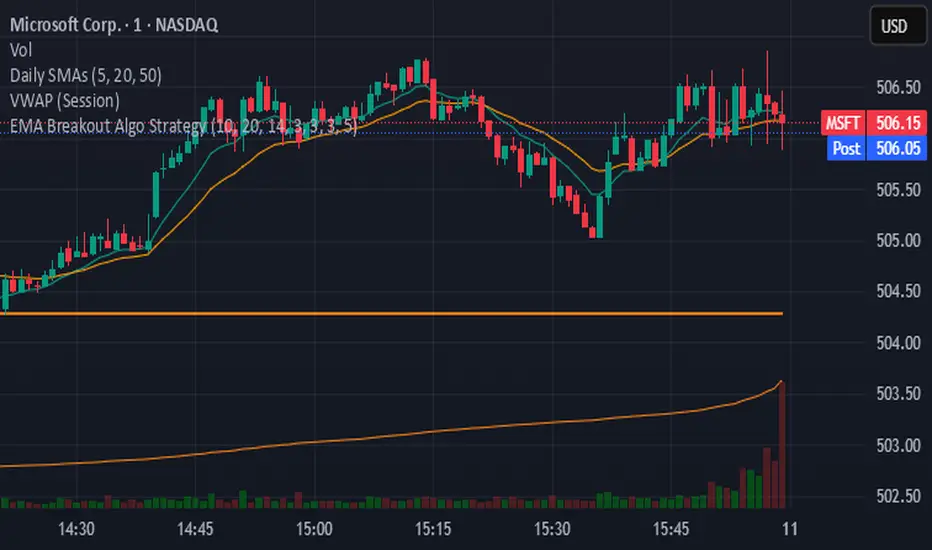
EMA Breakout Algo StrategyA volatility‑based breakout strategy using EMA alignment and ATR filters for risk‑managed entries and exits.
Real-Time EMA Cross Strategy For Fast Scalping📊 Overview
A professional-grade EMA crossover strategy with real-time execution capabilities. Designed for traders who need instant signal execution and seamless position management, this strategy adapts to any trading style with fully customizable EMA periods.
⚡ Core Features
Instant Execution Technology: Enter/exit positions immediately when signals occur
Seamless Position Switching: Automatically reverses positions without gaps or delays
Customizable EMA Periods: Adapt to any market or timeframe with adjustable settings
Real-Time & Bar-Close Modes: Choose your execution preference
Smart Position Management: No overlapping positions, clean entries and exits
Professional Dashboard: Live monitoring of indicators and position status
🎯 Ideal For
Scalpers requiring instant execution
Day traders seeking responsive strategies
Swing traders who need reliable crossover signals
Anyone looking for a clean, professional trading system
💎 What Makes This Special
No Lag: Real-time mode executes trades the moment crossover occurs
Clean Code: Optimized Pine Script v5 with best practices
Visual Clarity: Color-coded zones, clear signal markers, and info panel
Flexibility: Works across all timeframes and markets
Professional Grade: Includes proper position sizing and risk management
📈 How It Works
Long Signal: Fast EMA crosses above Slow EMA
Short Signal: Fast EMA crosses below Slow EMA
Position Management: Automatic reversal on opposite signals
Execution Options: Choose between instant or bar-close execution
⚙️ Customization
Adjust both EMA periods to match your strategy (2/5, 4/9, 9/21, 12/26, etc.)
Toggle real-time execution on/off
Full control over position sizing
Customizable visual elements
🔔 Built-in Alerts
Long entry signals
Short entry signals
Position reversal notifications
📝 Tips for Best Results
Lower timeframes (1-15min) for scalping with fast EMAs
Higher timeframes (1H-4H) for swing trading with slower EMAs
Test different EMA combinations to find your edge
Always use proper risk management
🚀 Version 3 Improvements
Enhanced crossover detection algorithm
Improved real-time execution logic
Better position management
Cleaner visual interface
More reliable signal generation

Empire OS Trading Fully Automated Prop Firm Ready💎 Prop-Firm-Ready Momentum System v3 — The Gold-Mine Algorithm 💎
Engineered for the same standards that top prop firms demand — minimal drawdown, consistent equity growth, and precision-based execution. This isn’t a basic indicator; it’s a refined momentum engine built for traders who scale capital and manage risk like professionals.
Performance Snapshot
• Profit Factor 2.26 • Win Rate 33 % • Max Drawdown 0.9 % • Total P/L + $447 • W/L Ratio 4.6 : 1
Stress-tested on Gold (XAUUSD) across live-market conditions, it stays composed under volatility and delivers structured, data-driven consistency.
⚡ See it. Test it. Scale it.
Built for prop-firm precision — from $10 K to $300 K and beyond.

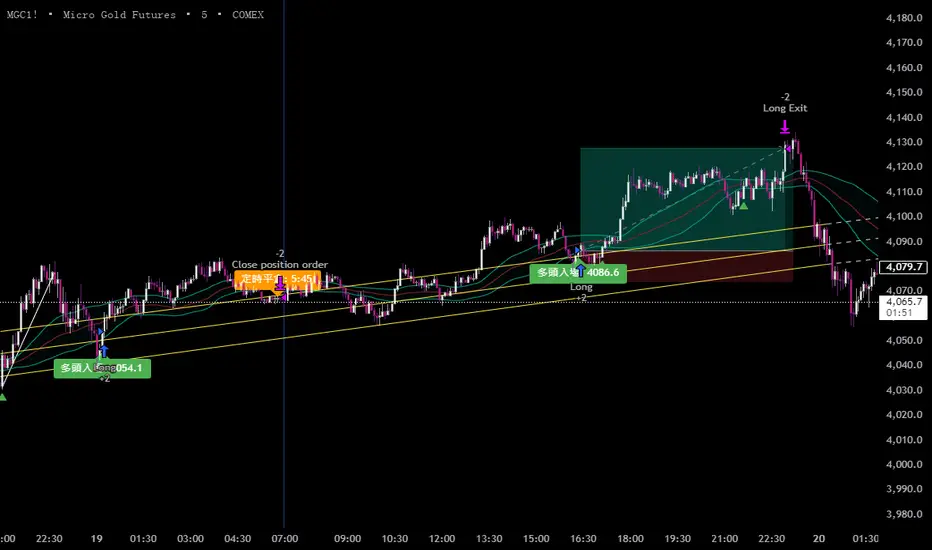
[Aegis]Original Turtle System for CryptoAs Richard Dennis once said, "Even if I published all the Turtle rules in the newspaper right now, no one would be able to 'execute' them," and 40 years later, even in modern financial markets (like the crypto market) where all the conditions have been disclosed, this strategy continues to deliver amazing performance. The following outlines the original Turtle rules as disclosed by Curtis Faith in his book *Way of the Turtle*, and a TradingView algorithm that translates these rules for application in the crypto market.
---
### **The Original Turtle Trading Rules**
#### **1. Markets**
* Trade in liquid futures markets.
#### **2. Position Sizing**
The volatility measure, **N**, is used as the basis for all calculations.
**True Range (TR) Calculation:** Select the largest of the following three values:
* Current High - Current Low
* $|\text{Current High} - \text{Previous Close}|$ (Absolute Value)
* $|\text{Current Low} - \text{Previous Close}|$ (Absolute Value)
**N (Average True Range, ATR) Calculation:**
$$N = \frac{(19 \times \text{PDN} + \text{TR})}{20}$$
* **PDN:** Previous Day's N value
* **TR:** Current True Range
This is similar to a 20-day Exponential Moving Average, and is sometimes calculated using a Simple Moving Average.
**Unit Size Calculation:**
$$\text{Unit Size (Number of Contracts)} = \frac{1\% \text{ of Account Equity}}{(\text{N} \times \text{Dollars per Point})}$$
* **Dollars per Point (Tick Value):** The value of a 1-point change in price.
#### **3. Entries**
* **Entry:** Buy when the 55-day high is broken to the upside, and sell when the 55-day low is broken to the downside.
#### **5. Stops**
* The stop-loss for every unit is set at a price **2N** unfavorable from the entry price.
* For each additional unit added, the stop price for the **entire position** is adjusted favorably by **1/2 N**.
* In other words, the stop price of the last unit entered becomes the stop price for the entire position.
#### **6. Exits**
The exit rule for profitable positions (before a stop is hit) is as follows:
* **Long Positions:** Exit when the 20-day low is broken to the downside.
* **Short Positions:** Exit when the 20-day high is broken to the upside.
*Note: This exit rule is followed only if the price has moved up by a value greater than or equal to the N value multiplied by the criterion for changing the take-profit line (the original Korean text mentions a condition based on N, which is commonly interpreted as requiring a profit before applying the channel exit).*
리처드 데니스가 앞서 "내가 지금 당장 터틀의 모든 규칙을 신문에 공표한다고 해도 아무도 '실행'하지 못할 것"라고 말했듯 40년이 흘러 모든 조건이 공개된 현대 금융시장(크립토 시장)에서도 여전히 이 전략은 놀라운 퍼포먼스를 기록하고 있습니다. 아래는 커티스 페이스가 자신의 저서 '터틀의 방식'에 공개한 오리지널 터틀 규칙과 이를 알고리즘으로 변환하여 크립토마켓에 적용한 트레이딩뷰 알고리즘 입니다.
##### 1. 시장 (Markets)
• 유동성이 풍부한 선물 시장에서 거래한다.
##### 2. 포지션 크기 (Position Sizing)
변동성 측정 단위인 N을 모든 계산의 기초로 사용한다.
**True Range (TR) 계산:** 다음 세 가지 값 중 가장 큰 값을 선택한다.
- • 현재 고가 - 현재 저가
- • |현재 고가 - 전일 종가| (절대값)
- • |현재 저가 - 전일 종가| (절대값)
**N (Average True Range, ATR) 계산:**
N = (19 × PDN + TR) / 20
- • PDN: 이전 날의 N 값
- • TR: 현재 True Range
이는 20일 지수이동평균과 유사하며, 단순이동평균으로 계산하기도 한다.
**1 유닛(Unit)의 크기 계산:**
유닛 크기 (계약 수) = 계좌 자산의 1% / (N × 틱 가치)
• 틱 가치(Dollars per Point): 1포인트 변동 시의 가치
##### 3. 진입 (Entries)
- • 진입: 55일 고가를 상향 돌파하면 매수, 55일 저가를 하향 돌파하면 매도한다.
##### 5. 손절 (Stops)
- • 모든 유닛에 대한 손절 기준은 진입 가격으로부터 2N 만큼 불리한 가격에 설정한다.
- • 유닛이 추가될 때마다 전체 포지션의 손절 가격을 1/2 N 만큼 유리한 방향으로 상향 조정한다.
- • 즉, 마지막으로 진입한 유닛의 손절 가격이 전체 포지션의 손절 가격이 된다.
##### 6. 청산 (Exits)
손절에 도달하기 전 수익 중인 포지션의 청산 규칙은 다음과 같다.
- • 매수 포지션: 20일 저가를 하향 돌파할 때 청산한다.
- • 매도 포지션: 20일 고가를 상향 돌파할 때 청산한다.
단, N값에 익절선 변경 기준을 곱한 값 이상으로 가격이 상승할 경우, 위 규칙을 따른다.

Ekoparaloji Cyrpto StrategyEkoparaloji Crypto Strategy - User Information Document
📊 Strategy Overview
This strategy provides long-term position management in cryptocurrency markets using the averaging down (pyramiding) technique. The basic logic is to controllably grow positions as prices decline and exit when specific profit targets are reached.
🎯 Key Features
✅ Automatic Entry System
Market direction is determined using a proprietary trend identification algorithm
Trades are only opened in uptrends
Initial position opens automatically when specific conditions are met
📈 Pyramiding Mechanism
New positions are automatically added as price decreases
Up to 10 positions can be added maximum
Each addition occurs at predetermined decline levels
Risk management through dynamic position sizing
💰 Profit and Loss Management
Take Profit: All positions close when the specified percentage above average cost is reached
Stop Loss (Optional): Protects a specified percentage of total capital
A certain ratio of available capital is used in each trade
📊 Visual Tracking System
The following information is displayed in real-time on the chart:
✅ Average cost level
✅ Profit target level
✅ Stop loss level (if active)
✅ Next pyramiding level
✅ Liquidation (capital reset) level
✅ Trend indicator
🛡️ Risk Management Features
1. Dynamic Capital Protection
Automatic exit when losses exceed a specified percentage of total capital
Complete loss scenario can be previewed through liquidation level calculation
2. Position Control System
Protection preventing multiple trades on the same bar
Double trigger prevention mechanism
Maximum position limit
3. Time Filter
Optional trading within a date range
Ideal for testing on historical data
📱 Information Panel
Information table always visible in the upper right corner of the strategy:
When Position is Open:
Number of active positions
Average cost
Current price
Total capital status
Capital loss percentage
Profit target
Stop loss level and distance
Next entry level
Liquidation level and distance
When No Position:
Market trend (Uptrend/Downtrend)
Ready to trade?
Reason for waiting
Initial position size
Target profit percentage
⚙️ Adjustable Parameters
Customizable by user:
💵 Capital Amount: Base amount to be used for each position
📊 Profit Target: Profit percentage at which to exit
🛑 Stop Loss: Usage status and maximum loss percentage
📅 Time Filter: Start and end dates for testing
💬 Trade Comments: Custom labels for each trade
📘 Understanding Leverage Effect
1. What is the Leverage Effect?
Although there's no real leverage in the spot market, when Capital Amount is increased, capital usage works like leverage:
Capital Amount 5% (1.0x): 100% capital usage with full pyramiding = All your money in trades
Capital Amount 10% (2.0x): 200% capital usage with full pyramiding = Attempting to open trades worth 2x your capital
Capital Amount 15% (3.0x): 300% capital usage with full pyramiding = Attempting to open trades worth 3x your capital
⚠️ IMPORTANT: If your capital runs out in the spot market, you cannot open new positions, therefore it's recommended to keep Capital Amount at 5% or below!
⚠️ Important Warnings
Pyramiding Risk: If price continues to decline, position grows and risk increases
Capital Requirements: Up to 10 positions can be added, requiring sufficient capital
Trend Dependency: Only works in uptrends
Backtest Results: Past performance is not a guarantee of future results
Real Trading Risks: Slippage, commissions, and market conditions can affect results
🎓 How to Use
Add the strategy to your chart
Adjust parameters according to your risk appetite
Examine past performance by backtesting
Optionally set up alerts to activate notifications
Test with paper trading first
This strategy is for educational purposes. Do your own research and only trade with capital you can afford to lose.
Disclaimer: This strategy is not financial advice. All investment decisions are the user's responsibility.
Happy trading! 📊

Ekoparaloji Strategy Crypto Ekoparaloji Crypto Strategy - User Information Document
📊 Strategy Overview
This strategy provides long-term position management in cryptocurrency markets using the averaging down (pyramiding) technique. The basic logic is to controllably grow positions as prices decline and exit when specific profit targets are reached.
🎯 Key Features
✅ Automatic Entry System
Market direction is determined using a proprietary trend identification algorithm
Trades are only opened in uptrends
Initial position opens automatically when specific conditions are met
📈 Pyramiding Mechanism
New positions are automatically added as price decreases
Up to 10 positions can be added maximum
Each addition occurs at predetermined decline levels
Risk management through dynamic position sizing
💰 Profit and Loss Management
Take Profit: All positions close when the specified percentage above average cost is reached
Stop Loss (Optional): Protects a specified percentage of total capital
A certain ratio of available capital is used in each trade
📊 Visual Tracking System
The following information is displayed in real-time on the chart:
✅ Average cost level
✅ Profit target level
✅ Stop loss level (if active)
✅ Next pyramiding level
✅ Liquidation (capital reset) level
✅ Trend indicator
🛡️ Risk Management Features
1. Dynamic Capital Protection
Automatic exit when losses exceed a specified percentage of total capital
Complete loss scenario can be previewed through liquidation level calculation
2. Position Control System
Protection preventing multiple trades on the same bar
Double trigger prevention mechanism
Maximum position limit
3. Time Filter
Optional trading within a date range
Ideal for testing on historical data
📱 Information Panel
Information table always visible in the upper right corner of the strategy:
When Position is Open:
Number of active positions
Average cost
Current price
Total capital status
Capital loss percentage
Profit target
Stop loss level and distance
Next entry level
Liquidation level and distance
When No Position:
Market trend (Uptrend/Downtrend)
Ready to trade?
Reason for waiting
Initial position size
Target profit percentage
⚙️ Adjustable Parameters
Customizable by user:
💵 Capital Amount: Base amount to be used for each position
📊 Profit Target: Profit percentage at which to exit
🛑 Stop Loss: Usage status and maximum loss percentage
📅 Time Filter: Start and end dates for testing
💬 Trade Comments: Custom labels for each trade
📘 Understanding Leverage Effect
1. What is the Leverage Effect?
Although there's no real leverage in the spot market, when Capital Amount is increased, capital usage works like leverage:
Capital Amount 5% (1.0x): 100% capital usage with full pyramiding = All your money in trades
Capital Amount 10% (2.0x): 200% capital usage with full pyramiding = Attempting to open trades worth 2x your capital
Capital Amount 15% (3.0x): 300% capital usage with full pyramiding = Attempting to open trades worth 3x your capital
⚠️ IMPORTANT: If your capital runs out in the spot market, you cannot open new positions, therefore it's recommended to keep Capital Amount at 5% or below!
⚠️ Important Warnings
Pyramiding Risk: If price continues to decline, position grows and risk increases
Capital Requirements: Up to 10 positions can be added, requiring sufficient capital
Trend Dependency: Only works in uptrends
Backtest Results: Past performance is not a guarantee of future results
Real Trading Risks: Slippage, commissions, and market conditions can affect results
🎓 How to Use
Add the strategy to your chart
Adjust parameters according to your risk appetite
Examine past performance by backtesting
Optionally set up alerts to activate notifications
Test with paper trading first
This strategy is for educational purposes. Do your own research and only trade with capital you can afford to lose.
Disclaimer: This strategy is not financial advice. All investment decisions are the user's responsibility.

Ajay R5.41🔻 Ajay Gold 3H Sell Power Indicator 🔻
Precision-Based Smart Sell System for Gold (XAU/USD)
💡 Overview
This indicator is specifically designed for Gold (XAU/USD) and delivers best results on the 3-Hour Timeframe (3H TF).
It is a Smart Money Logic-based Sell Confirmation System, combining institutional structure and candle behavior to generate highly accurate bearish signals.
⚙️ Technical Foundation
The indicator uses multiple advanced confirmations:
📉 EMA Trend Filter → Confirms downtrend
💪 RSI Overbought Rejection → Momentum reversal signal
📊 MACD Bearish Cross → Confirms trend strength
🕯️ Bearish Candle Structure → Price action validation
When all conditions align, a clear 🔻 Sell Signal is plotted on the chart.
💎 Hidden Feature
This indicator includes a hidden feature that activates only when the correct market structure forms.
It helps reduce false signals and increases accuracy without being visible on the chart — fully automated internal logic.
📆 Recommended Settings
Symbol: XAU/USD (Gold)
Timeframe: 3-Hour (3H)
Market: Forex / Commodity
Mode: Sell-Only Confirmation Indicator
Performance: Best precision and consistency on 3H TF
📈 How to Use
Select XAU/USD on chart and set 3H timeframe.
Add the indicator to the chart.
Wait for the 🔻 Sell Signal and confirm the market structure after candle close.
Take entry according to your risk management.
⚠️ Disclaimer
This indicator is for educational and analytical purposes only.
No system is 100% accurate — always backtest and demo trade before using in real trading.
💬 Credits
Developed by Ajay Sahu (India)
Based on Institutional & Smart Money Logic
Best results on 3H TF
Hidden Algorithm for XAU/USD traders

Ajay R5.41🔻 Ajay Gold 3H Power Indicator 🔻
Precision-Based Smart Sell System for Gold (XAU/USD)
💡 Overview
This indicator is specifically designed for Gold (XAU/USD) and delivers best results on the 3-Hour Timeframe (3H TF).
It is a Smart Money Logic-based Sell Confirmation System, combining institutional structure and candle behavior to generate highly accurate bearish signals.
⚙️ Technical Foundation
The indicator uses multiple advanced confirmations:
📉 EMA Trend Filter → Confirms downtrend
💪 RSI Overbought Rejection → Momentum reversal signal
📊 MACD Bearish Cross → Confirms trend strength
🕯️ Bearish Candle Structure → Price action validation
When all conditions align, a clear 🔻 Sell Signal is plotted on the chart.
💎 Hidden Feature
This indicator includes a hidden feature that activates only when the correct market structure forms.
It helps reduce false signals and increases accuracy without being visible on the chart — fully automated internal logic.
📆 Recommended Settings
Symbol: XAU/USD (Gold)
Timeframe: 3-Hour (3H)
Market: Forex / Commodity
Mode: Sell-Only Confirmation Indicator
Performance: Best precision and consistency on 3H TF
📈 How to Use
Select XAU/USD on chart and set 3H timeframe.
Add the indicator to the chart.
Wait for the 🔻 Sell Signal and confirm the market structure after candle close.
Take entry according to your risk management.
⚠️ Disclaimer
This indicator is for educational and analytical purposes only.
No system is 100% accurate — always backtest and demo trade before using in real trading.
💬 Credits
Developed by Ajay Sahu (India)
Based on Institutional & Smart Money Logic
Best results on 3H TF
Hidden Algorithm for XAU/USD traders

Nemesis Strategy MLWinning That's all I know
Years of research been done to this strategy It's based on algorithm that detects where the markets are going Works on crypto this strategy his excellent indicators and it can generate a lot of money if you know what you are doing and depending on the fees of the exchanges as well So be smart and be kind God bless you all
AlgoAIDESIGNED FOR HEIKEN ASHI BARS
Gain Access here: algoai.store
AlgoAI
The Dark Edge of Trading
An AI-powered TradingView strategy that thrives across all markets. Short altcoin pumps. Ride NAS100 waves. Dominate gold, FX, stocks, and futures — all with one AI brain.
#1
Semi-Automatic Trading (Recommended)
Set up alerts on AlgoAI signals. As they come in, grade the setups and choose to enter manually. This gives you full control while leveraging AI precision.
#2
Fully Automated Trading
Pass signals via webhooks to TradersPost for futures or PineConnector for FX. Note: When running fully automated, it's suggested to use long-only or short-only mode to avoid side swiping and potential unintended drawdown.
BITSTAMP:BTCUSD

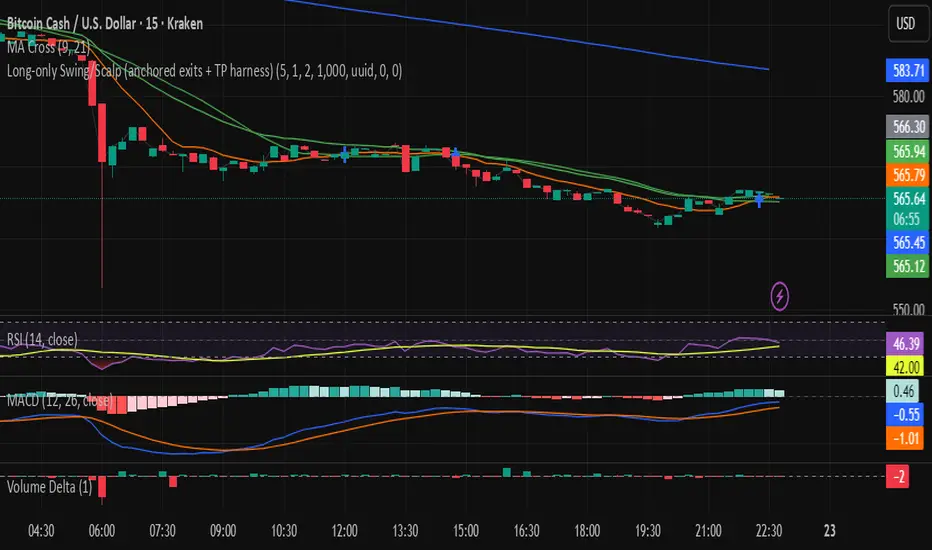
Long-only Swing/Scalp (anchored exits + TP harness) Traders PostThis is the Traders Post friendly drag and drop version of the swing/ scalp strategy for the algo traders out there. Let me know your thoughts, constructive criticism is always welcome.
TradeMastersAlgoOur strategy is a long only algorithm that has produced repeatable positive results in both back testing and live testing. The code is our proprietary IP. Users may have a 30 free trial to experiment with our strategy.
Results are not guaranteed.
This strategy was created for automated day trading a fully funded margin account. Please exercise caution and discipline when using any strategy. We've had the most positive results with heavy diversification (40 tickers trading 5% equity each).
Ticker selection, timeframe, and chart type ( we use standard candles ) are up to the user.
We encourage you to keep your own method to your self to prevent the dilution of your strategy.
Ajay Nayak - EMA ATR Trailinge strategy RSI aur RSI ke SMA ke crossover par CALL aur PUT signal generate karti hai.
Saath me ATR based stoploss aur crossover target bhi diya gaya hai.
Algo trading ke liye useful hai.

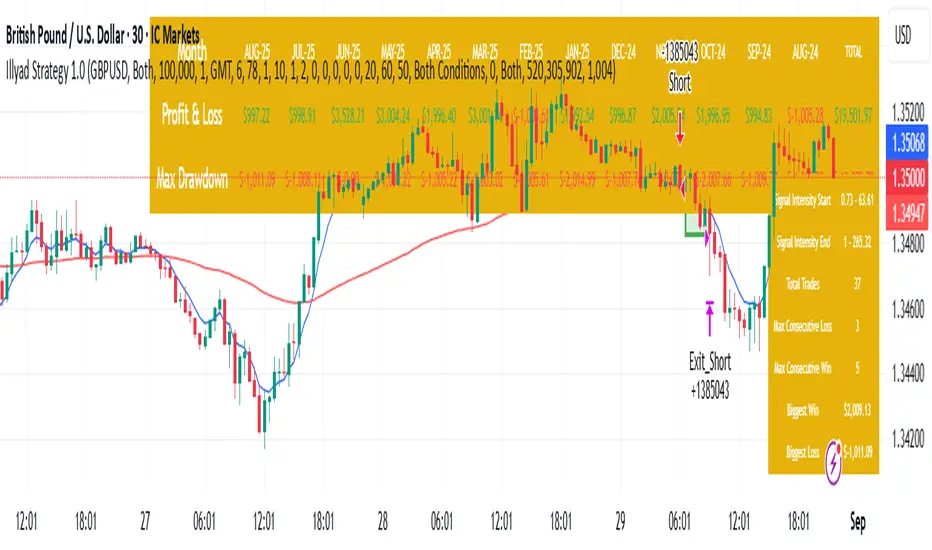
Optimised GBP/USD (IC Markets, 30m)This is the Illyad Strategy 1.0 optimised for GBP/USD on the 30-minute timeframe (IC Markets feed).
📊 Backtest Results (Jan 2024 – Aug 2025):
✅ Total P&L: +19,501.97 USD (+19.50%)
📉 Max Drawdown: 3.57% (3,607.64 USD)
🔁 Total Trades: 37
📈 Win Rate: 51.35% (19/37 trades)
⚖️ Profit Factor: 2.08
This version shows steady profitability with controlled drawdown, making it highly effective for prop firm evaluations and scaling accounts.
🔧 Optimisation Notes:
Works best on the 30-minute timeframe.
Each symbol behaves differently — always optimise the algo per instrument (e.g. GBP/USD vs EUR/GBP vs Gold).
Parameters such as moving averages, risk, and SL/TP ratios can be tuned to maximise performance.
💡 Best Use Cases:
Prop firm challenges (FTMO, AquaFunded, MyForexFunds, etc.).
Scaling funded capital by trading multiple accounts simultaneously.
Full automation via TradingView alerts → MT5 integration.
⚠️ Disclaimer:
This script is for educational purposes only. Past results do not guarantee future performance. Always backtest and forward-test on demo before going live.
📲 Next Steps:
This setup demonstrates the GBP/USD optimisation. The Illyad Strategy can be adjusted to perform across any forex pair, index, or stock with proper optimisation.
👉 Check my profile for full automation solutions.
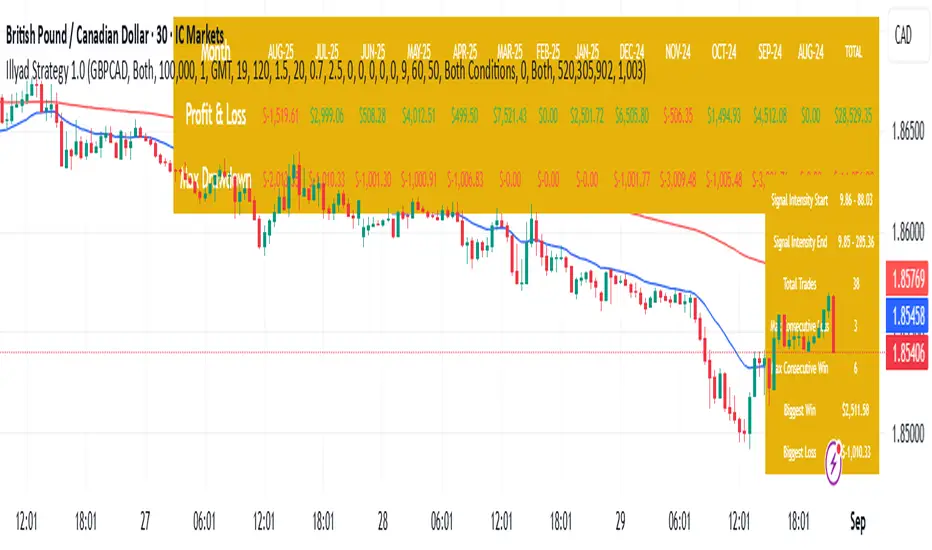
Optimised GBP/CAD (IC Markets, 30m) - Automated TradingHere’s the Illyad Strategy 1.0 optimised for GBP/CAD on the 30-minute timeframe (IC Markets feed).
📊 Backtest Results (Jan 2024 – Aug 2025):
✅ Total P&L: +28,529.35 CAD (+28.53%)
📉 Max Drawdown: 3.61% (3,822.27 CAD)
🔁 Total Trades: 38
📈 Win Rate: 50.00% (19/38 trades)
⚖️ Profit Factor: 2.49
This setup shows strong performance with low drawdown, making it well-suited for prop firm trading and long-term portfolio compounding.
🔧 Optimisation Notes:
Works best on the 30-minute timeframe.
Each symbol has unique volatility and structure. To maximise results, you must optimise the algo per symbol (e.g., GBP/CAD vs EUR/USD vs NASDAQ).
Parameters such as moving averages, signal intensity, and SL/TP levels should be tuned to the instrument.
💡 Best Use Cases:
Prop firm challenges (FTMO, AquaFunded, MyForexFunds alternatives).
Running across multiple accounts simultaneously for compounding.
Automated execution via TradingView alerts → MT5 integration.
⚠️ Disclaimer:
This script is provided for educational purposes only. Past results do not guarantee future performance. Always backtest and forward-test on demo before live trading.
📲 Next Steps:
This version demonstrates the GBP/CAD optimisation. The Illyad Strategy can be tuned to work on any symbol (forex, indices, or stocks).
👉 Visit my profile for full automation solutions (TradingView → MT5)
Illyad Strategy 1.0 - Automate your alerts by connecting to MT5Illyad Strategy 1.0 – Automated Prop Trading System (30m Timeframe)
Description:
The Illyad Strategy 1.0 is a rule-based automated trading system designed for serious traders and prop-firm challenges.
🔑 Key Features:
Optimised to work best on the 30-minute timeframe.
Built-in money management to keep drawdown controlled.
Dynamic stop-loss / take-profit levels.
Works across forex, indices, and stocks.
Compatible with TradingView alerts → MT5 automation.
⚙️ Optimisation:
Each symbol has its own behaviour. For best results, you should optimise the parameters (moving averages, signal intensity, SL/TP ratios) on the symbol you want to trade. The algo adapts differently to EURUSD vs NASDAQ vs stocks like TSLA, so proper tuning is critical.
💡 Best Use Case:
Prop firm accounts (FTMO, MyForexFunds, AquaFunded, etc.).
Consistent returns without emotional decision-making.
Traders who want to scale multiple accounts at once.
⚠️ Disclaimer:
This script is for educational purposes. Past results do not guarantee future returns. Always backtest and forward test on demo before going live.
📲 Next Step:
This is the public version. If you’d like to connect it directly to MT5/MT4 for fully automated trading, visit my profile or contact me for details.
