Cerca negli script per "averages"
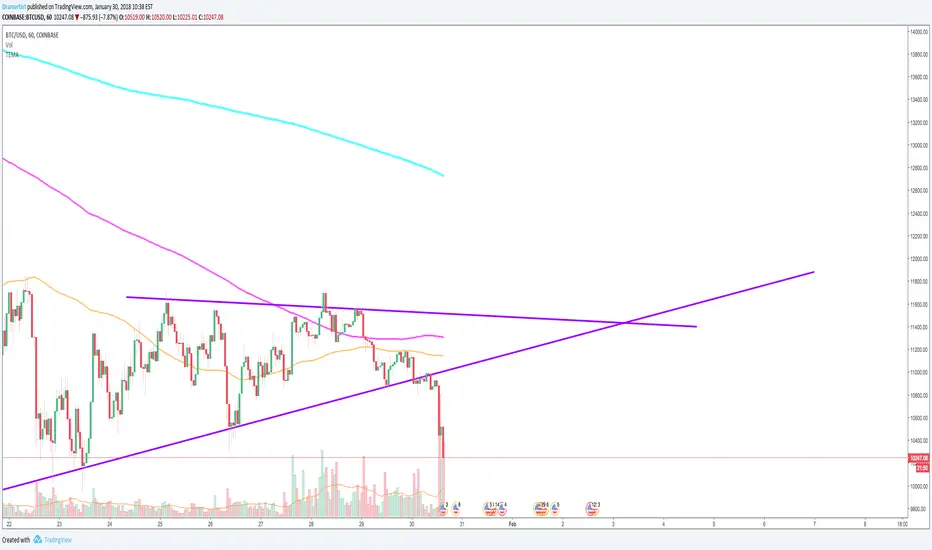

TEMA - Triple Moving Averages (50,100,200)Three Moving Averages in a single indicator, very useful if you are a free user and want to save some indicator slots.
Enjoy it :)

Triple Exponential Moving AveragesAdapted from Andy Foxx to use exponential instead of simple moving averages

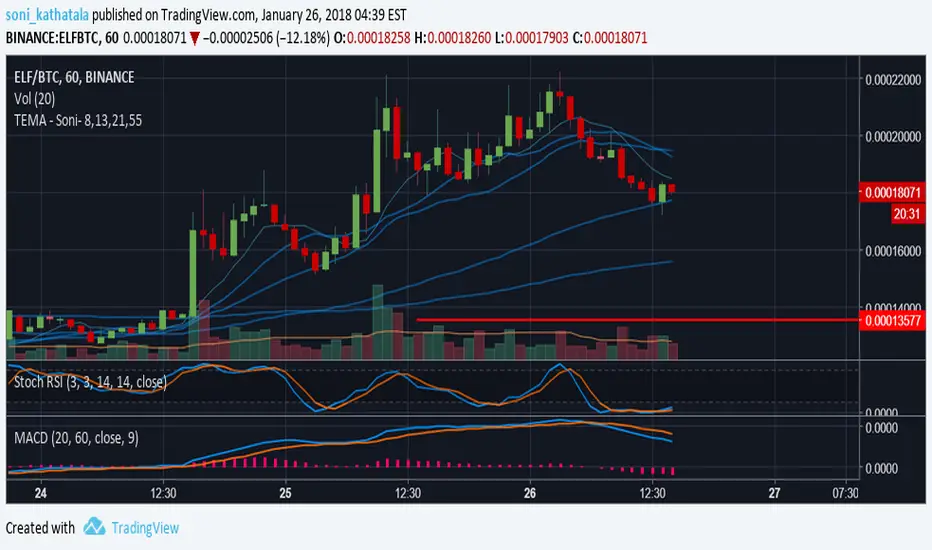
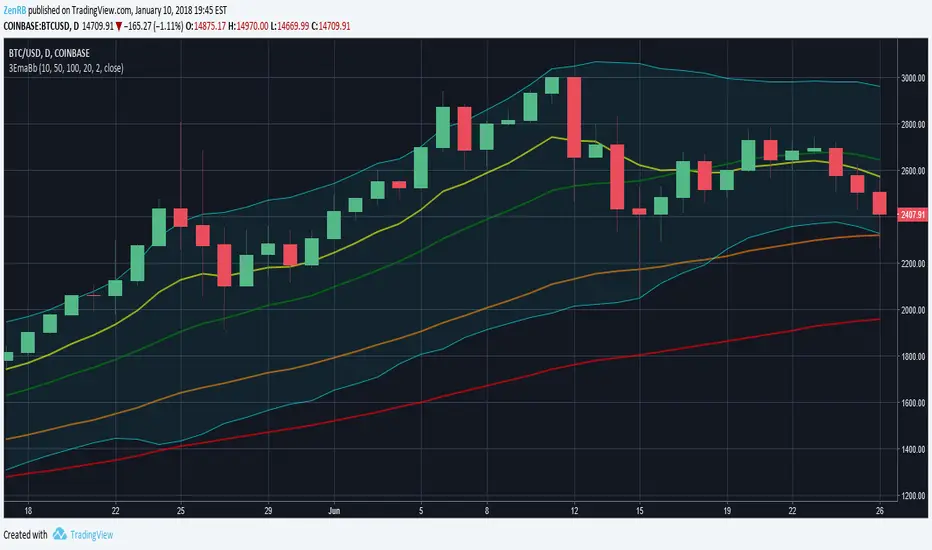
Triple Exponential Moving Averages with Bollinger BandsParameterized triple exponential moving averages with Bollinger Bands in one indicator.


Four Simple Moving AveragesProvides four simple moving averages in one indicator instead of having to add 4 separate indicators to the charts


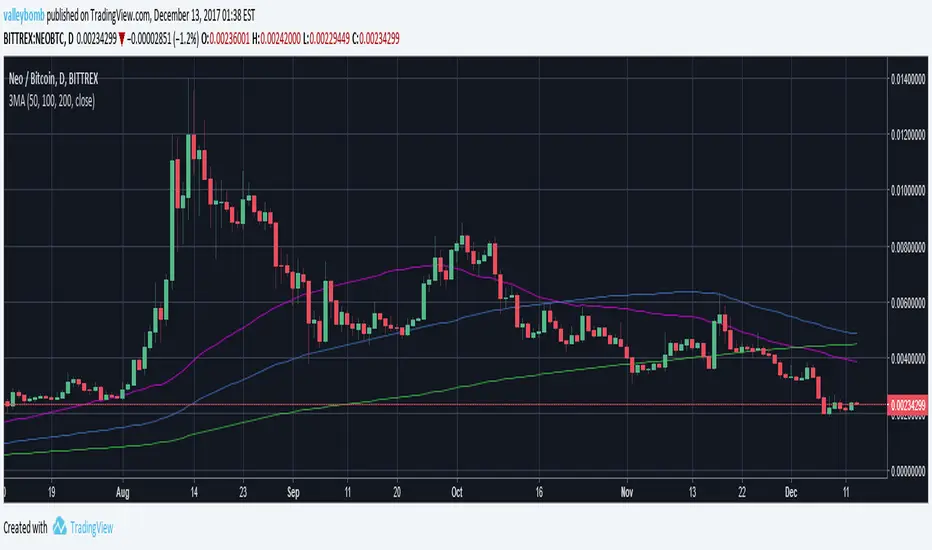
Triple Moving AveragesVery basic, just allows for 3 different moving averages in one indicator. Set the defaults to 50, 100 and 200 day, but numbers and colors can be adjusted to taste. Mashed this together from what I found online for a few people who were interested in having this in a community I belong to. Shout out to the Data Dash community!

Simple Moving AveragesYou can plot 10 simple moving averages with this script. special thanks to worldsapart89 for the original script.

Pivot Point Moving AveragesThis indicator contains two simple moving averages that is calculated from the pivot point rather than the closing price. This indicator is described in detail in chapter 6 of the book Candlestick and Pivot Point Trading Triggers: Setups for Stock, Forex, and Futures Markets by John L. Person.


Easy Multiple Moving AveragesFor easy one on/off clicking. Don't waste your time clicking multiple times.


Multi Movings Averages
This tool can plot a maximum of 10 movings averages that are easily adaptable and configurable.
You can also use a exponential moving average instead of the simple moving average.
hope you enjoy :)

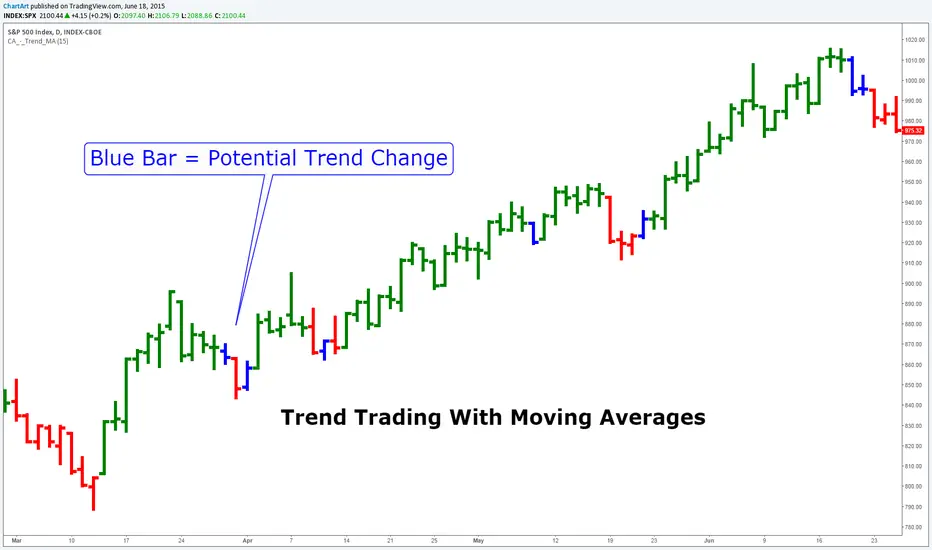
Trend Trading With Moving Averages (by ChartArt)This indicator is measuring if three different moving average calculations (EMA,WMA,SMA) with the same period length are aligned in an uptrend. If this is the case then the bar is colored in green. If only one or two of the three moving averages signals an uptrend then the bar is colored in blue. This can mean that the trend is changing.
Save another $999 bucks with this free indicator.
This is the ChartArt optimized version. Original idea: Steve Primo's Robbery Indicator (PET-D).
coded by UCSgears:
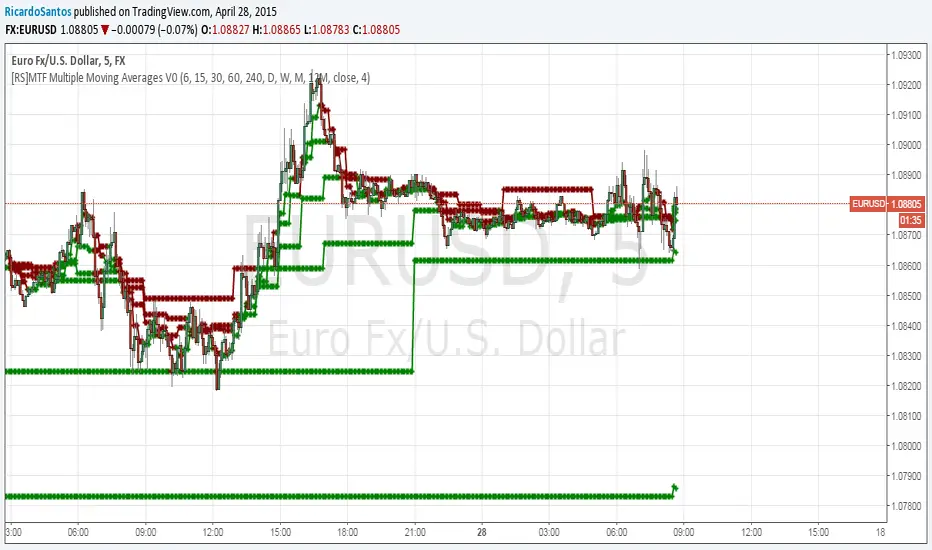
[RS]MTF Multiple Moving Averages V0Multiple moving averages with same interval in candle bar smoothness over multiple time frames.
option to show/hide the level of resolution for the mtf's default shows 1 ma can go up to 8th resolution.
option for manual input timeframes and configure ma.
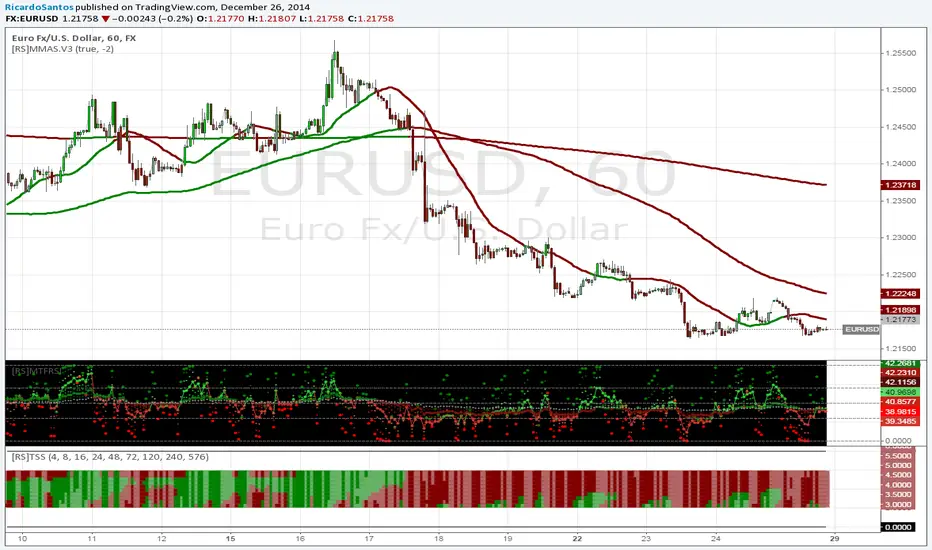
[RS]Multiple Moving Averages System V3Multiple moving averages system with color coding and hardcoded lengths based on time frame, if you have any suggestions feel free to post or pm.
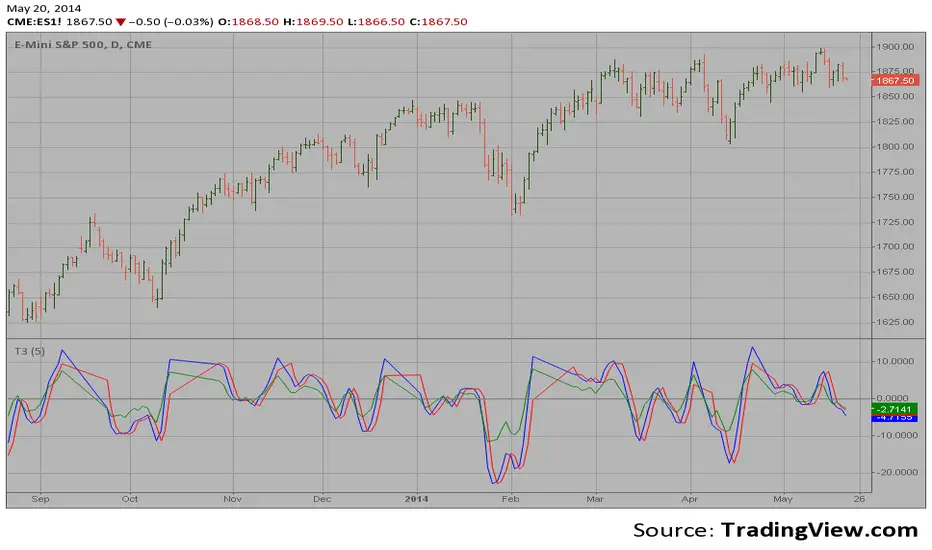
T3 3 Averages This function is an Pine version of the moving average described in
the January, 1998 issue of S&C magazine, p.57, "Smoothing Techniques
for More Accurate Signals", by Tim Tillson. It is translated from the
MetaStock code presented in the article. The function uses a version
of the XAverage, written by me, which allows variables as inputs.
The most popular method of interpreting a moving average is to compare
the relationship between a moving average of the security's price with
the security's price itself (or between several moving averages).
[REPOST] Indicators: 3 Different Adaptive Moving Averages*** NOTE: This is a repost with updated scripts to workaround the recent script engine changes ****
As the volatility rises, all Adaptive Moving Averages (AMA) become more sensitive and adapt faster to the price changes. As the volatility decreases, they slow down significantly compared to normal EMA. This makes it an excellent choice for detecting ranging markets (look for horizontal lines).
I have included 3 AMAs here:
- Kaufman's AMA. This makes use of Kaufman's Efficiency Ratio as the smoothing constant.
- Adaptive RSI. This adapts standard RSI to a smoothing constant.
- Tushar Chande's Variable Index Dynamic Average (VIDYA). This uses a pivotal smoothing constant, which is fixed, and varies the speed by using a factor based on the relative volatility to increase or decrease the value of SC.
For reference, I have plotted an EMA(10). This uses a fixed smoothing constant.
This is my 25th indicators post (Yayy!), so decided to include a bunch of AMAs. Enjoy :)
Feel free to "Make mine" and use these in your charts. Appreciate any comments / feedback.
