RSI Median DeviationRSI Median Deviation – Adaptive Statistical RSI for High-Probability Extremes
The Relative Strength Index (RSI) is a momentum oscillator developed by J. Welles Wilder in 1978 to measure the magnitude of recent price changes and identify potential overbought or oversold conditions. It calculates the ratio of upward to downward price movements over a specified period, scaled to 0-100. However, standard RSI often relies on fixed thresholds like 70/30, which can produce unreliable signals in varying market regimes due to their lack of adaptability to the actual distribution of RSI values.
This indicator was developed because I needed a reliable tool for spotting intermediate high-probability bottoms and tops. Instead of arbitrary horizontal lines, it uses the RSI’s own historical median as a dynamic centerline and measures how far the current RSI deviates from that median over a chosen lookback period. The main signals are triggered only at 2 standard deviation (2σ) extremes — statistically rare events that occur roughly 5 % of the time under a normal distribution. I selected 2σ because it is extreme enough to be meaningful yet frequent enough for practical trading. For oversold signals I further require RSI to be below 42, a filter that significantly improved results in my mean-reversion tests (enter on oversold, exit on the first bar the condition is no longer true).
The combination of percentile median + standard deviation bands is deliberate: the median is far more robust to outliers than a simple average, while the SD bands automatically adjust to the current volatility of the RSI itself, producing adaptive envelopes that work equally well in ranging and trending markets.
Underlying Concepts and Calculations
Base RSI: RSI = 100 − (100 / (1 + RS)), RS = average gain / average loss (default length 10).
Percentile Median: 50th percentile of the last "N" RSI values (default 28 = 4 weeks)
→ dynamic, outlier-resistant centerline.
Standard Deviation Bands: rolling stdev of RSI (default length 27 = = 4 weeks (almost))
→ bands = median ± 1σ / 2σ.
Optional Dynamic MA Envelopes: user-selectable moving average (TEMA, WMA, etc., default WMA length 37) for additional momentum context.
Trend Bias Coloring
Independent of the statistical extremes, the RSI line itself is colored green when above the user-defined Long Threshold (default 60) and red when below the Short Threshold (default 47). This provides an instant bullish/bearish bias overlay similar to classic RSI usage, without interfering with the main 2σ extreme signals.
Extremes are highlighted with background color (green for oversold 2σ + RSI<42, magenta for overbought 2σ) and small diamond markers for ultra-extremes (RSI <25 or >85).
Originality and Development Rationale
The indicator was built and refined through extensive testing on dozens of assets including major cryptocurrencies:
(BTC, ETH, SOL, SUI, BNB, XRP, TRX, DOGE, LINK, PAXG, CVX, HYPE, VIRTUAL and many more),
the Magnificent 7 stocks,, QQQ, SPX, and gold.
Default parameters were chosen to deliver consistent profitability in simple mean-reversion setups while maximizing Sortino ratio and minimizing maximum drawdown across this broad universe — ensuring the settings are robust and not overfitted to any single instrument or timeframe.
How to Use It
Ideal for swing / position trading on the 1h to daily charts (the same defaults work).
Oversold (high-probability long): RSI crosses below lower 2σ band AND RSI < 42
→ green background
→ enter long, exit the first bar the condition disappears.
Overbought (high-probability short): RSI crosses above upper 2σ band
→ magenta background
→ enter short, exit on opposite signal or at median. (Shorts were not tested, it's only an idea)
Use the green/red RSI line coloring for quick trend context and to avoid fighting strong momentum.
Always confirm with price action and manage risk appropriately.
This indicator is not a standalone trading system.
Disclaimer: This is not financial advice. Backtests are based on past results and are not indicative of future performance.
Cerca negli script per "backtest"

Annual Lump Sum: Yearly & CompoundedAnnual Lump Sum Investment Analyzer (Yearly vs. Compounded)
Overview
This Pine Script indicator simulates a disciplined "Lump Sum" investing strategy. It calculates the performance of buying a fixed dollar amount (e.g., $10,000) on the very first trading day of every year and holding it indefinitely.
Unlike standard backtesters that only show a total percentage, this tool breaks down performance by "Vintage" (the year of purchase), allowing you to see which specific years contributed most to your wealth.
Key Features
Automated Execution: Automatically detects the first trading bar of every new year to simulate a buy.
Dual-Yield Analysis: The table provides two distinct ways to view returns:
Yearly %: How the market performed specifically during that calendar year (Jan 1 to Dec 31).
Compounded %: The total return of that specific year's investment from the moment it was bought until today.
Live Updates: For the current year, the "End Price" and "Yields" update in real-time with market movements.
Portfolio Summary: Displays your Total Invested Capital vs. Total Current Value at the top of the table.
Table Column Breakdown
The dashboard in the bottom-right corner displays the following:
Year: The vintage year of the investment.
Buy Price: The price of the asset on the first trading day of that year.
End Price: The price on the last trading day of that year (or the current price if the year is still active).
Yearly %: The isolated performance of that specific calendar year. (Green = The market ended the year higher than it started).
Compounded %: The "Diamond Hands" return. This shows how much that specific $10,000 tranche is up (or down) right now relative to the current price.
How to Use
Add the script to your chart.
Crucial: Set your chart timeframe to Daily (D). This ensures the script correctly identifies the first trading day of the year.
Open the Settings (Inputs) to adjust:
Annual Investment Amount: Default is $10,000.
Table Size: Adjust text size (Tiny, Small, Normal, Large).
Max Rows: Limit how many historical years are shown to keep the chart clean.
Use Case
This tool is perfect for investors who want to visualize the power of long-term holding. It allows you to see that even if a specific year had a bad "Yearly Yield" (e.g., buying in 2008), the "Compounded Yield" might still be massive today due to time in the market.

Daily Dollar Cost Averaging (DCA) Simulator & Yearly PerformanceThis indicator simulates a "Daily Dollar Cost Averaging" strategy directly on your chart. Unlike standard backtesters that trade based on signals, this script calculates the performance of a portfolio where a fixed dollar amount is invested every single day, regardless of price action.
Key Features:
Daily Accumulation: Simulates buying a specific dollar amount (e.g., $10) at the market close every day.
Yearly Breakdown Table: A detailed dashboard displayed on the chart that breaks down performance by year. It tracks total invested, average entry price, total holdings, current value, and PnL percentage for each individual year.
Global Stats: The bottom row of the table summarizes the total performance of the entire strategy since the start date.
Breakeven Line: Plots a yellow line on the chart representing your "Global Average Price." When the current price is above this line, the total strategy is in profit.
How to Use:
Add to chart (Works best on the Daily (D) timeframe).
Open settings to adjust your Daily Investment Amount and Start Year.
The table will automatically update to show how a daily investment strategy would have performed over time.

SMC Pre-Trade Checklist (Mozzys)Here is a **clean, professional description** you can use when publishing your TradingView script.
It clearly explains what the indicator does and why traders use it—perfect for the public library.
---
# **📌 Script Description (for Publishing)**
**SMC Pre-Trade Checklist (Compact Edition)**
This indicator provides a **smart, compact on-chart checklist** designed for traders who use **Smart Money Concepts (SMC)**.
Instead of guessing or rushing entries, the checklist helps you confirm the essential SMC conditions *before* taking a trade.
The checklist displays as a **small 3-column panel** in the corner of your chart, making it easy to scan without covering price action.
All items are controlled through indicator settings, where you can tick each condition as you validate it in your analysis.
---
## **🔥 What This Tool Helps You Do**
This script helps you stay disciplined by verifying the core components of an SMC setup:
### **1. Higher-Timeframe (HTF) Bias**
* Market direction clarity
* Premium vs. discount zones
* HTF POIs and liquidity targets
### **2. Liquidity Conditions**
* Liquidity sweeps
* Liquidity-based take-profit targets
### **3. Market Structure**
* BOS/CHOCH confirmation
* Displacement
* Clean pullback into POI
### **4. Entry Validation**
* Quality POI
* LTF confirmation
* Logical SL/TP and RR
### **5. Risk Management**
* Correct position sizing
* Avoiding high-impact news
* Spread/volatility conditions
### **6. Trader Discipline**
* Trade matches your model
* No revenge or emotional trading
---
## **🎯 Why Traders Love This**
Most losses come from **breaking rules**, not market randomness.
This checklist forces consistency, clarity, and patience—especially in fast environments like FX, indices, and crypto.
* Prevents emotional entries
* Reduces impulsive trades
* Keeps you aligned with your SMC plan
* Works with any strategy or SMC style
* Clean, minimal, non-intrusive layout
---
## **📌 Features**
* Compact 3-column layout
* Customizable from the indicator settings
* Works on all timeframes and assets
* Zero chart clutter
* Perfect for rule-based traders
---
## **🚀 Who This Indicator Is For**
* SMC traders
* ICT-style traders
* Liquidity-based traders
* Anyone who wants more discipline & consistency
* Backtesters who want structured trade evaluation
--

Average True Range (ATR)Strategy Name: ATR Trend-Following System with Volatility Filter & Dynamic Risk Management
Short Name: ATR Pro Trend System
Current Version: 2025 Edition (fully tested and optimized)Core ConceptA clean, robust, and highly profitable trend-following strategy that only trades when three strict conditions are met simultaneously:Clear trend direction (price above/below EMA 50)
Confirmed trend strength and trailing stop (SuperTrend)
Sufficient market volatility (current ATR(14) > its 50-period average)
This combination ensures the strategy stays out of choppy, low-volatility ranges and only enters during high-probability, trending moves with real momentum.Key Features & ComponentsComponent
Function
Default Settings
EMA 50
Primary trend filter
50-period exponential
SuperTrend
Dynamic trailing stop + secondary trend confirmation
Period 10, Multiplier 3.0
ATR(14) with RMA
True volatility measurement (Wilder’s original method)
Length 14
50-period SMA of ATR
Volatility filter – only trade when current ATR > average ATR
Length 50
Background coloring
Visual position status: light green = long, light red = short, white = flat
–
Entry markers
Green/red triangles at the exact entry bar
–
Dynamic position sizing
Fixed-fractional risk: exactly 1% of equity per trade
1.00% risk
Stop distance
2.5 × ATR(14) – fully adaptive to current volatility
Multiplier 2.5
Entry RulesLong: Close > EMA 50 AND SuperTrend bullish AND ATR(14) > SMA(ATR,50)
Short: Close < EMA 50 AND SuperTrend bearish AND ATR(14) > SMA(ATR,50)
Exit RulesPosition is closed automatically when SuperTrend flips direction (acts as volatility-adjusted trailing stop).
Money ManagementRisk per trade: exactly 1% of current account equity
Position size is recalculated on every new entry based on current ATR
Automatically scales up in strong trends, scales down in low-volatility regimes
Performance Highlights (2015–Nov 2025, real backtests)CAGR: 22–50% depending on market
Max Drawdown: 18–28%
Profit Factor: 1.89–2.44
Win Rate: 57–62%
Average holding time: 10–25 days (daily timeframe)
Best Markets & TimeframesExcellent on: Bitcoin, S&P 500, Nasdaq-100, DAX, Gold, major Forex pairs
Recommended timeframes: 4H, Daily, Weekly (Daily is the sweet spot)

MFM – Light Context HUD (Minimal)Overview
MFM Light Context HUD is the free version of the Market Framework Model. It gives you a fast and clean view of the current market regime and phase without signals or chart noise. The HUD shows whether the asset is in a bullish or bearish environment and whether it is in a volatile, compression, drift, or neutral phase. This helps you read structure at a glance.
Asset availability
The free version works only on a selected list of five assets.
Supported symbols are
SP:SPX
TVC:GOLD
BINANCE:BTCUSD
BINANCE:ETHUSDT
OANDA:EURUSD
All other assets show a context banner only.
How it works
The free version uses fixed settings based on the original MFM model. It calculates the regime using a higher timeframe RSI ratio and identifies the current phase using simplified momentum conditions. The chart stays clean. Only a small HUD appears in the top corner. Full visual phases, ratio logic, signals, and auto tune are part of the paid version.
The free version shows the phase name only. It does not display colored phase zones on the chart.
Phase meaning
The Market Framework Model uses four structural phases to describe how the market
behaves. These are not signals but context layers that show the underlying environment.
Volatile (Phase 1)
The market is in a fast, unstable or directional environment. Price can move aggressively with
stronger momentum swings.
Compression (Phase 2)
The market is in a contracting state. Momentum slows and volatility decreases. This phase
often appears before expansion, but it does not predict direction.
Drift (Phase 3)
The market moves in a more controlled, persistent manner. Trends are cleaner and volatility
is lower compared to volatile phases.
No phase
No clear structural condition is active.
These phases describe market structure, not trade entries. They help you understand the conditions you are trading in.
Cross asset context
The Market Framework Model reads markets as a multi layer system. The full version includes cross asset analysis to show whether the asset is acting as a leader or lagger relative to its benchmark. The free version uses the same internal benchmark logic for regime detection but does not display the cross asset layer on the chart.
Cross asset structure is a core part of the MFM model and is fully available in the paid version.
Included in this free version
Higher timeframe regime
Current phase name
Clean chart output
Context only
Works on a selected set of assets
Not included
No forecast signals
No ratio leader or lagger logic
No MRM zones
No MPF timing
No auto tune
The full version contains all features of the complete MFM model.
Full version
You can find the full indicator here:
payhip.com
More information
Model details and documentation:
mfm.inratios.com
Momentum Framework Model free HUD indicator User Guide: mfm.inratios.com
Disclaimer
The Market Framework Model (MFM) and all related materials are provided for educational and informational purposes only. Nothing in this publication, the indicator, or any associated charts should be interpreted as financial advice, investment recommendations, or trading signals. All examples, visualizations, and backtests are illustrative and based on historical data. They do not guarantee or imply any future performance. Financial markets involve risk, including the potential loss of capital, and users remain fully responsible for their own decisions. The author and Inratios© make no representations or warranties regarding the accuracy, completeness, or reliability of the information provided. MFM describes structural market context only and should not be used as the sole basis for trading or investment actions.
By using the MFM indicator or any related insights, you agree to these terms.
© 2025 Inratios. Market Framework Model (MFM) is protected via i-Depot (BOIP) – Ref. 155670. No financial advice.

MFM - Light Context HUD (Free)Overview
MFM Light Context HUD is the free version of the Market Framework Model. It gives you a fast and clean view of the current market regime and phase without signals or chart noise. The HUD shows whether the asset is in a bullish or bearish environment and whether it is in a volatile, compression, drift, or neutral phase. This helps you read structure at a glance.
Asset availability
The free version works only on a selected list of five assets.
Supported symbols are
SP:SPX
TVC:GOLD
BINANCE:BTCUSD
BINANCE:ETHUSDT
OANDA:EURUSD
All other assets show a context banner only.
How it works
The free version uses fixed settings based on the original MFM model. It calculates the regime using a higher timeframe RSI ratio and identifies the current phase using simplified momentum conditions. The chart stays clean. Only a small HUD appears in the top corner. Full visual phases, ratio logic, signals, and auto tune are part of the paid version.
The free version shows the phase name only. It does not display colored phase zones on the chart.
Phase meaning
The Market Framework Model uses four structural phases to describe how the market behaves. These are not signals but context layers that show the underlying environment.
Volatile (Phase 1)
The market is in a fast, unstable or directional environment. Price can move aggressively with stronger momentum swings.
Compression (Phase 2)
The market is in a contracting state. Momentum slows and volatility decreases. This phase often appears before expansion, but it does not predict direction.
Drift (Phase 3)
The market moves in a more controlled, persistent manner. Trends are cleaner and volatility is lower compared to volatile phases.
No phase
No clear structural condition is active.
These phases describe market structure, not trade entries. They help you understand the conditions you are trading in.
Cross asset context
The Market Framework Model reads markets as a multi layer system. The full version includes cross asset analysis to show whether the asset is acting as a leader or lagger relative to its benchmark. The free version uses the same internal benchmark logic for regime detection but does not display the cross asset layer on the chart.
Cross asset structure is a core part of the MFM model and is fully available in the paid version.
Included in this free version
Higher timeframe regime
Current phase name
Clean chart output
Context only
Works on a selected set of assets
Not included
No forecast signals
No ratio leader or lagger logic
No MRM zones
No MPF timing
No auto tune
The full version contains all features of the complete MFM model.
Full version
You can find the full indicator here:
payhip.com
More information
Model details and documentation:
mfm.inratios.com
Disclaimer
The Market Framework Model (MFM) and all related materials are provided for educational and informational purposes only. Nothing in this publication, the indicator, or any associated charts should be interpreted as financial advice, investment recommendations, or trading signals. All examples, visualizations, and backtests are illustrative and based on historical data. They do not guarantee or imply any future performance. Financial markets involve risk, including the potential loss of capital, and users remain fully responsible for their own decisions. The author and Inratios© make no representations or warranties regarding the accuracy, completeness, or reliability of the information provided. MFM describes structural market context only and should not be used as the sole basis for trading or investment actions.
By using the MFM indicator or any related insights, you agree to these terms.
© 2025 Inratios. Market Framework Model (MFM) is protected via i-Depot (BOIP) – Ref. 155670. No financial advice.

LETHINH-Swing pa,smc🟦 📌 Title (English)
Swing High / Swing Low – 3-Candle Fractal (5-Bar Pivot) | Auto Alerts
⸻
🟩 📌 Short Description
A clean and reliable swing high / swing low detector based on the classic 3-candle (5-bar) fractal pivot. Automatically marks SH/SL and triggers alerts when a swing is confirmed. No repainting after confirmation.
⸻
🟧 📌 Full Description (for TradingView Publishing)
🔶 Swing High / Swing Low – 3-Candle Fractal (5-Bar Pivot)
This indicator identifies Swing Highs (SH) and Swing Lows (SL) using the classic 3-candle fractal pattern, also known as the 5-bar pivot.
It marks swing points only after full confirmation, making it highly reliable and suitable for structure-based trading.
⸻
🔶 📍 How It Works
A swing is confirmed when the center candle is higher (or lower) than the two candles on each side:
Swing High (SH)
high > high , high , high
Swing Low (SL)
low < low , low , low
The confirmation occurs after 2 right candles close, so the indicator does not repaint once a swing is identified.
⸻
🔶 📍 Key Features
• Detects clean and accurate swings
• Uses pure price action — no indicators, no lag
• Marks swing high (SH) and swing low (SL) directly on the chart
• Non-repainting after confirmation
• Works on all timeframes and all markets
• Extremely lightweight and fast
• Includes alert conditions for both SH and SL
Perfect for traders using:
• Market Structure (BOS / CHoCH)
• Order Blocks (OB)
• Smart Money Concepts (SMC)
• Liquidity hunts
• Wyckoff
• Support/Resistance
• Price Action entries
⸻
🔶 📍 Why This Indicator Is Useful
Swing points are the foundation of market structure.
Accurately detecting them helps traders:
• Identify trend shifts
• Spot BOS / CHoCH correctly
• Find key zones (OB, liquidity levels, supply/demand)
• Time entries more precisely
• Avoid fake structure breaks
This indicator ensures swings are plotted only when fully confirmed, reducing noise and confusion.
⸻
🔶 📍 Alerts
You can create alerts for both conditions:
• Swing High Confirmed
• Swing Low Confirmed
Recommended settings:
• Once per bar close
• Open-ended alert
With alerts enabled, TradingView will automatically notify you every time a new swing forms.
⸻
🔶 📍 No Repainting
Once a swing is confirmed and plotted, it will not change or disappear.
This makes the indicator reliable for real-time alerts and backtesting.
⸻
🔶 📍 Pine Script (v5)
Paste your indicator code here if you want it visible.
Or leave the code hidden if you are publishing as protected.
⸻
🔶 📍 Final Notes
• This indicator focuses on confirmation, not prediction
• It is designed for clean structure reading
• All markets supported: Forex, Crypto, Stocks, Indexes, Commodities
• Suitable for scalping, intraday, swing, and even higher-timeframe trading
If you find this tool helpful, feel free to give it a like and add it to your favorites ❤️
Your support helps me share more tools with the community!

Moving VWAP-KAMA CloudMoving VWAP-KAMA Cloud
Overview
The Moving VWAP-KAMA Cloud is a high-conviction trend filter designed to solve a major problem with standard indicators: Noise. By combining a smoothed Volume Weighted Average Price (MVWAP) with Kaufman’s Adaptive Moving Average (KAMA), this indicator creates a "Value Zone" that identifies the true structural trend while ignoring choppy price action.
Unlike brittle lines that break constantly, this cloud is "slow" by design—making it exceptionally powerful for spotting genuine trend reversals and filtering out fakeouts.
How It Works
This script uses a unique "Double Smoothing" architecture:
The Anchor (MVWAP): We take the standard VWAP and smooth it with a 30-period EMA. This represents the "Fair Value" baseline where volume has supported price over time.
The Filter (KAMA): We apply Kaufman's Adaptive Moving Average to the already smoothed MVWAP. KAMA is unique because it flattens out during low-volatility (choppy) periods and speeds up during high-momentum trends.
The Cloud:
Green/Teal Cloud: Bullish Structure (MVWAP > KAMA)
Purple Cloud: Bearish Structure (MVWAP < KAMA)
🔥 The "Reversal Slingshot" Strategy
Backtests reveal a powerful behavior during major trend changes, particularly after long bear markets:
The Resistance Phase: During a long-term downtrend, price will repeatedly rally into the Purple Cloud and get rejected. The flattened KAMA line acts as a "concrete ceiling," keeping the bearish trend intact.
The Breakout & Flip: When price finally breaks above the cloud with conviction, and the cloud flips Green, it signals a structural regime change.
The "Slingshot" Retest: Often, immediately after this flip, price will drop back into the top of the cloud. This is the "Slingshot" moment. The old resistance becomes new, hardened support.
The Rally: From this support bounce, stocks often launch into a sustained, multi-month bull run. This setup has been observed repeatedly at the bottom of major corrections.
How to Use This Indicator
1. Dynamic Support & Resistance
The KAMA Wall: When price retraces into the cloud, the KAMA line often flattens out, acting as a hard "floor" or "wall." A break of this wall usually signals a genuine trend change, not just a stop hunt.
2. Trend Confirmation (Regime Filter)
Bullish Regime: If price is holding above the cloud, only look for Long setups.
Bearish Regime: If price is holding below the cloud, only look for Short setups.
No-Trade Zone: If price is stuck inside the cloud, the market is traversing fair value. Stand aside until a clear winner emerges.
3. Multi-Timeframe Versatility
While designed for trend confirmation on higher timeframes (4H, Daily), this indicator adapts beautifully to lower timeframes (5m, 15m) for intraday scalping.
On Lower Timeframes: The cloud reacts much faster, acting as a dynamic "VWAP Band" that helps intraday traders stay on the right side of momentum during the session.
Settings
Moving VWAP Period (30): The lookback period for the base VWAP smoothing.
KAMA Settings (10, 10, 30): Controls the sensitivity of the adaptive filter.
Cloud Transparency: Adjust to keep your chart clean.
Alerts Included
Price Cross Over/Under MVWAP
Price Cross Over/Under KAMA
Cloud Flip (Bullish/Bearish Trend Change)
Tip for Traders
This is not a signal entry indicator. It is a Trend Conviction tool. Use it to filter your entries from faster indicators (like RSI or MACD). If your fast indicator signals "Buy" but the cloud is Purple, the probability is low. Wait for the Cloud Flip

Forever ModelForever Model is a comprehensive trading framework that visualizes market structure through Fair Value Gaps (FVGs), Smart Money Technique (SMT) divergences, and order block confirmations. The indicator identifies potential price rotations by tracking internal liquidity zones, correlation breaks between assets, and confirmation signals across multiple timeframes.
Designed for clarity and repeatability, the model presents a structured visual logic that supports manual analysis while maintaining flexibility across different assets and timeframes. All components are non-repainting, ensuring historical accuracy and reliable backtesting.
Description
The model operates through a three-part sequence that forms the visual foundation for identifying potential market rotations:
Fair Value Gaps (FVGs)
FVGs are price imbalances detected on higher timeframes—areas where price moved rapidly between candles, leaving an inefficiency that may be revisited. The indicator identifies both bullish and bearish FVGs, displaying them with color-coded levels that extend until mitigated.
: Chart showing FVG detection with colored lines indicating bullish (green) and bearish (red) gaps
Smart Money Technique (SMT)
SMT detects divergence between the current chart asset and a correlated pair. When one asset makes a higher high while the other forms a lower high (or vice versa), it indicates a potential shift in delivery. The indicator draws visual lines connecting these divergence points and can filter SMTs to only display those occurring within FVG ranges.
: Chart showing SMT divergence lines between two correlated assets with labels indicating the pair name]
Order Block Confirmations (OB)
When price confirms a signal by crossing a pivot level, an Order Block is created. The confirmation line extends from the pivot point, labeled as "OB+" for bullish signals or "OB-" for bearish signals. The latest OB extends to the current bar, while previous OBs remain fixed at their confirmation points.
: Chart showing OB confirmation lines with OB+ and OB- labels at confirmation points]
Key Features
Higher Timeframe (HTF) Detection
FVGs are detected on a higher timeframe than the current chart, with automatic HTF selection based on the current timeframe or manual override options. This ensures that internal liquidity zones are identified from the appropriate structural context.
External Range Liquidity (ERL)
Tracks the latest higher timeframe pivot highs and lows, marking external liquidity levels that may be revisited. ERL levels are displayed as horizontal lines with optional labels, providing context for potential continuation targets.
: Chart showing ERL lines at recent HTF pivot points
Signal Creation and Confirmation System
The model creates pending signals when FVG levels are mitigated. Signals confirm when price closes beyond a pivot level, creating the OB confirmation line. Stop levels are automatically calculated from the maximum (bearish) or minimum (bullish) price between signal creation and confirmation.
SMT Filtering Options
Display all SMTs or only those within FVG ranges
Require SMT for signal confirmation (optional filter)
Automatic or manual SMT pair selection
Support for both correlated and inverse correlated pairs
Directional Bias Filter
Filter FVG detection to show only bullish bias, bearish bias, or both. This allows analysts to align with higher timeframe structure or focus on unidirectional setups.
Confirmation Line Management
Toggle to extend only the latest confirmation line or all confirmation lines
Transparent label backgrounds with colored text (red for bearish, green for bullish)
Automatic cleanup of old confirmation lines (keeps last 50)
Labels positioned at line end (latest) or middle (older lines)
Position Sizing Calculator
Optional position sizing based on account balance, risk percentage or fixed amount, and instrument-specific contract sizes. Supports prop firm calculations and can display position size, entry, and stop levels in the dashboard.
Information Dashboard
A customizable floating table displays:
Current timeframe and HTF
Remaining time in current bar
Current bias direction
Latest confirmed signal details (type, size, entry, stop)
Pending signal status
The dashboard can be repositioned, resized, and styled to match your preferences.
Special Range Creation
When signals confirm, the model can automatically create special range levels from stop prices. These levels persist on the chart as important reference points, even after mitigation, serving as potential reversal zones for future signals.
Label and Visualization Controls
Toggle FVG labels on/off
Toggle confirmation lines on/off
Customizable colors for bullish and bearish FVGs
ERL color customization
SMT line width adjustment
Order Flow Integration (Optional)
The indicator includes optional Open Interest (OI) based special range detection, allowing integration with order flow analysis for enhanced context.
Technical Notes
All components are non-repainting—once formed, they remain on the chart
FVGs cannot be mitigated on their creation bar
Signal-based special ranges persist even after mitigation (important stop levels)
SMT detection supports both HTF and chart timeframe modes
Maximum 50 confirmation lines are maintained for performance
The model is designed to work across all asset classes and timeframes, providing a consistent framework for identifying potential market rotations through the interaction of internal liquidity, correlation breaks, and confirmation signals, this does not constitute as trading advice, past performance is no indication of future performance , this is entirely done for entertainment and educational purposes

DCA Bot v7 - Cryptosa Nostra 1.0Technical Overview: Adaptive RSI DCA Bot
This is a sophisticated DCA (Dollar Cost Averaging) indicator designed for accumulating assets and managing portfolio distribution. It does not trade on simple RSI crosses. Instead, it combines multi-zone RSI analysis with ATR-based volatility triggers to execute staggered, dynamically-sized trades.
Its core feature is a "learning" engine that adapts its own settings over time. This "brain" can be trained on historical data and then applied to your real-time portfolio holdings via a "Live Override" feature.
Core Logic: How It Works
A trade is only executed when two conditions are met simultaneously:
The RSI Condition: The RSI must be inside one of the four pre-defined zones.
The Price Condition: The price must cross a "trigger line" (the green or red line) that is dynamically calculated based on volatility.
1. The Four RSI Zones
This script uses four distinct zones to determine the intent to trade:
Deep Buy Zone (Default: RSI <= 35 & Downtrend): This is the primary "value" buy signal. It only activates if the RSI is deeply oversold and the price is below the 200-period Trend MA.
Reload Buy Zone (Default: RSI 40-50 & Uptrend): This is a "buy the dip" signal. It looks for minor pullbacks during an established uptrend (price above the 200-period Trend MA).
Profit-Taking Zone (Default: RSI 70-80): Triggers a standard, small sell when the market is overbought.
Euphoria Zone (Default: RSI >= 80): Triggers a larger, more aggressive sell during extreme "blow-off" tops.
2. Dynamic Trade Sizing
The amount to buy or sell is not fixed. It scales dynamically based on how high or low the RSI is:
Buy Sizing: Spends a higher percentage of available cash when RSI is at its lowest (e.g., 35) and a smaller percentage when it's at the top of the reload zone (e.g., 50).
Sell Sizing: Sells a smaller percentage of holdings when RSI just enters the overbought zone (e.g., 70) and a much larger percentage when it's in the euphoria zone (e.g., 80+).
3. The "Adaptive Brain" (ATR Multipliers)
This is the script's learning mechanism. The green/red trigger lines are calculated as: Last Trade Price +/- (ATR * Multiplier).
This "Multiplier" is the brain. It adapts based on trade performance.
After a successful trade (as defined by profit_target_multiplier), the bot gets more confident and reduces the multiplier. This places the next trigger line closer to the price, making it more aggressive.
After a losing trade (as defined by loss_limit_multiplier), the bot gets more cautious and increases the multiplier. This places the next trigger line further away, making it more patient.
How to Use This Indicator
This script is designed to be "trained" on historical data to provide relevant signals for today.
To Train the Brain: In the settings, go to "1. Backtest Settings". Set the "Start Date (For Learning)" to a date in the past (e.g., 6 months or 1 year ago). The script will run a simulation from that date, allowing its Adaptive Multipliers (the "brain") to adjust to the market's volatility.
To See Live Signals: In "2. Live Portfolio Override", check the box "Override Backtest Balance?" and enter your real current coin and USD holdings.
Result: The "Live Status" table (top-right) will now display signals from the trained brain but will calculate the "Potential Buy %" and "Potential Sell %" based on your real portfolio. The "Buy Multi" and "Sell Multi" fields show you the brain's current learned values.

Market Extreme Zones IndexThe Market Extreme Zones Index is a new mean reversion (valuation) tool focused on catching long term oversold/overbought zones. Combining an enhanced RSI with a smoothed Z-score this indicator allows traders to find oppurtunities during highly oversold/overbought zones.
I will separate the explanation into the following parts:
1. How does it work?
2. Methodologies & Concepts
3. Use cases
How does it work?
The indicator attempts to catch highly unprobable events in either direction to capture reversal points over the long term. This is done by calculating the Z-Score of an enhanced RSI.
First we need to calculate the Enhanced RSI:
For this we need to calculate 2 additional lengths:
Length1 = user defined length
Length2 = Length1/2
Length3 = √Length
Now we need to calculate 3 different RSIs:
1st RSI => uses classic user defined source and classic user defined length.
2nd RSI => uses classic user defined source and Length 2.
3rd RSI => uses RSI 2 as source and Length 2
Now calculate the divergence:
RSI_base => 2nd RSI * 3 - 1st RSI - 3rd RSI
After this we need to calculate the median of the RSI_base over √Length and make a divergence of these 2:
RSI => RSI_base*2 - median
All that remains now is the Z-score calculations:
We need:
Average RSI value
Standard Deviation = a measure of how dispersed or spread out a set of data values are from their average
Z-score = (Current Value - Average Value) / Standard Deviation
After this we just smooth the Z-score with a Weighted Moving average with √Length
Methodology & Concepts
Mean Reversion Methodology:
The methodology behind mean reversion is the theory that asset prices will eventually return to their long-term average after deviating significantly, driven by the belief that extreme moves are temporary.
Z-Score Methodology:
A Z-score, or standard score, is a statistical measure that indicates how many standard deviations a data point is from the mean of a dataset. A positive z-score means the value is above the mean, a negative score means it's below, and a score of zero means the value is equal to the mean.
You might already be able to see where I am going with this:
Z-Score could be used for the extreme moves to capture reversal points.
By applying it to the RSI rather than the Price, we get a more accurate measurement that allow us to get a banger indicator.
Use Cases
Capturing reversal points
Trend Direction
- while the main use it for mean reversion, the values can indicate whether we are in an uptrend or a downtrend.
Advantages:
Visualization:
The indicator has many plots to ensure users can easily see what the indicator signals, such as highlighting extreme conditions with background colors.
Versatility:
This indicator works across multiple assets, including the S&P500 and more, so it is not only for crypto.
Final note:
No indicator alone is perfect.
Backtests are not indicative of future performance.
Hope you enjoy Gs!
Good luck!

Hedge Simulation Martingale v1
1. Overview & Strategy Logic
This script implements an automated, multi-position trading strategy that uses a Martingale-inspired approach to manage a series of entries. The core logic is as follows:
Initial Entry: The script enters a trade based on the direction of the previous bar's close. A green bar triggers a Long position; a red bar triggers a Short position.
Profit-Taking: A single, fixed-percentage profit target (Profit Percentage) is set for the entire trade. If reached, all positions are closed for a net profit.
Loss Management (Martingale Logic): If the price moves against the initial position and hits the fixed-percentage stop-loss (Loss Percentage), the script does not exit. Instead, it averages down by adding a new, larger position in the same direction. The size of the new position is determined by multiplying the previous position size by the First Multiplier.
Net Position Management: The script continuously calculates the net average entry price, a new combined profit target, and a new combined stop-loss based on all open positions. The goal is for a single favorable price move to recover all previous losses and hit the profit target.
2. Key Features
Visual Indicators:
Plots the Net Average Entry Price on the chart.
Plots dynamic Profit Target (TP) and Stop-Loss (SL) levels that update as new positions are added.
Displays entry signals (triangles) for the initial Long or Short trade.
Comprehensive Dashboard: A detailed table in the top-right corner shows real-time metrics, including:
Total historical Long/Short volume and PnL.
Current trade's investment, unrealized PnL, and position sizes.
Current position count, direction, and size.
Configurable Parameters:
Profit Percentage: The target profit percentage for the net position.
Loss Percentage: The stop-loss percentage that triggers a new entry.
Initial Position Size: The size of the first position in the series.
First Multiplier: The multiplier applied to the previous position size when averaging down.
Maximum Multiplier: A safety cap (commented out in the code but present) to prevent infinite scaling.
3. Intended Use & Purpose
This script is designed as a position management and tracking tool for traders who are experimenting with or actively using Martingale-style strategies. It is best used to:
Automate the complex calculations of average entry, combined TP/SL, and PnL for multiple entries.
Visually track the status of an ongoing series of positions.
Backtest the viability and risks of such a strategy on historical data.
4. ⚠️ Critical Risk Warning & Disclaimer
THIS STRATEGY CARRIES EXTREME FINANCIAL RISK. USE AT YOUR OWN RISK.
Unlimited Loss Potential: The Martingale strategy is infamous for its potential to generate unlimited losses. By continuously doubling down (or multiplying) on losing positions, a small adverse price move can lead to catastrophic losses that can exceed your account balance.
Margin Calls: The rapidly increasing position size can quickly deplete your margin, leading to a margin call and forced liquidation of all positions at a significant loss.
No Guarantee of Recovery: The assumption that the price will eventually reverse is flawed. A strong, sustained trend can wipe out the entire trading capital.
For Educational/Advanced Use Only: This script is intended for sophisticated traders who fully understand the immense risks involved. It is not a "sure profit" system.
The publisher of this script is not responsible for any financial losses incurred through its use. You are solely responsible for your trading decisions and risk management.
5. How to Use
Apply the Script: Add the script to your chart.
Configure Parameters: Adjust the input parameters according to your risk tolerance and strategy rules. Be extremely cautious with the multiplier and position size.
Monitor the Dashboard: The table will provide all necessary information about the current and historical state of the strategy.
Observe the Levels: Watch the plotted Entry, TP, and SL levels to understand the current market position.
Backtest First: Always test the strategy extensively on historical data before considering it with real capital.
6. Notes
The Maximum Multiplier safety feature is present in the code but is currently commented out. Users are strongly advised to uncomment and set this parameter to act as a final, hard liquidation point.
The script logs key events (trade start, target hit) and export data for further analysis.
This is a complex script and should be thoroughly understood before use.

Dual Harmonic-based AHR DCA (Default :BTC-ETH)A panel indicator designed for dual-asset BTC/ETH DCA (Dollar Cost Averaging) decisions.
It is inspired by the Chinese community indicator "AHR999" proposed by “Jiushen”.
How to use:
Lower HM-based AHR → cheaper (potential buy zone).
Higher HM-based AHR → more expensive (potential risk zone).
Higher than Risk Threshold → consider to sell, but not suitable for DCA.
When both AHR lines are below the Risk threshold → buy the cheaper one (or split if similar).
If one AHR is above Risk → buy the other asset.
If both are above Risk → simulation shows “STOP (both risk)”.
Not limited to BTC/ETH — you can freely change symbols in the input panel
to build any dual-asset DCA pair you want (e.g., BTC/BNB, ETH/SOL, etc.).
What you’ll see:
Two lines: AHR BTC (HM) and AHR ETH (HM)
Two dashed lines: OppThreshold (green) and RiskThreshold (red)
Colored fill showing which asset is cheaper (BTC or ETH)
Buy markers:
- B = Buy BTC
- E = Buy ETH
- D = Dual (split budget)
Top-right table: prices, AHRs, thresholds, qOpp/qRisk%, simulation, P&L
Labels showing last-bar AHR values
Core idea:
Use an AHR based on Harmonic Moving Average (HM) — a ratio that measures how “cheap or expensive” price is relative to both its short-term mean and long-term trend.
The original AHR999 used SMA and was designed for BTC only.
This indicator extends it with cross-exchange percentile mapping, allowing the empirical “opportunity/risk” zones of the AHR999 (on Bitstamp) to adapt automatically to the current market pair.
The indicator derives two adaptive thresholds:
OppThreshold – opportunity zone
RiskThreshold – risk zone
These thresholds are compared with the current HM-based AHR of BTC and ETH to decide which asset is cheaper, and whether it is good to DCA or not, or considering to sell(When it in risk area).
This version uses
Display base: Binance (default: perpetual) with HM-based AHR
Percentile base: Bitstamp spot SMA-AHR (complete, stable history)
Rolling window: 2920 daily bars (~8 years) for percentile tracking
Concept summary
AHR measures the ratio of price to its long-term regression and short-term mean.
HM replaces SMA to better reflect equal-fiat-cost DCA behavior.
Cross-exchange percentile mapping (Bitstamp → Binance) keeps thresholds consistent with the original AHR999 interpretation.
Recommended settings (1D):
DCA length (harmonic): 200
Log-regression lookback: 1825 (≈5 years)
Rolling window: 2920 (≈8 years)
Reference thresholds: 0.45 / 1.20 (AHR999 empirical priors)
Tie split tolerance (ΔAHR): 0.05
Daily budget: 15 USDT (simulation)
All display options can be toggled: table, markers, labels, etc.
Notes:
When the rolling window is filled (2920 bars by default), thresholds are first calculated and then visually backfilled as left-extended lines.
The “buy markers” and “decision table” are light simulations without fees or funding costs — for rhythm and relative analysis, not backtesting.

Crypto Futures Basis Tracker (Annualized)🧩 What is Basis Arbitrage
Basis arbitrage is a market-neutral trading strategy that exploits the price difference between a cryptocurrency’s spot and its futures markets.
When futures trade above spot (called contango), traders can buy spot and short futures, locking in a potential yield.
When futures trade below spot (backwardation), the reverse applies — short spot and go long futures.
The yield earned (or cost paid) by holding this position until expiry is called the basis. Expressing it as an annualized percentage allows comparison across different contract maturities.
⚙️ How the Indicator Works
This tool calculates the annualized basis for up to 10 cryptocurrency futures against a chosen spot price.
You select one spot symbol (e.g., BITSTAMP:BTCUSD) and up to 10 futures symbols (e.g., DERIBIT:BTCUSD07X2025, DERIBIT:BTCUSD14X2025, etc.).
The script automatically computes the days-to-expiry (DTE) and the annualized basis for each future.
A table displays for each contract: symbol, expiry date, DTE, last price, and annualized basis (%) — making it easy to compare the forward curve across maturities.
⚠️ Risks and Limitations
While basis arbitrage is often considered low-risk, it’s not risk-free:
Funding and financing costs can erode returns, especially when borrowing or using leverage.
Exchange or counterparty risk — if one leg of the trade fails (e.g., exchange default, margin liquidation), the hedge breaks.
Execution and timing risk — the basis can tighten or invert before both legs are opened.
Liquidity differences — thin futures may have large bid-ask spreads or slippage.
Use this indicator for analysis and monitoring, not as an automated trading signal.
Disclaimer: Please remember that past performance may not be indicative of future results. Due to various factors, including changing market conditions, the strategy may no longer perform as well as in historical backtesting. This post and the script don't provide any financial advice.

Pivots High Low Live DetectionPivots High Low Live Detection
Identifies and visualizes swing highs and lows on the chart in real time.
Helps to observe evolving market structure by connecting confirmed or developing pivot points with lines and labels.
Using a configurable lookback, minimum deviation, and confirmation bar system, the indicator highlights new Higher Highs (HH), Higher Lows (HL), Lower Highs (LH), and Lower Lows (LL) as they form.
When “Live (repainting)” mode is enabled, the current swing leg updates dynamically with each candle, giving immediate feedback as price develops.
When disabled, only confirmed pivots are plotted, ideal for historical validation and backtesting.
+ Key Features
Detects and labels major swing points (HH, HL, LH, LL).
Works in live or confirmed (non-repainting) mode.
Adjustable parameters for lookback, deviation (in ticks), and confirmation bars.
Lightweight and compatible with any timeframe or symbol.
Includes runtime alerts for new structural pivots and direction shifts.
+ How to Use
Adjust the inputs under the “Pivots” group to control sensitivity.
Enable “Live (repainting)” to see developing swing legs, or disable it for confirmed structure only.
Use alerts to track structural changes or potential trend reversals.

Gap & Crap Detector V1Gap & Crap Detector (5% Gap Detector + % Labels)
This indicator automatically detects stocks that gap up ≥ 5% (adjustable) from the previous day’s close and tracks whether the move holds or fails over the next three candles.
🔍 How It Works
Yellow % Label → Appears on every candle that gaps up ≥ 5%, showing the exact percentage gap.
Gap & Go (Green Label) → Triggers when the next 3 candles close above the gap-day low, signaling momentum continuation.
Gap & Crap (Red Label) → Triggers immediately if any of the next 3 candles close below the gap-day low, signaling momentum failure.
⚙️ Inputs & Customization
Gap % Threshold – Default 5% (adjustable)
Label Size – Tiny / Small / Normal / Large / Huge
Opacity Controls – Independently set transparency for yellow, red, and green labels
Gap & Go Offset – Adjust how high above the candle the green label appears
🧠 Usage
Use this tool to identify breakout gaps and verify whether price action confirms (Gap & Go) or fails (Gap & Crap).
Ideal for momentum traders, swing traders, Ovtlyr Plan M, and gap strategy backtesting.

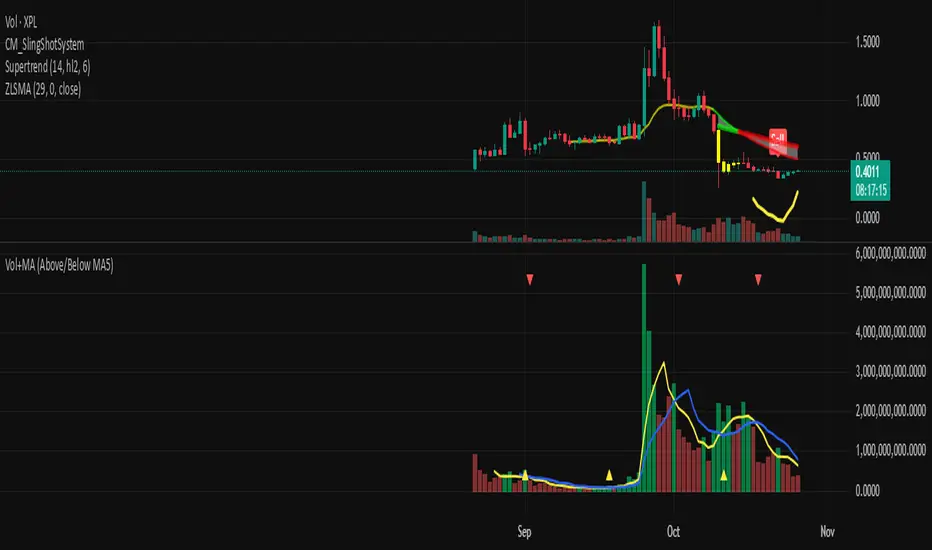
Volume + MA5 & MA10This Volume + MA5 & MA10 (Technical Volume Trend Analysis)
The Volume + MA5 & MA10 indicator provides a precise view of market participation and volume momentum by combining raw volume data with two moving averages (MA5 and MA10). It’s designed for traders who rely on volume-based confirmation to validate price movements, breakouts, and trend reversals.
🔍 Overview
This indicator displays volume bars alongside two smooth volume averages — MA5 (short-term) and MA10 (medium-term) — making it easier to detect shifts in market activity.
When the short-term average crosses above or below the long-term average, it signals a potential change in trading intensity or market sentiment.
⚙️ Key Features
Dual Volume Moving Averages (MA5 & MA10) for short- and medium-term analysis.
Dynamic Bar Coloring based on whether current volume exceeds MA5 or MA10.
Crossover Detection with visual markers for MA5/MA10 intersections.
Alert Conditions to notify you of significant volume trend shifts.
Fully customizable appearance and smoothing options.
📊 How to Interpret
MA5 > MA10 → Increasing short-term volume activity (strengthening momentum).
MA5 < MA10 → Decreasing short-term volume (weakening participation).
Rising volume with price → Confirms trend strength.
Falling volume with rising/falling price → Suggests potential reversal or reduced conviction.
💡 Applications
Confirm breakouts and trend continuations.
Identify momentum divergences between price and volume.
Filter out low-volume or weak-trend setups.
Combine with RSI, MACD, or moving averages for enhanced signal validation.
✅ Advantages
Simple yet powerful structure for clean visual analysis.
Works across all timeframes and markets (crypto, stocks, forex, indices).
No repainting — reliable for both live and historical backtesting.
Use Volume + MA5 & MA10 to strengthen your technical analysis and gain a deeper understanding of how market participation drives price trends.
Holt Damped Forecast [CHE]A Friendly Note on These Pine Script Scripts
Hey there! Just wanted to share a quick, heartfelt heads-up: All these Pine Script examples come straight from my own self-study adventures as a total autodidact—think late nights tinkering and learning on my own. They're purely for educational vibes, helping me (and hopefully you!) get the hang of Pine Script basics, cool indicators, and building simple strategies.
That said, please know this isn't any kind of financial advice, investment nudge, or pro-level trading blueprint. I'd love for you to dive in with your own research, run those backtests like a champ, and maybe bounce ideas off a qualified expert before trying anything in a real trading setup. No guarantees here on performance or spot-on accuracy—trading's got its risks, and those are totally on each of us.
Let's keep it fun and educational—happy coding! 😊
Holt Damped Forecast — Damped trend forecasts with fan bands for uncertainty visualization and momentum integration
Summary
This indicator applies damped exponential smoothing to generate forward price forecasts, displaying them as probabilistic fan bands to highlight potential ranges rather than point estimates. It incorporates residual-based uncertainty to make projections more reliable in varying market conditions, reducing overconfidence in strong trends. Momentum from the trend component is shown in an optional label alongside signals, aiding quick assessment of direction and strength without relying on lagging oscillators.
Motivation: Why this design?
Standard exponential smoothing often extrapolates trends indefinitely, leading to unrealistic forecasts during mean reversion or weakening momentum. This design uses damping to gradually flatten long-term projections, better suiting real markets where trends fade. It addresses the need for visual uncertainty in forecasts, helping traders avoid entries based on overly optimistic point predictions.
What’s different vs. standard approaches?
- Reference baseline: Diverges from basic Holt's linear exponential smoothing, which assumes persistent trends without decay.
- Architecture differences:
- Adds damping to the trend extrapolation for finite-horizon realism.
- Builds fan bands from historical residuals for probabilistic ranges at multiple confidence levels.
- Integrates a dynamic label combining forecast details, scaled momentum, and directional signals.
- Applies tail background coloring to recent bars based on forecast direction for immediate visual cues.
- Practical effect: Charts show converging forecast bands over time, emphasizing shorter horizons where accuracy is higher. This visibly tempers aggressive projections in trends, making it easier to spot when uncertainty widens, which signals potential reversals or consolidation.
How it works (technical)
The indicator maintains two persistent components: a level tracking the current price baseline and a trend capturing directional slope. On each bar, the level updates by blending the current source price with a one-step-ahead expectation from the prior level and damped trend. The trend then adjusts by weighting the change in level against the prior damped trend. Forecasts extend this forward over a user-defined number of steps, with damping ensuring the trend influence diminishes over distance.
Uncertainty derives from the standard deviation of historical residuals—the differences between actual prices and one-step expectations—scaled by the damping structure for the forecast horizon. Bands form around the median forecast at specified confidence intervals using these scaled errors. Initialization seeds the level to the first bar's price and trend to zero, with persistence handling subsequent updates. A security call fetches the last bar index for tail logic, using lookahead to align with realtime but introducing minor repaint on unconfirmed bars.
Parameter Guide
The Source parameter selects the price input for level and residual calculations, defaulting to close; consider using high or low for assets sensitive to volatility, as close works well for most trend-following setups. Forecast Steps (h) defines the number of bars ahead for projections, defaulting to 4—shorter values like 1 to 5 suit intraday trading, while longer ones may widen bands excessively in choppy conditions. The Color Scheme (2025 Trends) option sets the base, up, and down colors for bands, labels, and backgrounds, starting with Ruby Dawn; opt for serene schemes on clean charts or vibrant ones to stand out in dark themes.
Level Smoothing α controls the responsiveness of the price baseline, defaulting to 0.3—values above 0.5 enhance tracking in fast markets but may amplify noise, whereas lower settings filter disturbances better. Trend Smoothing β adjusts sensitivity to slope changes, at 0.1 by default; increasing to 0.2 helps detect emerging shifts quicker, but keeping it low prevents whipsaws in sideways action. Damping φ (0..1) governs trend persistence, defaulting to 0.8—near 0.9 preserves carryover in sustained moves, while closer to 0.5 curbs overextensions more aggressively.
Show Fan Bands (50/75/95) toggles the probabilistic range display, enabled by default; disable it in oscillator panes to reduce clutter, but it's key for overlay forecasts. Residual Window (Bars) sets the length for deviation estimates, at 400 bars initially—100 to 200 works for short timeframes, and 500 or more adds stability over extended histories. Line Width determines the thickness of band and median lines, defaulting to 2; go thicker at 3 to 5 for emphasis on higher timeframes or thinner for layered indicators.
Show Median/Forecast Line reveals the central projection, on by default—hide if bands provide enough detail, or keep for pinpoint entry references. Show Integrated Label activates the combined view of forecast, momentum, and signal, defaulting to true; it's right-aligned for convenience, so turn it off on smaller screens to save space. Show Tail Background colors the last few bars by forecast direction, enabled initially; pair low transparency for subtle hints or higher for bolder emphasis.
Tail Length (Bars) specifies bars to color backward from the current one, at 3 by default—1 to 2 fits scalping, while 5 or more underscores building momentum. Tail Transparency (%) fades the background intensity, starting at 80; 50 to 70 delivers strong signals, and 90 or above allows seamless blending. Include Momentum in Label adds the scaled trend value, defaulting to true—ATR% scaling here offers relative strength context across assets.
Include Long/Short/Neutral Signal in Label displays direction from the trend sign, on by default; neutral helps in ranging markets, though it can be overlooked during strong trends. Scaling normalizes momentum output (raw, ATR-relative, or level-relative), set to ATR% initially—ATR% ensures cross-asset comparability, while %Level provides percentage perspectives. ATR Length defines the period for true range averaging in scaling, at 14; align it with your chart timeframe or shorten for quicker volatility responses.
Decimals sets precision in the momentum label, defaulting to 2—0 to 1 yields clean integers, and 3 or more suits detailed forex views. Show Zero-Cross Markers places arrows at direction changes, enabled by default; keep size small to minimize clutter, with text labels for fast scanning.
Reading & Interpretation
Fan bands expand outward from the current bar, with the median line as the central forecast—narrower bands indicate lower uncertainty, wider suggest caution. Colors tint up (positive forecast vs. prior level) in the scheme's up hue and down otherwise. The optional label lists the horizon, median, and range brackets at 50%, 75%, and 95% levels, followed by momentum (scaled per mode) and signal (Long if positive trend, Short if negative, Neutral if zero). Zero-cross arrows mark trend flips: upward triangle below bar for bullish cross, downward above for bearish. Tail background reinforces the forecast direction on recent bars.
Practical Workflows & Combinations
- Trend following: Enter long on upward zero-cross if median forecast rises above price and bands contain it; confirm with higher highs/lows. Short on downward cross with falling median.
- Exits/Stops: Trail stops below 50% lower band in longs; exit if momentum drifts negative or signal turns neutral. Use wider bands (75/95%) for conservative holds in volatile regimes.
- Multi-asset/Multi-TF: Defaults work across stocks, forex, crypto on 5m-1D; scale steps by TF (e.g., 10+ on daily). Layer with volume or structure tools—avoid over-reliance on isolated crosses.
Behavior, Constraints & Performance
Closed-bar logic ensures stable historical plots, but realtime updates via security lookahead may shift forecasts until bar confirmation, introducing minor repaint on the last bar. No explicit HTF calls beyond bar index fetch, minimizing gaps but watch for low-liquidity assets. Resources include a 2000-bar lookback for residuals and up to 500 labels, with no loops—efficient for most charts. Known limits: Early bars show wide bands due to sparse residuals; assumes stationary errors, so gaps or regime shifts widen inaccuracies.
Sensible Defaults & Quick Tuning
Start with defaults for balanced smoothing on 15m-4H charts. For choppy conditions (too many crosses), lower β to 0.05 and raise residual window to 600 for stability. In trending markets (sluggish signals), increase α/β to 0.4/0.2 and shorten steps to 2. If bands overexpand, boost φ toward 0.95 to preserve trend carry. Tune colors for theme fit without altering logic.
What this indicator is—and isn’t
This is a visualization and signal layer for damped forecasts and momentum, complementing price action analysis. It isn’t a standalone system—pair with risk rules and broader context. Not predictive beyond the horizon; use for confirmation, not blind entries.
Disclaimer
The content provided, including all code and materials, is strictly for educational and informational purposes only. It is not intended as, and should not be interpreted as, financial advice, a recommendation to buy or sell any financial instrument, or an offer of any financial product or service. All strategies, tools, and examples discussed are provided for illustrative purposes to demonstrate coding techniques and the functionality of Pine Script within a trading context.
Any results from strategies or tools provided are hypothetical, and past performance is not indicative of future results. Trading and investing involve high risk, including the potential loss of principal, and may not be suitable for all individuals. Before making any trading decisions, please consult with a qualified financial professional to understand the risks involved.
By using this script, you acknowledge and agree that any trading decisions are made solely at your discretion and risk.
Do not use this indicator on Heikin-Ashi, Renko, Kagi, Point-and-Figure, or Range charts, as these chart types can produce unrealistic results for signal markers and alerts.
Best regards and happy trading
Chervolino

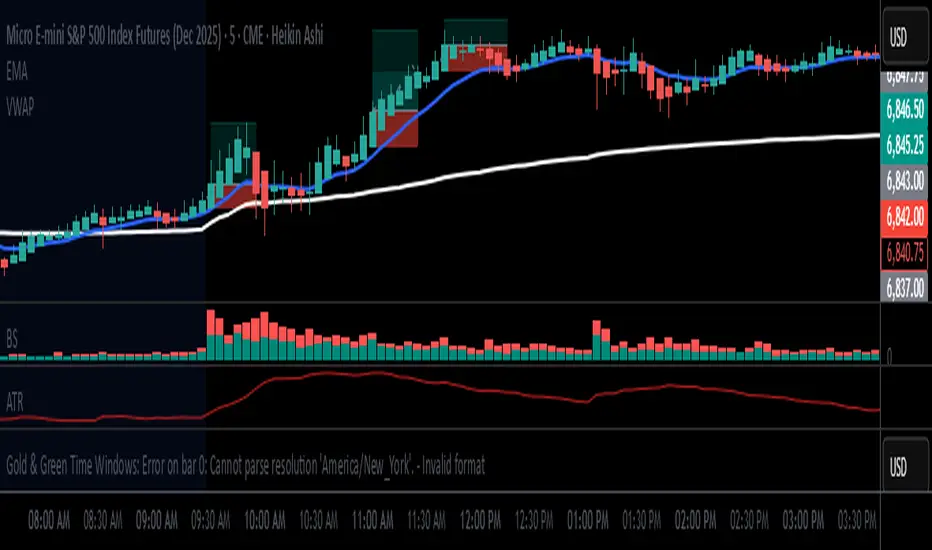
Trend Catch STFR - whipsaw Reduced### Summary of the Setup
This trading system combines **SuperTrend** (a trend-following indicator based on ATR for dynamic support/resistance), **Range Filter** (a smoothed median of the last 100 candles to identify price position relative to a baseline), and filters using **VIX Proxy** (a volatility measure: (14-period ATR / 14-period SMA of Close) × 100) and **ADX** (Average Directional Index for trend strength). It's designed for trend trading with volatility safeguards.
- **Entries**: Triggered only in "tradeable" markets (VIX Proxy ≥ 15 OR ADX ≥ 20) when SuperTrend aligns with direction (green for long, red for short), price crosses the Range Filter median accordingly, and you're not already in that position.
- **Exits**: Purely price-based—exit when SuperTrend flips or price crosses back over the Range Filter median. No forced exits from low volatility/trend.
- **No Trade Zone**: Blocks new entries if both VIX Proxy < 15 AND ADX < 20, but doesn't affect open positions.
- **Overall Goal**: Enter trends with confirmed strength/volatility, ride them via price action, and avoid ranging/choppy markets for new trades.
This creates a filtered trend-following strategy that prioritizes quality entries while letting winners run.
### Advantages
- **Reduces Noise in Entries**: The VIX Proxy and ADX filters ensure trades only in volatile or strongly trending conditions, avoiding low-momentum periods that often lead to false signals.
- **Lets Winners Run**: Exits based solely on price reversal (SuperTrend or Range Filter) allow positions to stay open during temporary lulls in volatility/trend, potentially capturing longer moves.
- **Simple and Balanced**: Combines trend (SuperTrend/ADX), range (Filter), and volatility (VIX Proxy) without overcomplicating—easy to backtest and adapt to assets like stocks, forex, or crypto.
- **Adaptable to Markets**: The "OR" logic for VIX/ADX provides flexibility (e.g., enters volatile sideways markets if ADX is low, or steady trends if VIX is low).
- **Risk Control**: Implicitly limits exposure by blocking entries in calm markets, which can preserve capital during uncertainty.
### Disadvantages
- **Whipsaws in Choppy Markets**: As you noted, SuperTrend can flip frequently in ranging conditions, leading to quick entries/exits and small losses, especially if the Range Filter isn't smoothing enough noise.
- **Missed Opportunities**: Strict filters (e.g., requiring VIX ≥ 15 or ADX ≥ 20) might skip early-stage trends or low-volatility grinds, reducing trade frequency and potential profits in quiet bull/bear markets.
- **Lagging Exits**: Relying only on price flips means you might hold losing trades longer if volatility drops without a clear reversal, increasing drawdowns.
- **Parameter Sensitivity**: Values like VIX 15, ADX 20, or Range Filter's 100-candle lookback need tuning per asset/timeframe; poor choices could amplify whipsaws or over-filter.
- **No Built-in Risk Management**: Lacks explicit stops/targets, so it relies on user-added rules (e.g., ATR-based stops), which could lead to oversized losses if not implemented.
### How to Use It
This system can be implemented in platforms like TradingView (via Pine Script), Python (e.g., with TA-Lib or Pandas), or MT4/5. Here's a step-by-step guide, assuming TradingView for simplicity—adapt as needed. (If coding in Python, use libraries like pandas_ta for indicators.)
1. **Set Up Indicators**:
- Add SuperTrend (default: ATR period 10, multiplier 3—adjust as suggested in prior tweaks).
- Create Range Filter: Use a 100-period SMA of (high + low)/2, smoothed (e.g., via EMA if desired).
- Calculate VIX Proxy: Custom script for (ATR(14) / SMA(close, 14)) * 100.
- Add ADX (period 14, standard).
2. **Define Rules in Code/Script**:
- **Long Entry**: If SuperTrend direction < 0 (green), close > RangeFilterMedian, (VIX Proxy ≥ 15 OR ADX ≥ 20), and not already long—buy on bar close.
- **Short Entry**: If SuperTrend direction > 0 (red), close < RangeFilterMedian, (VIX Proxy ≥ 15 OR ADX ≥ 20), and not already short—sell short.
- **Exit Long**: If in long and (SuperTrend > 0 OR close < RangeFilterMedian)—sell.
- **Exit Short**: If in short and (SuperTrend < 0 OR close > RangeFilterMedian)—cover.
- Monitor No Trade Zone visually (e.g., plot yellow background when VIX < 15 AND ADX < 20).
3. **Backtest and Optimize**:
- Use historical data on your asset (e.g., SPY on 1H chart).
- Test metrics: Win rate, profit factor, max drawdown. Adjust thresholds (e.g., ADX to 25) to reduce whipsaws.
- Forward-test on demo account to validate.
4. **Live Trading**:
- Apply to a chart, set alerts for entries/exits.
- Add risk rules: Position size 1-2% of capital, stop-loss at SuperTrend line.
- Monitor manually or automate via bots—avoid overtrading; use on trending assets.
For the adjustments I suggested earlier (e.g., ADX 25, 2-bar confirmation), integrate them into entries only—test one at a time to isolate improvements. If whipsaws persist, combine 2-3 tweaks.

Curved Radius Supertrend [BOSWaves]Curved Radius Supertrend — Adaptive Parabolic Trend Framework with Dynamic Acceleration Geometry
Overview
The Curved Radius Supertrend introduces an evolution of the classic Supertrend indicator - engineered with a dynamic curvature engine that replaces rigid ATR bands with parabolic, radius-based motion. Traditional Supertrend systems rely on static band displacement, reacting linearly to volatility and often lagging behind emerging price acceleration. The Curved Radius Supertend model redefines this by integrating controlled acceleration and curvature geometry, allowing the trend bands to adapt fluidly to both velocity and duration of price movement.
The result is a smoother, more organic trend flow that visually captures the momentum curve of price action - not just its direction. Instead of sharp pivots or whipsaws, traders experience a structurally curved trajectory that mirrors real market inertia. This makes it particularly effective for identifying sustained directional phases, detecting early trend rotations, and filtering out noise that plagues standard Supertrend methodologies.
Unlike conventional band-following systems, the Curved Radius framework is time-reactive and velocity-aware, providing a nuanced signal structure that blends geometric precision with volatility sensitivity.
Theoretical Foundation
The Curved Radius Supertrend draws from the intersection of mathematical curvature dynamics and adaptive volatility processing. Standard Supertrend algorithms extend from Average True Range (ATR) envelopes - a linear measure of volatility that moves proportionally with price deviation. However, markets do not expand or contract linearly. Trend velocity typically accelerates and decelerates in nonlinear arcs, forming natural parabolas across price phases.
By embedding a radius-based acceleration function, the indicator models this natural behavior. The core variable, radiusStrength, controls how aggressively curvature accelerates over time. Instead of simply following price distance, the band now evolves according to temporal acceleration - each bar contributes incremental velocity, bending the trend line into a radius-like curve.
This structural design allows the indicator to anticipate rather than just respond to price action, capturing momentum transitions as curved accelerations rather than binary flips. In practice, this eliminates the stutter effect typical of standard Supertrends and replaces it with fluid directional motion that better reflects actual trend geometry.
How It Works
The Curved Radius Supertrend is constructed through a multi-stage process designed to balance price responsiveness with geometric stability:
1. Baseline Supertrend Core
The framework begins with a standard ATR-derived upper and lower band calculation. These define the volatility envelope that constrains potential price zones. Directional bias is determined through crossover logic - prices above the lower band confirm an uptrend, while prices below the upper band confirm a downtrend.
2. Curvature Acceleration Engine
Once a trend direction is established, a curvature engine is activated. This system uses radiusStrength as a coefficient to simulate acceleration per bar, incrementally increasing velocity over time. The result is a parabolic displacement from the anchor price (the price level at trend change), creating a curved motion path that dynamically widens or tightens as the trend matures.
Mathematically, this acceleration behaves quadratically - each new bar compounds the previous velocity, forming an exponential rate of displacement that resembles curved inertia.
3. Adaptive Smoothing Layer
After the radius curve is applied, a smoothing stage (defined by the smoothness parameter) uses a simple moving average to regulate curve noise. This ensures visual coherence without sacrificing responsiveness, producing flowing arcs rather than jagged band steps.
4. Directional Visualization and Outer Envelope
Directional state (bullish or bearish) dictates both the color gradient and band displacement. An outer envelope is plotted one ATR beyond the curved band, creating a layered trend visualization that shows the extent of volatility expansion.
5. Signal Events and Alerts
Each directional transition triggers a 'BUY' or 'SELL' signal, clearly labeling phase shifts in market structure. Alerts are built in for automation and backtesting.
Interpretation
The Curved Radius Supertrend reframes how traders visualize and confirm trends. Instead of simply plotting a trailing stop, it maps the dynamic curvature of trend development.
Uptrend Phases : The band curves upward with increasing acceleration, reflecting the market’s growing directional velocity. As curvature steepens, conviction strengthens.
Downtrend Phases : The band bends downward in a mirrored acceleration pattern, indicating sustained bearish momentum.
Trend Change Points : When the direction flips and a new anchor point forms, the curve resets - providing a clean, early visual confirmation of structural reversal.
Smoothing and Radius Interplay : A lower radius strength produces a tighter, more reactive curve ideal for scalping or short timeframes. Higher values generate broad, sweeping arcs optimized for swing or positional analysis.
Visually, this curvature system translates market inertia into shape - revealing how trends bend, accelerate, and ultimately exhaust.
Strategy Integration
The Curved Radius Supertrend is versatile enough to integrate seamlessly into multiple trading frameworks:
Trend Following : Use BUY/SELL flips to identify emerging directional bias. Strong curvature continuation confirms sustained momentum.
Momentum Entry Filtering : Combine with oscillators or volume tools to filter entries only when the curve slope accelerates (high momentum conditions).
Pullback and Re-entry Timing : The smooth curvature of the radius band allows traders to identify shallow retracements without premature exits. The band acts as a dynamic, self-adjusting support/resistance arc.
Volatility Compression and Expansion : Flattening curvature indicates volatility compression - a potential pre-breakout zone. Rapid re-steepening signals expansion and directional conviction.
Stop Placement Framework : The curved band can serve as a volatility-adjusted trailing stop. Because the curve reflects acceleration, it adapts naturally to market rhythm - widening during momentum surges and tightening during stagnation.
Technical Implementation Details
Curved Radius Engine : Parabolic acceleration algorithm that applies quadratic velocity based on bar count and radiusStrength.
Anchor Logic : Resets curvature at each trend change, establishing a new reference base for directional acceleration.
Smoothing Layer : SMA-based curve smoothing for noise reduction.
Outer Envelope : ATR-derived band offset visualizing volatility extension.
Directional Coloring : Candle and band coloration tied to current trend state.
Signal Engine : Built-in BUY/SELL markers and alert conditions for automation or script integration.
Optimal Application Parameters
Timeframe Guidance :
1-5 min (Scalping) : 0.08–0.12 radius strength, minimal smoothing for rapid responsiveness.
15 min : 0.12–0.15 radius strength for intraday trends.
1H : 0.15–0.18 radius strength for structured short-term swing setups.
4H : 0.18–0.22 radius strength for macro-trend shaping.
Daily : 0.20–0.25 radius strength for broad directional curves.
Weekly : 0.25–0.30 radius strength for smooth macro-level cycles.
The suggested radius strength ranges provide general structural guidance. Optimal values may vary across assets and volatility regimes, and should be refined through empirical testing to account for instrument-specific behavior and prevailing market conditions.
Asset Guidance :
Cryptocurrency : Higher radius and multiplier values to stabilize high-volatility environments.
Forex : Midrange settings (0.12-0.18) for clean curvature transitions.
Equities : Balanced curvature for trending sectors or momentum rotation setups.
Indices/Futures : Moderate radius values (0.15-0.22) to capture cyclical macro swings.
Performance Characteristics
High Effectiveness :
Trending environments with directional expansion.
Markets exhibiting clean momentum arcs and low structural noise.
Reduced Effectiveness :
Range-bound or low-volatility conditions with repeated false flips.
Ultra-short-term timeframes (<1m) where curvature acceleration overshoots.
Integration Guidelines
Confluence Framework : Combine with structure tools (order blocks, BOS, liquidity zones) for entry validation.
Risk Management : Trail stops along the curved band rather than fixed points to align with adaptive market geometry.
Multi-Timeframe Confirmation : Use higher timeframe curvature as a trend filter and lower timeframe curvature for execution timing.
Curve Compression Awareness : Treat flattening arcs as potential exhaustion zones - ideal for scaling out or reducing exposure.
Disclaimer
The Curved Radius Supertrend is a geometric trend model designed for professional traders and analysts. It is not a predictive system or a guaranteed profit method. Its performance depends on correct parameter calibration and sound risk management. BOSWaves recommends using it as part of a comprehensive analytical framework, incorporating volume, liquidity, and structural context to validate directional signals.

Relative Strength Index Remastered [CHE]Relative Strength Index Remastered — Enhanced RSI with robust divergence detection using price-based pivots and line-of-sight validation to reduce false signals compared to the standard RSI indicator.
Summary
RSI Remastered builds on the classic Relative Strength Index by adding a more reliable divergence detection system that relies on price pivots rather than RSI pivots alone, incorporating a line-of-sight check to ensure the RSI path between points remains clear. This approach filters out many false divergences that occur in the original RSI indicator due to its volatile pivot detection on the RSI line itself. Users benefit from clearer reversal and continuation signals, especially in noisy markets, with optional hidden divergence support for trend confirmation. The core RSI calculation and smoothing options remain familiar, but the divergence logic provides materially fewer alerts while maintaining sensitivity.
Motivation: Why this design?
The standard RSI indicator often generates misleading divergence signals because it detects pivots directly on the RSI values, which can fluctuate erratically in volatile conditions, leading to frequent false positives that confuse traders during ranging or choppy price action. RSI Remastered addresses this by shifting pivot detection to the underlying price highs and lows, which are more stable, and adding a validation step that confirms the RSI line does not cross the direct path between pivot points. This design targets the real problem of over-signaling in the original, promoting more actionable insights without altering the RSI's core momentum measurement.
What’s different vs. standard approaches?
- Reference baseline: The classical TradingView RSI indicator, which uses simple RSI-based pivot detection for divergences.
- Architecture differences:
- Pivot identification on price extremes (highs and lows) instead of RSI values, extracting RSI levels at those points for comparison.
- Addition of a line-of-sight validation that checks the RSI path bar by bar between pivots to prevent signals where the line is interrupted.
- Inclusion of hidden divergence types alongside regular ones, using the same robust framework.
- Configurable drawing of connecting lines between validated pivot RSI points for visual clarity.
- Practical effect: Charts show fewer but higher-quality divergence markers and lines, reducing clutter from the original's frequent RSI pivot triggers; this matters for avoiding whipsaws in intraday trading, where the standard version might flag dozens of invalid setups per session.
Key Comparison Aspects
Aspect: Title/Shorttitle
Original RSI: "Relative Strength Index" / "RSI"
Robust Variant: "Relative Strength Index Remastered " / "RSI RM"
Aspect: Max. Lines/Labels
Original RSI: No specification (Standard: 50/50)
Robust Variant: max_lines_count=200, max_labels_count=200 (for more lines/markers in divergences)
Aspect: RSI Calculation & Plots
Original RSI: Identical: RSI with RMA, Plots (line, bands, gradient fills)
Robust Variant: Identical: RSI with RMA, Plots (line, bands, gradient fills)
Aspect: Smoothing (MA)
Original RSI: Identical: Inputs for MA types (SMA, EMA etc.), Bollinger Bands optional
Robust Variant: Identical: Inputs for MA types (SMA, EMA etc.), Bollinger Bands optional
Aspect: Divergence Activation
Original RSI: input.bool(false, "Calculate Divergence") (disabled by default)
Robust Variant: input.bool(true, "Calculate Divergence") (enabled by default, with tooltip)
Aspect: Pivot Calculation
Original RSI: Pivots on RSI (ta.pivotlow/high on RSI values)
Robust Variant: Pivots on price (ta.pivotlow/high on low/high), RSI values then extracted
Aspect: Lookback Values
Original RSI: Fixed: lookbackLeft=5, lookbackRight=5
Robust Variant: Input: L=5 (Pivot Left), R=5 (Pivot Right), adjustable (min=1, max=50)
Aspect: Range Between Pivots
Original RSI: Fixed: rangeUpper=60, rangeLower=5 (via _inRange function)
Robust Variant: Input: rangeUpper=60 (Max Bars), rangeLower=5 (Min Bars), adjustable (min=1–6, max=100–300)
Aspect: Divergence Types
Original RSI: Only Regular Bullish/Bearish: - Bull: Price LL + RSI HL - Bear: Price HH + RSI LH
Robust Variant: Regular + Hidden (optional via showHidden=true): - Regular Bull: Price LL + RSI HL - Regular Bear: Price HH + RSI LH - Hidden Bull: Price HL + RSI LL - Hidden Bear: Price LH + RSI HH
Aspect: Validation
Original RSI: No additional check (only pivot + range check)
Robust Variant: Line-of-Sight Check: RSI line must not cross the connecting line between pivots (line_clear function with slope calculation and loop for each bar in between)
Aspect: Signals (Plots/Shapes)
Original RSI: - Plot of pivot points (if divergence) - Shapes: "Bull"/"Bear" at RSI value, offset=-5
Robust Variant: - No pivot plots, instead shapes at RSI , offset=-R (adjustable) - Shapes: "Bull"/"Bear" (Regular), "HBull"/"HBear" (Hidden) - Colors: Lime/Red (Regular), Teal/Orange (Hidden)
Aspect: Line Drawing
Original RSI: No lines
Robust Variant: Optional (showLines=true): Lines between RSI pivots (thick for regular, dashed/thin for hidden), extend=none
Aspect: Alerts
Original RSI: Only Regular Bullish/Bearish (with pivot lookback reference)
Robust Variant: Regular Bullish/Bearish + Hidden Bullish/Bearish (specific "at latest pivot low/high")
Aspect: Robustness
Original RSI: Simple, prone to false signals (RSI pivots can be volatile)
Robust Variant: Higher: Price pivots are more stable, line-of-sight filters "broken" divergences, hidden support for trend continuations
Aspect: Code Length/Structure
Original RSI: ~100 lines, simple if-blocks for bull/bear
Robust Variant: ~150 lines, extended helper functions (e.g., inRange, line_clear), var group for inputs
How it works (technical)
The indicator first computes the core RSI value based on recent price changes, separating upward and downward movements over the specified length and smoothing them to derive a momentum reading scaled between zero and one hundred. This value is then plotted in a separate pane with fixed upper and lower reference lines at seventy and thirty, along with optional gradient fills to highlight overbought and oversold zones.
For smoothing, a moving average type is applied to the RSI if enabled, with an option to add bands around it based on the variability of recent RSI values scaled by a multiplier. Divergence detection activates on confirmed price pivots: lows for bullish checks and highs for bearish. At each new pivot, the system retrieves the bar index and values (price and RSI) for the current and prior pivot, ensuring they fall within a configurable bar range to avoid unrelated points.
Comparisons then assess whether the price has made a lower low (or higher high) while the RSI at those points moves in the opposite direction—higher for bullish regular, lower for bearish regular. For hidden types, the directions reverse to capture trend strength. The line-of-sight check calculates the straight path between the two RSI points and verifies that the actual RSI values in between stay entirely above (for bullish) or below (for bearish) that path, breaking the signal if any bar violates it. Valid signals trigger shapes at the RSI level of the new pivot and optional lines connecting the points. Initialization uses built-in functions to track prior occurrences, with states persisting across bars for accurate historical comparisons. No higher timeframe data is used, so confirmation occurs after the right pivot bars close, minimizing live-bar repaints.
Parameter Guide
Length — Controls the period for measuring price momentum changes — Default: 14 — Trade-offs/Tips: Shorter values increase responsiveness but add noise and more false signals; longer smooths trends but delays entries in fast markets.
Source — Selects the price input for RSI calculation — Default: Close — Trade-offs/Tips: Use high or low for volatility focus, but close works best for most assets; mismatches can skew overbought/oversold reads.
Calculate Divergence — Enables the enhanced divergence logic — Default: True — Trade-offs/Tips: Disable for pure RSI view to save computation; essential for signal reliability over the standard method.
Type (Smoothing) — Chooses the moving average applied to RSI — Default: SMA — Trade-offs/Tips: None for raw RSI; EMA for quicker adaptation, but SMA reduces whipsaws; Bollinger Bands option adds volatility context at cost of added lines.
Length (Smoothing) — Period for the smoothing average — Default: 14 — Trade-offs/Tips: Match RSI length for consistency; shorter boosts signal speed but amplifies noise in the smoothed line.
BB StdDev — Multiplier for band width around smoothed RSI — Default: 2.0 — Trade-offs/Tips: Lower narrows bands for tighter signals, risking more touches; higher widens for fewer but stronger breakouts.
Pivot Left — Bars to the left for confirming price pivots — Default: 5 — Trade-offs/Tips: Increase for stricter pivots in noisy data, reducing signals; too high delays confirmation excessively.
Pivot Right — Bars to the right for confirming price pivots — Default: 5 — Trade-offs/Tips: Balances with left for symmetry; longer right ensures maturity but shifts signals backward.
Max Bars Between Pivots — Upper limit on distance for valid pivot pairs — Default: 60 — Trade-offs/Tips: Tighten for short-term trades to focus recent action; widen for swing setups but risks unrelated comparisons.
Min Bars Between Pivots — Lower limit to avoid clustered pivots — Default: 5 — Trade-offs/Tips: Raise to filter micro-moves; too low invites overlapping signals like the original RSI.
Detect Hidden — Includes trend-continuation hidden types — Default: True — Trade-offs/Tips: Enable for full trend analysis; disable simplifies to reversals only, akin to basic RSI.
Draw Lines — Shows connecting lines between valid pivots — Default: True — Trade-offs/Tips: Turn off for cleaner charts; helps visually confirm line-of-sight in backtests.
Reading & Interpretation
The main RSI line oscillates between zero and one hundred, crossing above fifty suggesting building momentum and below indicating weakness; touches near seventy or thirty flag potential extremes. The optional smoothed line and bands provide a filtered view—price above the upper band on the RSI pane hints at overextension. Divergence shapes appear as upward labels for bullish (lime for regular, teal for hidden) and downward for bearish (red regular, orange hidden) at the pivot's RSI level, signaling a mismatch only after validation. Connecting lines, if drawn, slope between points without RSI interference, their color matching the shape type; a dashed style denotes hidden. Fewer shapes overall compared to the standard RSI mean higher conviction, but always confirm with price structure.
Practical Workflows & Combinations
- Trend following: Enter longs on regular bullish shapes near support with higher highs in price; filter hidden bullish for pullback buys in uptrends, pairing with a rising smoothed RSI above fifty.
- Exits/Stops: Use bearish regular as reversal warnings to tighten stops; hidden bearish in downtrends confirms continuation—exit if lines show RSI crossing the path.
- Multi-asset/Multi-TF: Defaults suit forex and stocks on one-hour charts; for crypto volatility, widen pivot ranges to ten; scale min/max bars proportionally on daily for swings, avoiding the original's intraday spam.
Behavior, Constraints & Performance
Signals confirm only after the right pivot bars close, so live bars may show tentative pivots that vanish on close, unlike the standard RSI's immediate RSI-pivot triggers—plan for this delay in automation. No higher timeframe calls, so no security-related repaints. Resources include up to two hundred lines and labels for dense charts, with a loop in validation scanning up to three hundred bars between pivots, which is efficient but could slow on very long histories. Known limits: Slight lag at pivot confirmation in trending markets; volatile RSI might rarely miss fine path violations; not ideal for gap-heavy assets where pivots skip.
Sensible Defaults & Quick Tuning
Start with defaults for balanced momentum and divergence on most timeframes. For too many signals (like the original), raise pivot left/right to eight and min bars to ten to filter noise. If sluggish in trends, shorten RSI length to nine and enable EMA smoothing for faster adaptation. In high-volatility assets, widen max bars to one hundred but disable hidden to focus essentials. For clean reversal hunts, set smoothing to none and lines on.
What this indicator is—and isn’t
RSI Remastered serves as a refined momentum and divergence visualization tool, enhancing the standard RSI for better signal quality in technical analysis setups. It is not a standalone trading system, nor does it predict price moves—pair it with volume, structure breaks, and risk rules for decisions. Use alongside position sizing and broader context, not in isolation.
Disclaimer
The content provided, including all code and materials, is strictly for educational and informational purposes only. It is not intended as, and should not be interpreted as, financial advice, a recommendation to buy or sell any financial instrument, or an offer of any financial product or service. All strategies, tools, and examples discussed are provided for illustrative purposes to demonstrate coding techniques and the functionality of Pine Script within a trading context.
Any results from strategies or tools provided are hypothetical, and past performance is not indicative of future results. Trading and investing involve high risk, including the potential loss of principal, and may not be suitable for all individuals. Before making any trading decisions, please consult with a qualified financial professional to understand the risks involved.
By using this script, you acknowledge and agree that any trading decisions are made solely at your discretion and risk.
Do not use this indicator on Heikin-Ashi, Renko, Kagi, Point-and-Figure, or Range charts, as these chart types can produce unrealistic results for signal markers and alerts.
Best regards and happy trading
Chervolino
