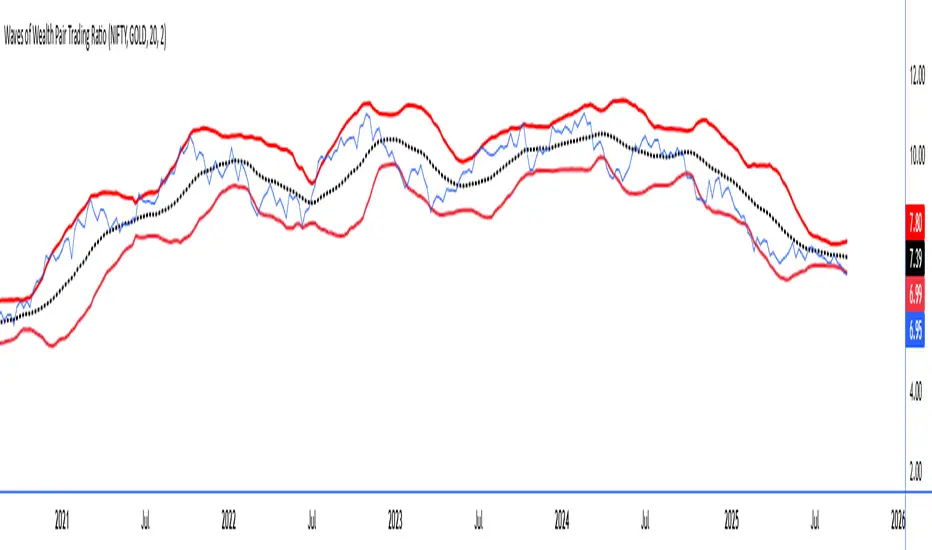
TCG AI ToolsIntroduction:
This script is a result of an AI recommended created trading strategy that is design to offer new traders’ easy access to trend information and oversold/overbought conditions. Here we have combined commonly used indicators into a single unique visualization that quickly identifies trend changes and both RSI and Bollinger Band based overbought and oversold conditions, and allows all three indicators to be used simultaneously while taking up limited space on the chart.
The value in combining these three indicators is found in the harmony and clarity they are able to provide new traders. Trend changes can be difficult to identify based solely on candlestick analysis, therefore using the moving averages allows the trader to simplify the process of establishing bullish or bearish trends. Once a trend is established it can be very attractive for new traders to establish entries at the wrong time. For this reason, it is useful to include two different overbought and oversold indicators. The Bollinger Bands are included as one of the methods for establishing extreme prices that often result in reversals, and the relative strength index is similarly utilized as a second means to warn traders of extreme conditions.
Using the Indicator
1. MA10 MA20 Trend Indicator
The large red/green horizontal bar located at the 0 line on the X axis is the trend direction indicator. This visualization compares the 10 and 20 period moving averages to establish trend. When the MA10 is above the MA20 the trend is considered bullish and supportive of long positions and indicates such by changing the color of the horizontal bar to green. When the MA10 is below MA20 the trend is considered bearish and indicates such by changing the color of the horizontal bar to red. Color changes occur at the moment of a MA crossover/under.
2. Relative Strength Index.
The vertical red and green bars that make up the background of the panel indicate conditions wherein the RSI is considered overbought or oversold. When the vertical bar is red it indicates that RSI is below 30 suggesting that current conditions are oversold and supportive of long entries. When the vertical bar is green it suggests that the current conditions are overbought and are supportive of short entries.
3. Bollinger Band Extremes
Within the horizontal red/green bar there are red and green arrows. These arrows represent periods where the price is exceeding the upper or lower Bollinger bands and indicate overbought/oversold conditions. When a green arrow appears, it indicates that the price has crossed below the lower BB and is supportive of long entries. If a red arrow appears it indicates that the price has crossed above the upper Bollinger band and conditions are supportive of short entries.
Cerca negli script per "bands"
Global Net Liquidity - SPX Fair ValueThis is similar to the SPX Fair Value Bands indicator.
It currently only displays the fair value.
The original SPX Fair Value formula only includes the Fed balance sheet data.
This indicator incorporates the following central bank assets:
Fed
Japan
China
UK
ECB
This is currently experimental. Feel free to explore using different formula constants.
LNL Keltner CandlesLNL Keltner Candles
This indicator plots mean reversion (reversal) arrows with custom painted candles based on the price touch or close above or below keltner channel limits (upper & lower bands). This study was created primarily for swing trading & higher time frames such as daily and weekly. Lower time frames might result in more false signals.
Mean Reversal Arrows:
1. Reversal Arrow Up - If the price drops below the lower band extremes, reversal up is the trigger for a bullish mean reversion.
2. Reversal Arrow Down - Once the price reach the higher band extremes, reversal down is the trigger for a bearish mean reversion.
The Concept of Mean Reversion:
There are just two types of moves in any market: The market is either expanding from the mean or retracing back to the mean. These reversions & epxansions are happening across all types of markets. The goal of this study is to catch the powerful mean reversion from extremes back to the mean. Once the candles light up green / red, it is time to look for the reversal (purple) arrow which triggers the mean reversion setup. Mean reversion is not about catching the next big swing turn to new highs or lows. It is all about the base hits = the mean. So the target here is always the average price. The idea here is to catch the average market ebbs & flows, not the next home run.
What Do I Mean by Mean?
Mean is usually the average price from the last 20-30 bars. Basically something like a 20 MA or Keltner Channel or Bollinger Band midline are really good visual representators of the mean (average price).
Hope it helps.
Fibonacci Breakout Target LevelsFibonacci Extension
Fibonacci Extension is a powerful technical analysis tool that traders use to predict where the market might find support and resistance. It is based on the Fibonacci sequence and uses levels that are found by extending the 23.6%, 38.2%, 50%, 61.8%, and 100% Fibonacci ratios from a swing high or low. These levels can be used to find possible areas of support and resistance, and traders often use them to figure out when to get into or get out of a trade.
What does this indicator do?
This indicator gets five levels of the Fibonacci Extension and uses it for both the low and the high. The default lookback period is 10 days, and it checks for the highest and lowest price in that period. Then it calculates the extension levels and plots them, and it also adds a line that shows you the current breakout target levels.
How to use?
The primary use intended for this indicator is to be used to determine possible breakout target levels. Let's say you are trading a range and a breakout happens. You can use this indicator to determine possible take-profit zones and possible support and resistance zones.
Features:
Change the lookback period for the Fibonacci Extension levels.
Disable the Fibonacci Bands if you just want to see the FIB levels.
You can also change the 5 levels and add different Fibonacci numbers.
In this image, you can see how you can use this indicator to determine take-profit levels. The Fibonacci Extensions will determine potential support and resistance levels, which could be good places to exit your long or short positions.
Click VWAP Anchored with Standard Devation BandsSimply use it by clicking on your chart on the places you find important to determine whether you entries or exits look strong or weak.
Volume Weighted Exponential Moving Average Suite (VWEMA)This is a volume weighted exponential moving average (EMA) script that allows users to customize various parameters to fit their specific needs.
The script includes four different EMA styles: EMA, DEMA, TEMA, and EHMA. Users can choose which style they would like to use by selecting it in the input field. The script also allows users to customize the length of the EMA, with options for both a maximum and minimum length. Users can also choose to use a manual length or to use the dominant cycle within a range as the length.
In addition to these options, the script also includes the ability to turn on or off volume weighting and a daily reset feature that resets the EMA every day. There is also an option to turn on deviation bands, which show the standard deviation of the selected EMA.
Overall, this script offers a wide range of customization options to help users find the best EMA settings for their needs. It is an advanced tool that can be very helpful for traders looking to optimize their EMA strategy.
Cumulative length instead of cycle length
Double EMA Volume Weighted
Triple EMA Volume Weighted
EHMA Volume Weighted
Higher time frame
Deviation Bands
Nadaraya-Watson non repainting [LPWN]// ENGLISH
The problem of the wonderfuls Nadaraya-Watson indicators is that they repainting, @jdehorty made an aproximation of the Nadaraya-Watson Estimator using raational Quadratic Kernel so i used this indicator as inspiration i just added the Upper and lower band using ATR with this we get an aproximation of Nadaraya-Watson Envelope without repainting
Settings:
Bandwidth. This is the number of bars that the indicator will use as a lookback window.
Relative Weighting Parameter. The alpha parameter for the Rational Quadratic Kernel function. This is a hyperparameter that controls the smoothness of the curve. A lower value of alpha will result in a smoother, more stretched-out curve, while a lower value will result in a more wiggly curve with a tighter fit to the data. As this parameter approaches 0, the longer time frames will exert more influence on the estimation, and as it approaches infinity, the curve will become identical to the one produced by the Gaussian Kernel.
Color Smoothing. Toggles the mechanism for coloring the estimation plot between rate of change and cross over modes.
ATR Period. Period to calculate the ATR (upper and lower bands)
Multiplier. Separation of the bands
// SPANISH
El problema de los maravillosos indicadores de Nadaraya-Watson es que repintan, @jdehorty hizo una aproximación delNadaraya-Watson Estimator usando un Kernel cuadrático racional, así que usé este indicador como inspiración y solo agregamos la banda superior e inferior usando ATR con esto obtenemos una aproximación de Nadaraya-Watson Envelope sin volver a pintar
Configuración:
Banda ancha. Este es el número de barras que el indicador utilizará como ventana retrospectiva.
Parámetro de ponderación relativa. El parámetro alfa para la función Rational Quadratic Kernel. Este es un hiperparámetro que controla la suavidad de la curva. Un valor más bajo de alfa dará como resultado una curva más suave y estirada, mientras que un valor más bajo dará como resultado una curva más ondulada con un ajuste más ajustado a los datos. A medida que este parámetro se acerque a 0, los marcos de tiempo más largos ejercerán más influencia en la estimación y, a medida que se acerque al infinito, la curva será idéntica a la que produce el Gaussian Kernel.
Suavizado de color. Alterna el mecanismo para colorear el gráfico de estimación entre la tasa de cambio y los modos cruzados.
Período ATR. Periodo para calcular el ATR (bandas superior e inferior)
Multiplicador. Separación de las bandas
Range Detector Indicator [Misu]█ This indicator shows an upper and lower band based on Highs and Lows.
Depending on this, the indicator interprets a ranging market, an uptrend or a downtrend.
█ Usages:
The purpose of this indicator is to identify when the price is ranging.
It's also used to identify changes in trends, breaking points, and trend reversals.
But it can also be used to show resistance or support levels.
█ Features:
> Price Action Change Alerts
> Price Action Change Labels
> Color Bars
> Show Bands
█ Parameters:
Deviation: A parameter used to calculate pivots.
Depth: A parameter used to calculate pivots.
Activate Range Detection: Check the box to activate range detection.
Band% Offset: A factor that is used to vary the bands offset.
DB KCBB%D WavesDB KCBB%D Waves
What does the indicator do?
The indicator plots the percent difference between the low and high prices against a combined Kelpler Channel Bollinger Bands for the current timeframe. The low percent difference and the high percent difference each have their own waves plotted. A mirror mode default allows both waves to be visualized in a mirrored plot that clearly shows when outer bands are present and when they swap. Each percent difference band is displayed with a 1 bar lookback to visualize local tops/bottoms.
The overall trend is displayed using two sets of green/red colors on the percent difference waves so that each wave is recognizable, but the overall price trend is visible. A fast 3 SMA is taken of each percent difference wave to obtain the overall trend and then averaged together. The trend is then calculated based on direction from the previous bar period.
How should this indicator be used?
By default, the indicator will display in a mirror mode which will display both the low and high percent change waves mirrored to allow for the most pattern recognition possible. You will notice the percent difference waves swap from inner to outer, showing the overall market direction for that timeframe. When each percent difference wave interacts with the zero line, it indicates either buys or sells opportunities depending on which band is on the inside. When the inner wave crosses zero, special attention should be paid to the outer wave to know if it's a significant move. Likewise, when the outer wave peaks, it can indicate buy or sell opportunities depending on which wave is on the outside.
A zero line and other lines are displayed from the highest of the high percent difference wave over a long period of time. The lines can measure movement and possible oversold/overbought locations or large volatility. You can also use the lines for crossing points for either wave as alerts to know when to buy or sell zones are happening.
When individual percent difference waves are designed to be reviewed without mirroring, the mirror checkbox can be unchecked in the settings. Doing so will display both the high and low percent difference waves separately. Using this display, you can more cleanly review how each wave interacts with various line levels.
For those who desire to only have half of the mirror or one set of waves inverted against each other, check the "mirrored" and the "mirrored flipped" checkboxes in the settings. Doing so will display the top half of the mirror indicator, which is the low percent difference wave with the high percent difference wave inverted.
The indicator will also change the background color of its own pane to indicate possible buy/sell periods (work in progress).
Does the indicator include any alerts?
Yes, they are a work in progress but starting out with this release, we have:
NOTE: This is an initial release version of this indicator. Please do not use these alerts with bots yet, as they will repaint in real-time.
NOTE: A later release may happen that will delay firing the events until 1/2 of the current bar time has passed.
NOTE: As with any indicator watch your upper timeframe waves first before zooming into lower.
DB KCBB%D Buy Zone Alert
DB KCBB%D MEDIUM Buy Alert
DB KCBB%D STRONG Buy Alert
DB KCBB%D Sell Alert
DB KCBB%D STRONG Sell Alert
DB KCBB%D Trend Up Alert
DB KCBB%D Trend Down Alert
Use at your own risk and do your own diligence.
Enjoy!
Variety-Filtered, Squeeze Moving Averages [Loxx]Variety-Filtered, Squeeze Moving Averages is a chop zone indicator that identifies when price is below a specific volatility threshold calculated as the difference between a fast and slow moving average and filtered using ATR- or Pips-based threshold. This indicator can be use as both an entry and exit indicator. It identifies both chop zones and breakouts/breakdowns
How to use
When the candles turn white and the threshold bands appear on the chart, this is indicative of low volatility
When price exits the threshold bands, price will usually explode up or down giving a long or short signal. This acts as a sort of squeeze momentum.
Included:
Bar coloring
Signals
Alerts, 4 types of alerts: Squeeze started, Squeeze ended, long, and short
Loxx's Expanded Source Types
35+ Loxx's Moving Averages
God Number Channel v2(GNC v2)GNC got a little update:
1) Logic changed a bit.
I tried to calculate MAs based on the power(high - low of previous bars).You can see it the M-variables, as new statements were added in calculation section of MAs. I don't really know if I did right, because I didn't go too much in Pine Script. I just wanted to make a Bollinger-bands-like bands, which could predict the levels at which might reverse, using legendary fibonacci and Tesla's harmonic number 432. It's might sound as a joke, but as you can see, it works pretty good.
2) Customization :
No need to change Fibonacci ratios in code. Now you can do it in the GNC settings. Also MAs' names were made obvious, just check it out. Time of million similar "MA n1" has passed :)
3) Trade-entry advices :
I didn't tell you exactly the trade-entry advices, as I haven't explored this script fully yet :) But you probably understood something intuitively, when added GNC on the chart. Now I made things way more obvious:
1. Zones between Fib ratios show you how aware you should be of price movements. Basically, here are the rules, but you probably understand them already:
1.1 Red zone(RZ) : high awareness, very likly for price to be reversed, but if there is a clear trend and you know, than it might be a time for price to shoot up/down.
1.2 Orange zone(OZ) : medium awareness, not so obvious, as price might go between boundaries of OZ and continue the trend movement if such followed before entering the OZ. If price go below lower boundary of OZ and the next bar opens below this boundary, it might be a signal for SHORY, BUT(!) please consider confirmation of any sort to be more sure. Think of going beyond the upper boundary by analogy.
1.3 Green Zone(GZ) : if the price hits any boundary of green zone, it is usually a good oppurtunity to open a position against the movement(hit lower boundary -> open LONG, hit upper boundary -> open SHORT).
1.4 Middle Zone(Harmonic Zone)(MZ) : same rules from Green Zone.
IMPORTANT RECCOMENDATION : Use trend indicator to trend all signals from zones to follow the trend, 'cause counter-trending with this thing without stop loss might very quickly wipe you out , might if you will counter-trend strategy with GNC, I will be glad if you share it with the community :)
Reccomendation for better entries :
1) if the price hits the lower(or high) boundaries(LB or HB) zone after zone(hit LB or HB of RZ, then of OZ, then of GZ), it is a very good signal to either LONG, if price was hitting LBs , or SHORT, if hitting HBs .
2) Consider NOT to place trades when in MZ, as price in this zone gets tricky often enough. By the way, if you dont the see the harmonic MAs(which go with plot(ma1+(0.432*avg1)) ), then set the transparency of zone to 20% or a bit more and then it will be ok.
I will continue to develop the GNC and any help or feedback from you, guys, will be very helpful for me, so you welcome for any of those, but please be precise in your critics.
Thank you for using my stuff, hope you found it usefull. Good luck :)
Rollin' pseudo-Bollinger Bands 5 linear regression curves and new highs/lows mixed together from the basis for this indicator. Using slightly different logic an upper boundary and lower boundary are formed. Then the boundary's are built upon to show price channels within the band using variations of fib levels and the distance between the initial boundary's. Dots plotted show the inverse of the close price relative to either the upper or lower boundary depending on where the close is relative to the center of the band. This shows the market's tendency for symmetry which is useful when looking for reversals etc. If it's too cluttered feel free to turn off some things in the options and keep what you feel is helpful.
TL WavesI created this indicator inspired by the miyuki waves indicator by eto_miyuki. In my indicator we have 17 types of moving averages which can be selected in the settings.
It is a trend indicator, the base of the wave is a moving average and 4 Average True Range (ATR) Bands derived from the baseline are formed.
There are also 3 moving averages in a guppy style, these 3 moving averages can also be configured.
The moving average options are:
SMA ---> Simple
WMA ---> Weighted
VWMA ---> Volume Weighted
EMA ---> Exponential
DEMA ---> Double EMA
ALMA ---> Arnaud Legoux
HMA ---> Hull MA
SMMA ---> Smoothed
LSMA ---> Least Squares
KAMA ---> Kaufman Adaptive
TEMA ---> Triple EMA
ZLEMA ---> Zero Lag
FRAMA ---> Fractal Adaptive
VIDYA ---> Variable Index Dynamic Average
JMA ---> Jurik Moving Average
T3 ---> Tillson
TRIMA ---> Triangular
All settings are available for changing inputs.
wnG - VWAP MOD Modified version of VWAP :
Classic VWAP with 6 levels based on the Average True Range to identify the distance and distribution of the prices around the VWAP.
There are 2 calcul methodologies for the bands
- Last 24 Hours Average True Range
- Progressive Average True Range starting from 00:00
As prices tend to move around the VWAP level, favor LONG positions in the GREEN ZONE (and SHORT in the RED ZONE).
How to use it :
Avoid taking long position when price is in the RED ZONE
Avoid taking short position when price is in the GREEN ZONE
==> Adjust the settings depending on your timeframe and asset
Rudy's BB with MartingaleMy first strategy script that uses Bollinger Bands and Martingale to increase contract size after negative profit.
[MAD] FibchannelsThis is an indicator that gives you bands around the Fibonacci levels High/Low of the asset.
There are 3 time frames available so you can use the hourly, daily and weekly at the same time.
You can change the bands via selectable inputs to suit your own preferences.
you can as example combine with RSI or MACD to find a entry
Weighted Standard Deviation BandsLinearly weighted standard deviations over linearly weighted mean.
The rationale of the study can be deduced from my latest publications where I go deeper into explaining the benefits of linear weighting, but in short, I can remind that by using linear weighting we are able to increase the information gain by communicating the sequential nature of time series to the calculations via linear weighting.
Note, that multiplier parameters can take both negative and positive values resulting in ability to have, for example, 1st and 6th weighted standard deviations higher than the weighted mean.
Despite the modification of the classic standard deviation formula, I assume that mathematical qualities of standard deviation will hold due to the fact we can alternately weight the window itself, and then apply the classic standard deviation over the weighted window. In both cases, the results will be the same.
Aight that was too formal, but your short strangles should be happy
Here is it, for you
RSI_OTT - TP/SLWhile creating this strategy, I was inspired by "ott(by Anıl Özekşi)" and "RSI + Bollinger Double Strategy(by ChartArt)".
Basically, the strategy uses ott bands instead of bollinger bands in the "RSI+Bollinger Double Strategy".
User can select take profit, stop loss, position direction(long, short or both) and the other ott parameters via interface.
[RS]Bollinger Bands Breakout Candles V0EXPERIMENTAL: a experiment using bollingers and directional momentum, Breakout detector.
Specter Trend Cloud [ChartPrime]⯁ OVERVIEW
Specter Trend Cloud is a flexible moving-average–based trend tool that builds a colored “cloud” around market direction and highlights key retest opportunities. Using two adaptive MAs (short vs. long), offset by ATR for volatility adjustment, it shades the background with a gradient cloud that switches color on trend flips. When price pulls back to retest the short MA during an active trend, the script plots diamond markers and extends dotted levels from that retest price. If price later breaks through that level, the extension is terminated—giving traders a clean visual of valid vs. invalid retests.
⯁ KEY FEATURES
Multi-MA Core Engine:
Choose from SMA, EMA, SMMA (RMA), WMA, or VWMA as the base. The indicator tracks both a short-term MA (Length) and a longer twin (2 × Length).
Volatility-Adjusted Offset:
Both MAs are shifted by ATR(200) depending on trend direction—pulling them down in uptrends, up in downtrends—so the cloud reflects realistic breathing room instead of razor-thin bands.
Gradient Trend Cloud:
Between the two shifted MAs, the script fills a shaded region:
• Aqua cloud = bullish trend
• Orange cloud = bearish trend
Gradient intensity increases toward the active edge, providing a visual sense of strength.
Trend Flip Logic:
A flip occurs whenever the short MA crosses above or below the long MA. The cloud instantly changes color and begins tracking the new regime.
Retest Detection:
During an ongoing trend (no flip), if price retests the short MA within a 5-bar “cooldown,” the tool:
• Marks the retest with diamond shapes below/above the bar.
• Draws a dotted horizontal line from the retest price, extending into the future.
Automatic Level Termination:
If price later closes through that dotted level, the line disappears—keeping only active, respected retest levels on your chart.
⯁ HOW IT WORKS (UNDER THE HOOD)
MA Calculations:
ma1 = MA(src, Length), ma2 = MA(src, 2 × Length).
Trend = ma1 > ma2 (bull) or ma1 < ma2 (bear).
ATR shift offsets both ma1 and ma2 by ±ATR depending on trend.
Cloud Fill:
Plots ma1 and ma2 (invisible for long MA). Uses fill() with semi-transparent aqua/orange gradient between the two.
Retest Logic:
• Bullish retest: ta.crossover(low, ma1) while trend = bull.
• Bearish retest: ta.crossunder(high, ma1) while trend = bear.
Only valid if at least 5 bars have passed since last retest.
When triggered, it stores bar index and price, draws diamonds, and extends a dotted line.
Level Clearing:
If current high > retest upper line (bearish case) or low < retest lower line (bullish case), that line is deleted (stops extending).
⯁ USAGE
Use the cloud color as the higher-level trend bias (aqua = long, orange = short).
Look for diamonds + dotted lines as pullback/retest zones where trend continuation may launch.
If a retest level holds and price rebounds, it strengthens confidence in the trend.
If a retest level is broken, treat it as a warning of weakening trend or possible reversal.
Experiment with MA Type (SMA vs. EMA, etc.) to align sensitivity with your asset or timeframe.
Adjust Length for faster flips on low timeframes or smoother signals on higher ones.
⯁ CONCLUSION
Specter Trend Cloud combines trend detection, volatility-adjusted shading, and retest visualization into a single tool. The gradient cloud provides instant clarity on direction, while diamonds and dotted retest levels give you tactical entry/retest zones that self-clean when invalidated. It’s a versatile trend-following and confirmation layer, adaptable across multiple assets and styles.
EMA Envelope + SMA + Purple DotThis indicator combines three tools into one:
📈 EMA Envelope with wedge and range contraction signals to highlight volatility squeezes.
🔵 SMA with optional smoothing (SMA/EMA/WMA/SMMA/VWMA) and optional Bollinger Bands.
🟣 Purple Dot “PowerBars” that mark strong momentum bars when price ROC (%) and volume exceed user-defined thresholds.
It also includes:
Background highlighting of contraction zones (bullish/bearish/neutral colors).
A summary table showing PowerBar count and return (%) over custom lookback periods.
Flexible display settings (table position, dark/light theme, highlight toggle).
Designed for traders who want to track momentum bursts, volatility contraction, and trend strength all in one tool.
ATR-limited Donchian ChannelThe ATR-limited Donchian Channel is a modified version of the classic Donchian Channel that adapts more quickly to changing market conditions.
While a traditional Donchian Channel is based only on the highest high and lowest low over a given lookback period, this version introduces an ATR-based constraint that prevents the channel lines from extending too far away from price. This makes the channel more responsive and reduces lag compared to the standard Donchian Channel.
How it works
The upper band is based on the highest high of the last N candles, but it cannot exceed a maximum distance of ATR × Factor above the current median price (midpoint of high and low).
The lower band is based on the lowest low of the last N candles, but it cannot drop more than ATR × Factor below the median price.
If the Donchian Channel would normally extend further than this ATR-limited boundary, the line is capped and marked in blue .
Otherwise, the upper band is drawn in red and the lower band in green .
A middle line is also plotted as the average of the modified upper and lower bands.
An optional offset allows you to shift the channel backward or forward in time for easier visual alignment.
Why use this version?
Faster reaction: By constraining the channel with ATR, the indicator adapts quicker to volatility changes and avoids long periods of overextended levels.
Noise control: ATR filtering prevents extreme spikes or outlier highs/lows from stretching the channel unnecessarily.
Visual clarity: Color-coding highlights when ATR filtering is active, making it easy to distinguish capped vs. natural Donchian levels.
Typical use cases
Trend-following breakout systems, but with volatility-aware limits.
Identifying dynamic support and resistance zones that adjust to market conditions.
Filtering false breakouts by monitoring when the Donchian channel is capped by ATR.
✅ This indicator is designed for traders who want the structure of a Donchian Channel but with an adaptive, volatility-sensitive adjustment that makes it react faster and more reliably than the classic version.
Turtle Trading System IndicatorKey Features & Components
Donchian Channels
The core of the indicator is the Donchian Channel, represented by the upper and lower blue bands.
Upper Channel: The highest price over a user-defined period.
Lower Channel: The lowest price over the same period.
Middle Line: The midpoint between the upper and lower channels.
These channels are used to identify potential breakouts, which form the basis for trade entries.
Trading Signals
The script automatically generates clear, non-repainting signals for potential trades:
Long Entry (Green ▲): A green upward-facing triangle appears below the candle when the closing price breaks above the upper Donchian channel, signaling the start of a potential uptrend.
Short Entry (Red ▼): A red downward-facing triangle appears above the candle when the closing price breaks below the lower Donchian channel, signaling the start of a potential downtrend.
Long Exit (Green X): A green cross appears above the candle when the price crosses below the middle line, suggesting the uptrend is weakening.
Short Exit (Orange X): An orange cross appears below the candle when the price crosses above the middle line, suggesting the downtrend is losing momentum.
Integrated Risk Management
A crucial element of the Turtle strategy is disciplined risk management, which is built into this indicator.
Volatility-Based Position Sizing
You can enable position sizing that adapts to market volatility using the Average True Range (ATR). When an entry signal occurs, a label appears showing a calculated position size unit. The formula aims to normalize risk, meaning you would trade smaller sizes in volatile markets and larger sizes in calmer markets. The formula used is:
Volatility Unit=
100
Risk %
×
4×ATR
Close Price
Dynamic Stop Loss
Upon a long or short entry, a stop-loss level is plotted on the chart as red circles. This level is calculated based on the ATR, automatically adjusting to the market's current volatility to provide a data-driven exit point for managing losses. It is calculated as:
Long Stop: Close Price - 1.8 * ATR
Short Stop: Close Price + 1.8 * ATR
On-Chart Information Panel
A convenient table is displayed in the bottom-right corner of the chart, showing the current ATR value and the calculated Position Size unit for quick and easy reference.
Customizable Settings
You can tailor the indicator to your specific strategy and risk tolerance:
Donchian Channel Period: Sets the lookback period for the channels. The default is 20. Shorter periods will be more sensitive and generate more signals.
ATR Period: Sets the lookback period for the Average True Range calculation, affecting both position size and stop-loss levels. The default is 14.
Risk Percentage: The percentage of equity you wish to risk per trade. This directly influences the position size calculation.
Use Volatility Position Sizing: A simple checkbox to turn the ATR-based position sizing on or off.